
BORM POINTS – NEW CONCEPT PROPOSAL OF
COMPLEXITY ESTIMATION METHOD
Zdeněk Struska and Vojtěch Merunka
Department of Information Engineering, Faculty of Economics and Management
Czech University of Life Sciences in Prague, Kamycka 129, 165 21 Prague 6 – Suchdol, Czech Republic
Keywords: BORM method, analysis and design of information systems, complexity, design phases of information
system, BORM points, technical factor, environment factor, customer factor and productivity factor.
Abstract: This paper contains an introduction of new method ‘BORM points’ from the area of complexity estimation
in object environment. In the first part of the paper there is a BORM description (Business and Object
Relation Modelling). In the second part there is a world-wide premiere of ‘BORM points’' concept. It is the
suggestion of estimation method using for the BORM environment. At the end of the paper there is list of
next steps to finish the methods and promote it to the wide scientific communities.
1 INTRODUCTION
First methods developed for software project
complexity estimation were designed in the 1970’s.
‘Function points’ method introduced by Allan
Albrecht, originally called the ‘IBM function
points’, was become one of the most well known
estimation method.
IFPUG (International function points users
group) ‘function points’ are marked like the direct
follower of all. Next method is ‘Feature points’,
which was developed during ‘function points’
testing on management information systems.
‘Feature points’ eliminated one ‘function points’’
disadvantage – inaccurate estimation of information
systems (IS) consisting of many algorithms. By
these systems ‘function points’ predicted higher
values than ‘feature points’ (Struska, 2005).
Unfortunately, all these approaches did not
reflect current style of software development, which
is based on strong object–oriented paradigm and
agile approach. This is why, in the 1990’s the
introduction of ‘use case points’ was move in the
area of complexity estimation. This method based on
‘function points’ added a new dimension to the area
of complexity estimation (Struska, 2005). Our
approach continues this idea of ‘use case points’
towards business analysis of information systems
assembled by the pure object-oriented technology.
We are presenting a new method for information
systems estimation in BORM methodology
(Business and Object Relation Modelling) in
connection with studying ‘use case points’.
This paper introduces a concept of new method –
‘BORM points’, which applies estimation technique
rules for the BORM methodology. The ‘BORM
points’ frame is deduced from ‘use case points’.
Therefore the new ‘BORM points’ has additional
factor - “customer factor“, which should represent
customers‘ requirements in the information system
project.
2 METHOD CONCEPT
The BORM (Business and Object Relation
Modelling) method has been in use since 1993.
From the beginning the BORM was oriented on the
support of pure object-oriented programming
languages and development environment software
systems design, which are for example Smalltalk
environment and non-relational object databases.
BORM can be used not only for software design, but
for requirement analysis of planned systems and
business process modelling, as well.
BORM development has been supported by
Deloitte&Touche Czech Republic and Central
Europe, where the method is currently being used.
580
Struska Z. and Merunka V. (2007).
BORM POINTS – NEW CONCEPT PROPOSAL OF COMPLEXITY ESTIMATION METHOD.
In Proceedings of the Ninth International Conference on Enterprise Information Systems - ISAS, pages 580-586
DOI: 10.5220/0002389105800586
Copyright
c
SciTePress
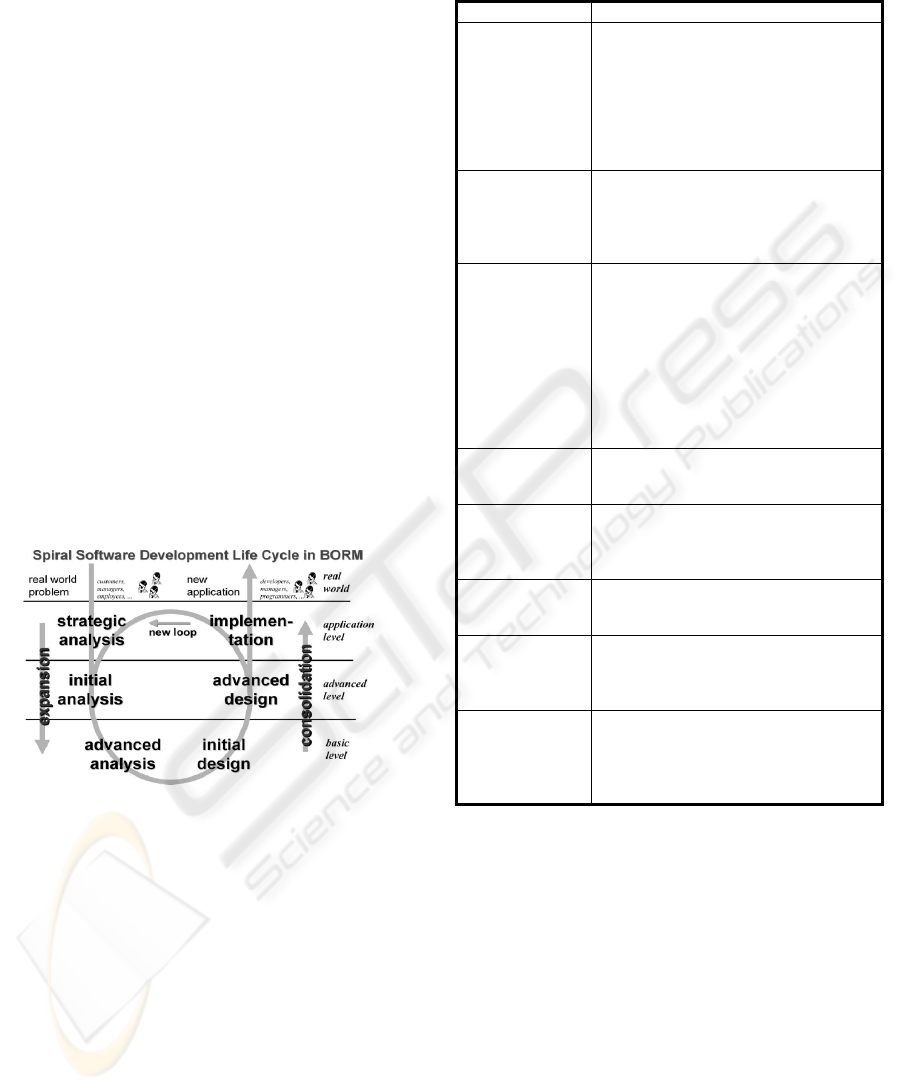
BORM differentiates 6 phases of the system
development lifecycle (Carda, Merunka and Polak,
2003):
1) Strategic analysis – determination of problem,
interface is defined here, basic processes are
recognized, which occur in the system or in its
neighbourhood.
2) Initial analysis – recognition of problem,
required processes in system and properties of
basic objects are mapping including its share on
the processes.
3) Advanced analysis – development of analysis
into details of individual object types (set of
objects, object classes) and object linkages
(composition, inheritance, dependences…).
4) Initial design – we try to set up a system to be
able software implementation.
5) Advanced design – items of existing model are
transformed in so form, which is applicable in
the target implementation environment. In this
phase properties of programming languages,
databases are take into consideration.
6) Implementation (design, program composition) –
required software is designed (programming,
generation by the help of CASE).
Figure 1: 6 phases of system development lifecycle in
BORM (Knott, Merunka and Polak, 2003).
The BORM method covers two level of
information system proposal – business analysis of
IS and conceptual analysis of IS. Business analysis
is concerning with current and future process
mapping, which is described by functions, scenarios,
architecture and business diagrams. Conceptual
analysis reassumes the results of business analysis to
transform the business model into programmers’
submissions, which are described by the objects and
classes diagram, software objects diagram and the
software component diagram.
Table 1: Explanation of BORM notions. (Carda, Merunka
and Polak, 2003).
Notions Explanation
Architecture
Provides complex system models, which
consist of layers, which concerns with
models of one side of the system.
For example layers of processes, logical
model (data, functions and rules
description) and component model (e.g.
software application or organisational
structure).
Activity
Activities introduce individual parts of
business objects behaviour to, how they
were recognized by OBA technique. In
business diagrams transition between
object states are realized by activities.
Business
diagram
This diagram introduces a map of all
possible process development in current
display of two dimensions of this
problem. Roles of participating objects as
automatic machine with states and
transitions are first dimension. Sequences
of communications between objects,
which represent driving and data flow
between objects in process, are the
second dimension.
Communication
Activities diving of business objects.
Communication is report abstraction
between objects.
Data flow
Data, which objects exchange through
communications or report sending, it
distinguishes report parameters and
return values.
Function
The simplest description of required
processes in system according to OBA.
Scenarios are derived from the functions.
Scenario
System scenario is more detailed
description of process in OBA technique.
There are 4 scenario parts – initiation,
action, list of participants and result.
State
State represents concrete constellation of
automatic machine in time. If automatic
machine receives some data flows, it can
initiate transition from one state to
second state.
We consider business diagrams the most
important point in BORM method. For design this
main output from IS business analysis functions,
scenarios, participants and data flow has to be
defined for the business diagram creation. Each
involved participant performs as well as activities
and states.
Transitions between states and activities are
completed by communications connecting activities
with activities of other participants. Business
diagrams can be improved by data flows that are
exchanged between individual participants. These
can be informational, financial or material flows
(documents, forms, confirmations, etc.). Explanation
of these notions can be found in table 1.
BORM POINTS – NEW CONCEPT PROPOSAL OF COMPLEXITY ESTIMATION METHOD
581
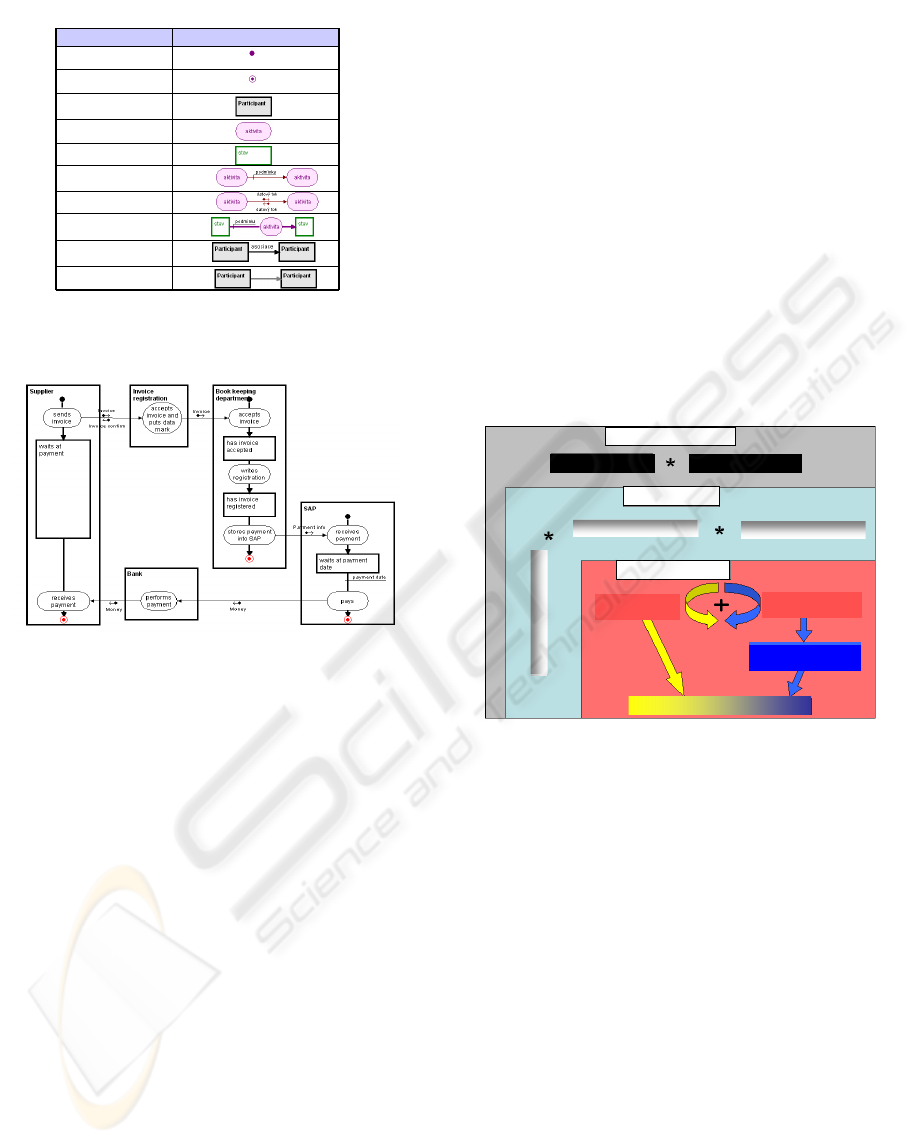
Notation of BORM business maps
Relationship between
Participants = assosiation.
Participants hierarchy
= „IS-A“ taxonomy.
Transition between
States
Data flow
Communication
State
Activity
Participant
End state
Start state
NotationDefinition
Figure 2: Notation of BORM business diagrams.
Figure 3: Business diagram in BORM.
BORM diagrams are used for information
systems requirement capture. Figure 3 displays
example of the invoice processing process in BORM
methodology.
We have chosen participants as the most
important element in the business diagram, because
they represent the concrete part of modelling reality.
It is possible to define participants as objects, which
have a distinct role in the modelling processes in
connection with proposal information systems.
Participants are not limited to persons, but can be
machines, information systems and other elements
taking part of the process.
The BORM method details can be found in
(Carda, Merunka and Polak, 2003), (Merunka,
2004),
(Knott, Merunka and Polak, 2003), (Merunka,
2002).
3 BORM POINTS METHOD
The concept of ‘BORM points’ (BORMp) is based
on the calculation of ‘use case points’ (Struska and
Pergl, 2006). ‘Use case points’ are method used for
complexity estimation of information systems. The
‘BORM points’ use chosen parts of ‘use case
points’, which are useful for the BORM
methodology.
New ‘BORM points’ method is designed to
eliminate the known disadvantages of ‘use case
points’. We think that one of them is small
concentration on customer. The customer with his
requirements can influence project complexity very
much.
The ‘BORM points’ try to estimate the
complexity on the basis of chosen components,
which are characteristic for BORM. Calculation is
divided into two independent parts. In the first step
the number of participants and the number of
business diagram is counted. The second step
consists of technical, environment and customer
factors evaluation.
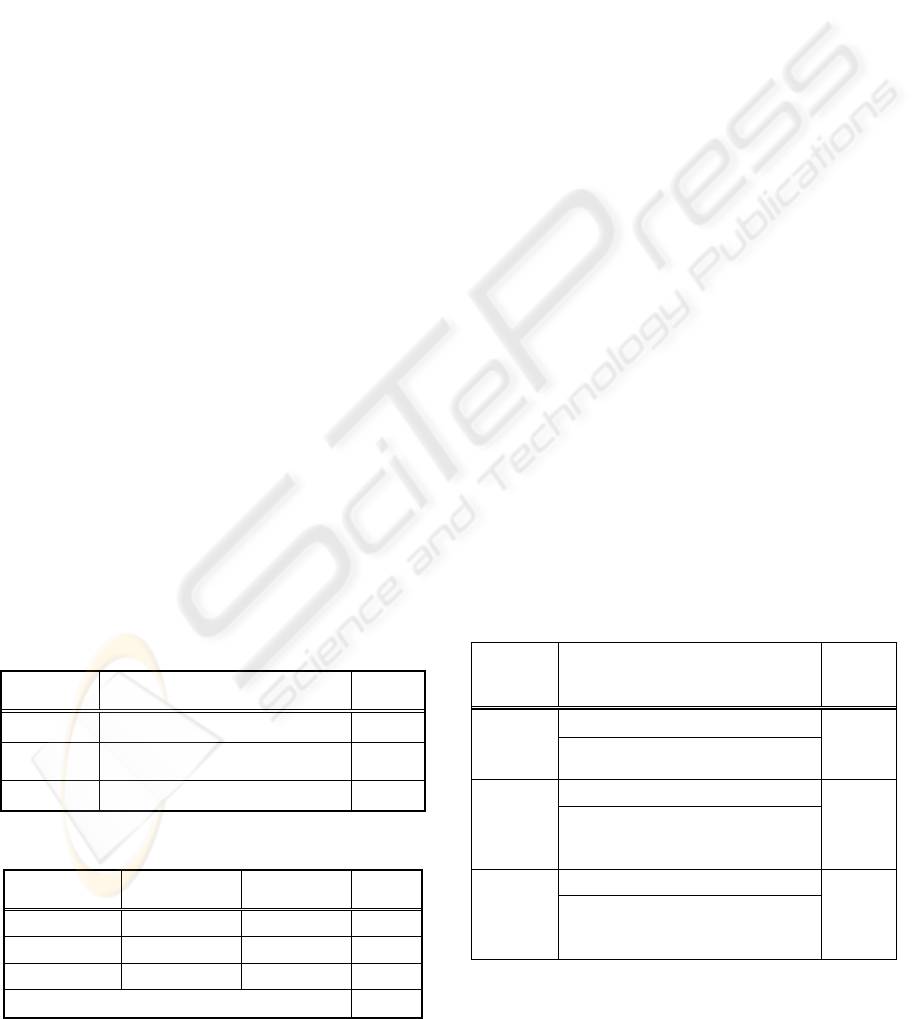
Total BORM points
Adjusted number
Unadjusted number
Adjusted
number
Unadjusted number
Technical factor
Environment factor
Customer factor
Number of
participants
complex – average - simple
Number of business
diagrams
Number of activities
and communications
Figure 4: Structure of BORM points calculation.
3.1 Complexity Estimation by BORM
Points
Calculation of complexity estimation by ‘BORM
points’ is divided into two steps. The reason is that it
is necessary to separate the unadjusted number,
which is based on the real modelling system and
technical, environment and customer factor, which
evaluate the environment in, which information
systems are designed.
In the first step we count unadjusted number,
in the second we evaluate individual factors –
technical, environment and customer factors:
Unadjusted part of BORM points,
o Number of participants,
o Number of business diagrams.
Technical factor.
Environment factor.
Customer factor.
Productivity factor.
ICEIS 2007 - International Conference on Enterprise Information Systems
582
3.2 Unadjusted Part of BORM Points
The first part divides the count in next two parts.
This separation provides clear definition of the
participants number and number of the business
diagrams. The unadjusted part is directly connected
with the designed information system.
3.2.1 Unadjusted Participant Weights
(uapw)
We suppose that participants are external objects,
which have a relationship with system. They are
defined like users, next programs, data warehouses,
etc. This should be a part included project
documentation.
Participants are divided by their complexity:
simple – average - complex.
Simple – different system with interface to measured
system through various automated
programs (e.g. standard application
program).
Average – either next system, which is connected
with measured system through protocol or
through user interface. Average participant
cooperates with the system through
protocol (e. g. http, TCP/IP) or next
participant type can be data warehouse.
Complex – person cooperates with the system
through graphical interface (mostly final users,
which are classified as complex) After participant’s
separation into three categories are counted their
numbers in individual category. Individual
participant gets weight 1; average gets weight 2 and
complex 3. Total unadjusted participants weight is
counted in table 3.
Table 2: Proposal of weights for individual participants’
category.
Participant
type
Definition Weight
Simple
System interface
1
Average
Interactive or protocol driven
interface
2
Complex
Graphical interface (human factor)
3
Table 3: Proposal of total unadjusted participants weight.
Participants
type
Participants
weight
Participants
number
Total
Simple
1 __ • 1 =
Average
2
__ • 2 =
Complex
3
__ • 3 =
Total unadjusted participants weight (upw)
3.2.2 Unadjusted Business Diagram Weights
(ubdw)
BORM is used for its wide area of process mapping
(including IT mapping). Therefore it is necessary to
identify business diagrams, which are directly
connected with the designed information system.
The business diagrams get complexity weight
according to their number of activities and/ or
transactions.
First the business diagrams are divided into the
following three categories:
simple – average – complex.
Separation is realized on the base of activities
number and transactions number, border values are
suggested in table 4.
The activities were chosen for complexity
definition by reason of they represent situations,
which participants have to solve. In business
diagrams the transactions are performed with the
help of chosen activities and they communicate with
activities of cooperated objects at the same time.
Activities are important for conceptual analysis as
well because they are used for methods deduction.
Next criteria are communication number
between individual activities of participants and
number of transactions between states and activities
by all engaged participants in the business diagram
at the same time. These two numbers are counted
and used like the second evaluative factor with
lower priority. In the situation where the
communications are out of the interval, it is
recommended to determine according to activities
number.
Table 4: Factors proposal for complexity estimation by
business diagrams.
Business
diagram
type Description Weight
1 - 5 activities
Simple
or 3 – 11 communications
(communications + transactions)
5
6 - 10 activities
Average
or 12 – communications
(communications +
transactions)
10
11 and more activities
Complex
or 18 and more
communications
(communications + transactions)
15
BORM POINTS – NEW CONCEPT PROPOSAL OF COMPLEXITY ESTIMATION METHOD
583

Every level of complexity receives the weight
according to number of activities and
communications (table 4). Further sum of business
diagrams’ numbers perform in individual categories,
it is multiplied by assigned weight and then the rows
of the table are counted (table 5).
Table 5: Proposal of total unadjusted business diagram
weight.
Business
diagram
type
Activities
number
Business
diagram
weight
Count Total
Simple 1 – 5 5 __ • 5 =
Average 6 – 10 10
__ • 10 =
Complex
11 and more 15
__ • 15 =
Total unadjusted business diagram weight (ubdw)
3.2.3 Unadjusted BORM Points (uBORMp)
Total unadjusted ‘BORM points’ are the sum of the
two numbered parts – unadjusted participant weight
(upw) and unadjusted business diagram weight
(ubdw).
unadjusted BORM points (uBORMp) = upw
+ ubdw
(1)
3.3 Technical Factor
Technical factor is necessary to specify in the
second part of method.
Table 6: BORMp – Technical factors.
Factor
number
Description
t1 Distributed system
t2
Response time or throughput performance
objectives
t3 End user efficiency
t4 Complex internal processing
t5 Code must be reusable
t6 Easy to install
t7 Easy to use
t8 Portable
t9 Easy to change
t10 Concurrent
t11 Includes special security objectives
t12 Provides direct access for third parties
t13 Special user training facilities are required
Total technical factor (tFactor)
In table 6 there are 13 factors, which define
technical project site of the designed information
system. Evaluation scale is from 0 to 5: the factor
with no influence gets 0; the most considerable
factor gets 5.
‘BORM points’ use the same table for technical
factor as ‘use case points’. We think that these
factors cover sufficiently technical area of software
development, which is very important part of whole
project.
The factors with high impact on the project
should be identified here and evaluate with the
highest weight. The assigned values (0 – 5) are
multiplied with each factors’ weight and then
summed. Technical factor (tFactor) is counted this
way, further it is used in the formula – technical
complexity factor (tcf). The factors’ weights and the
formula for technical complexity factor are proposed
in the testing phase.
3.4 Environment Factor
The environment is in BORMp understood from the
view of supplier and that is the reason why
employee skills, used equipments or methods are
evaluated in the software development project.
These influences are coved by environment factor.
The evaluation is the same as the technical factor.
The first 8 factors are evaluated by weights (0 – non
influence, 5 – most considerable influence).
Table 7: BORMp – Customer factors.
Factor
number Description
e1
Familiar with the project model that is
used
e2 Application experience
e3 Object-oriented experience
e4 Lead analyst capability
e5 Motivation
e6 Stable requirements
e7 Part-time staff
e8 Difficult programming language
Total environment factor (eFactor)
After factor evaluation are assigned values to
multiple with factors’ weights and then summed to
give the total environment factor (eFactor). This
factor is used in the formula of environment
complexity factor (ecf). The factors’ weights and the
formula environment complexity factor are proposed
in the testing phase.
ICEIS 2007 - International Conference on Enterprise Information Systems
584

3.5 Customer Factor
The software development process of complexity
estimation ‘BORM points’ introduces new view –
“customer factor”. It should cover an impact of
customers’ requirements in the information system
project. As it was mentioned above uncoordinated
customer requirements can significantly affect effort
of information system development.
Procedure of its evaluation is the same as the
technical and environment factors. Six customer
factors are weighted from 0 – 5 (0 – non influence, 5
– most considerable influence).
Table 8: BORMp – Customer factors.
Factor
number
Description
c1 Knowledge of IS
c2 Customer’s project manager capacity
c3 Customer’s project members capacity
c4 Knowledge of project organisation
c5 Connection with existing IT projects
c6 Complexity of replaced IS
Total customer factor (cFactor)
After factor evaluation they are multiplied with
their weights and then summed. The result is total
customer factor (cFactor), which is used to
determine customer complexity factor (ccf). Its
result is value of customer factor. The factors’
weights and the formula customer complexity factor
are proposed in the testing phase as well.
3.6 Productivity Factor
Important input for methods of complexity
estimation is productivity factor as well. It is
recommended number of man-hours per one BORM
point in dependence on various influences (e. g.
experience of project team, size of IS development,
etc.).
We suppose higher value than by ‘use case
points’; reason is customer factor, which BORMp
introduce.
‘use case points’ use simple rule for
determination of man-hours per use case point. The
number of factors in e1 through e6 that are below 3
are counted and added to the number of factors in e7
through e8 that are above 3. if the total is 2 or less,
the general idea is to use twenty staff hours per ucp;
if the total is 3 or 4, use twenty-eight staff hours per
ucp. If the number exceeds 5, it is usually
recommended that changes should be made to the
project so the number can be adjusted because in this
case the risk is unacceptably high. another
possibility is to increase the number of staff hours to
thirty-six per use case point.
Similar rule will be very helpful in next phases
of ‘BORM points’ development and we would like
to create it too.
3.7 Total BORM Points
Above counted numbers are installed to one
formula, which will count result of adjusted ‘BORM
points’. The formula consists of unadjusted part
(participant and business diagram number) and
technical, environment and customer factor.
aBORMp = uBORMp
•
tcf
•
ecf
•
ccf (2)
The complexity is now defined by non-
dimensional number, which is the result of the
aBORMp formula. To get actual effort it is
necessary to multiple adjusted BORMp and
productivity factor.
Effort = aBORMp
•
pf (3)
4 CONCLUSIONS
We understand the introduced BORMp concept like
the start for next research. Very important next step
is a set of weights by technical, environment and
customer factors and number their formulas.
Important will be definition man-hours per one
BORMp.
Numbers and evaluations of value (mentioned
above) are realized on the concrete projects, which
are designed in BORM. We believe that introduced
method can become usable instrument for
complexity estimation in IT projects, where software
requirements must be carefully captured via detailed
business analysis.
REFERENCES
Albrecht, A. J. and Gaffney, J. E., Jr., 1983. Software
Functions, Source Line sof Code and Development
Effort Prediction.: A Software Science Validation,
IEEE Transactions on Software Engineering (TSE) 9,
no. 6.
Carda A., Merunka V., Polák J., 2003. The art of system
design (in czech), Grada, ISBN 80-247-0424-2
BORM POINTS – NEW CONCEPT PROPOSAL OF COMPLEXITY ESTIMATION METHOD
585

Hall J., Merunka V., Polák J. et al., 2004. Accounting
information systems - Part 4: System development
activities , Thomson South-Western New York, 4th
edition, ISBN 0-324-19202-9
International Function Point Users Group, 2002. IT
Measurement Practial Advice from the Experts,
Addison-Wesley Boston. ISBN 0-201-74158-X.
Karner, G., 1993. Use Case Points - Resource Estimation
for Objectory Projects, Objective Systems SF AB
(copyright owned by Rational Software).
Knott, R., Merunka, V., Polak, J., 2003. The BORM
methodology: a third-generation fully object-oriented
methodology In: Knowledge-Based Systems Elsevier
Science International New York, ISSN 0950-705
Liping, L., Roussev, B., Knott, R., Merunka, V., Polák, J.
et al., 2005. Management of the Object-Oriented
Development Process - Part 15: BORM Methodology,
Idea Group Publishing. ISBN 1-59140-605-6
Merunka, V., 2004. Object oriented database
normalization. In the proceeding conference Objecty
2004. Prague. ISBN 80-248-0672-X.
Merunka, V., 2002. BORM – overview of the
methodology and case study of agrarian information
system In: UZPI Agriculture economics. Prague.
ISNN 0139-570X
Pergl, R., Struska, Z., 2006. Agile modelling and BORM
methodology. In the proceeding conference of
Software development 2006. Ostrava. ISBN 80-248-
1082-4
Struska, Z, Pergl, R., 2006. Model based on Effort
estimation methods. In the proceeding conference of
Software development 2006. Ostrava. ISBN 80-248-
1082-4
Struska, Z., 2005. Complexity estimation method in object
oriented environment – Function and Feature points.
In the proceeding conference of Objekty 2005.
Ostrava. ISBN 80-213-0682-3.
Struska, Z., Vaníček, J., 2005. Measurement and rating of
information systems quality. Part 3: Design
Complexity and Software Engineering Consequences.
PEF ČZU Prague.
Struska, Z., Vaníček, J., 2005. Measurement and rating of
information systems quality. Part 2: Quality Model,
PEF ČZU Prague.
Struska Z., Pergl, R., 2006. The Comparison of Methods
COCOMO and Function Points Analysis. In the
proceeding conference of Agrarian prospects 2006.
Prague. ISBN 80-213-1531-8.
Struska, Z., 2005. Comparison of miscelaneous
approchaes to function points application. In the
proceeding conference of Agrarian prospects 2005.
Prague. ISBN 80-213-1372-2.
Vaníček, J., 2004. Measurement and estimation of
information system quality (in czech), PEF
ČZU
Prague. ISBN 80-213-0667-X.
ICEIS 2007 - International Conference on Enterprise Information Systems
586
