
An Innovative Method for Business Process Modeling
Joseph Barjis
Georgia Southern University
Abstract. As a core area in the IS research field, business process modeling has
long attracted theoreticians of new concepts, designers of artifacts, and
practitioners of modeling. Their diligent efforts have resulted in numerous
methods (e.g., UML, EPC, Flowcharts) for process modeling. The existing
methods have been challenged in certain aspects. First, they mainly represent a
flowchart model capturing only the normal flow of activities ignoring the depth
or nested structure of processes. Second, they are informal or semi-formal, not
lending to model checking and formal analysis without further translations and
mapping procedures. Also the existing methods are more about control-flow
than interaction of human actors. In this paper we discuss an innovative method
hoping it will address the existing challenges and gap the disconnections, or, at
least, provide an improved tool for that purpose. The proposed method
encompasses a set of graphical notations fit into the concept it is based upon.
1 Introduction
Study of Enterprises Information Systems (EIS) cannot be performed completely and
adequately unless conducted in the organizational and social context, in which the
envisioned EIS will have to operate and support business processes. An EIS is not
machinery alone or a collection of IT components, but a complex socio-technical
phenomenon, where processes and people are the other two main components. The
business processes, that an EIS supports, are better understood through the study of
the interactions (communication, coordination, negotiation and commitments) enacted
in the users’ behavior as they carry out the organization’s mission. Thus, an accurate
EIS design entails a significant deal of human communication and interaction study
(Winograd 1997). For example, a customer interacts with an insurance company to
request a new policy. The insurance company agent makes a commitment to the
customer to process the request and presents the customer with a result. Once the
result is presented, it may lead to further negotiations, decline or acceptance of the
result by the customer. The acceptance of the result also implies some obligations on
the customer, such as the policy premium payment. This is what most researchers
refer to as the interaction-based business process modeling approach developed
within the Language-Action Perspective community and having roots in the speech
act theory. The interested reader is referred to the Communications of the ACM
Special Issue “Two decades of the Language-Action Perspective” (Communications
of the ACM, May 2006, Volume 49, Issue 5), where contributions of pioneering
authors of the LAP community are published.
Barjis J. (2007).
An Innovative Method for Business Process Modeling.
In Proceedings of the 5th International Workshop on Modelling, Simulation, Verification and Validation of Enterprise Information Systems, pages 31-42
DOI: 10.5220/0002434000310042
Copyright
c
SciTePress

The emergence of Business Process Modeling as a dominant component in the
EIS context has been widely recognized. According to (Ould, 1995), the importance
of process modeling denotes a requirement for a number of ISO 9000 quality
programs. Business process modeling is the basis of process-centric IT systems
implementations, e.g., Enterprise Resource Planning systems (Robinson & Dilts,
1999). The increasing interest in business process modeling as a tool for capturing
requirements and graphically documenting the processes of an organization to be
supported by the envisioned EIS is widely evident from the mainstream literature
(Dietz 2006). However, this complex social phenomenon is more complicated than
the scope and features of the conventional methods used for its study.
A business process is not merely a flow of successful events, but rather a complex
combination of activities, exceptions, and alternatives evolving in a horizontal
progression as well as in vertical development, i.e., having breadth and depth in a
layered and nested structure.
Finally, it is a fact that over the past few decades, businesses were misguided by
the belief that IT alone will solve all their corporate woes, and consequently
businesses overemphasized the role of IT while underestimating the importance of a
clear understanding and critical analysis of their business processes (Carr 2003).
However, the tide has turned and the prevailing standpoint in recent publications
suggests a much greater focus on process-centric and process-driven enterprises,
rather than merely investing in complicated expensive EIS. Therefore, in the hope of a
humble contribution to fill this gap, in this paper we discuss and introduce a business
process method based on an innovative concept derived from the Language-Action
Perspective and based on Petri net formalism.
2 Related Works
Application of Petri nets in organizational and business processes is not a new
research direction. Due to its formal semantics and intuitive diagrammatic
representation, Petri nets have long attracted researchers to use them in business
process modeling and design. An earlier paper introducing Business Process Petri Net
is (Moldt & Valk 1998). More examples of research in this area can be found in a
collection of papers in (Aalst et al. 1998) or in a comprehensive report of research
works at Eindhoven University, Netherlands, (Aalst & Hee 2002). Most of the Petri
net models proposed are dominantly process or workflow oriented rather than
business process in the sense of socially interacting and communicating actors. In the
framework that we apply Petri net, it is implied that the underlying system is of a
social nature, an organization where social actors make requests, commitments,
negotiations, and bring about new results. Thus, in the proposed method, the emphasis
is placed on the social characteristics of business process that better fits service
oriented organizations. In this regard it would be beneficial to mention that there are
numerous studies on the suitability of certain business process modeling methods for
one or another purpose (or perspective), e.g., for the purpose of business process
documentation, business process analysis and design, IS/IT Application design, and
so forth. Each of the methods fits well for a certain purpose or from a certain
perspective. Bider (2005) based on an extensive analysis of existing methods, states:
32

“There is no universal method of business process modeling suitable for all possible
projects in this field”. Analogously, we hope that our proposed method would serve as
a complement to the variety of existing methods with its suitability for a certain
perspective. In particular, the proposed method is well suited for service oriented
business systems with intensive interactions among participating actors, an
organization and customers, and across organizational processes.
We believe that the proposed method along with its associated notations better
contribute towards the requirements that a satisfactory method must meet in order to
enhance communication of the user requirements to the system designers, and in order
to adequately visualize the underlying conceptual notions. Some of the features that
we hope this method excels in are: rich graphical representation and yet lending to
formal analysis; modeling not only actions flow, but also actors’ interaction; dealing
with the deep (nested) structure of business process; embedded compact modeling.
Since in the core of this method lies the business transaction concept, the main body
of this paper is discussion of the business transaction concept.
3 Transaction: The Main Building Block
In the proposed method, the main concept and building block is called a Transaction
(or business transaction) adapted from the DEMO methodology (Dietz 2003, 2006).
According to the DEMO methodology, transaction has a generic pattern that consists
of three phases, delivers a new result and is carried out by two actors in close
collaboration. For example, applying for a new insurance policy is a transaction that
involves two actor roles (a customer and the insurance company). The deliverable
(result) of this transaction is a new policy. The Transaction Concept is based on the
Language Action Perspective, one of the theories of Information Systems.
Throughout this section, we will introduce different properties of a transaction along
with the artifacts we have developed to diagrammatically represent the corresponding
property that can be used for modeling business processes. The proposed artifacts are
based on the Petri net formalism.
Transactions are patterns of interactions and actions, as illustrated in Figure 1a
and distinguished by different colors. An action is the core of a business transaction
and represents an activity that brings about a new result, changing the state of the
world. An interaction is a communicative act involving two actors (actor roles) to
coordinate or negotiate. Examples of an interaction could be “requesting a new
insurance policy”, “clicking an apply/submit button on an electronic form”, “inserting
bank card into an ATM to withdraw cash”, or “pushing an elevator’s summon
button”. Replying to the interacting actors and fulfilling their requests is an action,
e.g., “issuing a new policy”, “processing an e-form”, “dispensing bills”, and “moving
an elevator to the corresponding floor”.
Each business transaction is carried out in three distinct phases, the Order phase,
the Execution phase, and the Result phase. These phases are abbreviated as O, E and
R correspondingly (see Figure 1b), and constitute the OER paradigm (Dietz 2003,
2006). The figure illustrates a business transaction in detailed OER form and compact
transaction form (T). Note that the order (O) and result (R) phases are interactions and
the execution (E) phase is an action, therefore they are illustrated using different
33
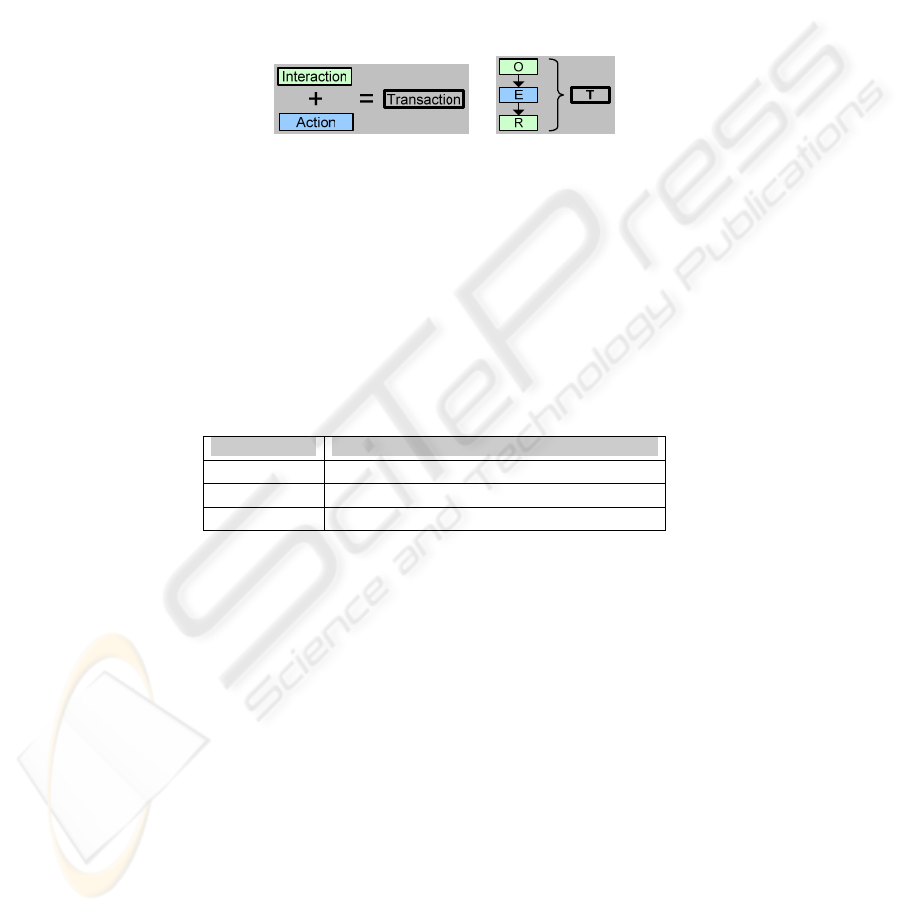
colors (the Execution phase is represented by a rectangle colored in blue, or gray in
grayscale printout). These three phases are a distinct feature that entails the discussed
method as a business process modeling technique versus just process modeling. The
three phases not only allow for the boundary of an actor (or business unit) to be
clearly defined, but also to depict interaction and action as a generic pattern involving
(social) actors. Compared to UML, Flowchart, EPC and other conventional modeling
methods, the transaction pattern clearly identifies the actors involved, as discussed
below. In other words, in conventional methods, a transaction would be reduced to
only one execution phase omitting information about the relevant actors and their
role.
a)
b)
Fig. 1. a) The transaction concept, b) The OER diagram (detailed and compact notations).
In a structured language, a transaction is described according to Table 1, where a
transaction is portrayed through the activity pattern it represents, its initiator,
executor, and the result it delivers (or the new fact it creates). For illustration, policy
issuance is described as a single transaction. Since real business processes are an
arbitrary chain of transactions with the involvement of numerous actors, it is
suggested to conveniently denote transactions by the letter “T” and accordingly
number them (T1, T2, T#), and actors by the letter “A” and number them (A1, A2,
A#).
Table. 1. Transaction description in a structured language.
Transaction: Issuing a new policy
Initiator
Customer
Executor
Insurance company OR agent
Result
A new policy is issued
Now, we try to introduce the further notions of the transaction concept along with
the Petri net notations we adapted. In general, Petri net structure consists of places
(graphically illustrated by circles, representing the result of an activity or process),
transitions (graphically illustrated by rectangles and representing an activity or
process) and directed arcs (graphically illustrated by arrows and representing flow
sequence). Figure 2a depicts a business transaction using the Petri net notations,
where each of the three phases (OER) is represented as a transition (rectangle or box).
In a compact notation, these three phases are compressed into a single transition,
called Transaction (T). In the figure, the start and the end places are marked by
different circles. These notations will show helpful when a complex process
consisting of several sub-processes is modeled.
Another notion of the transaction concept is the role of actors involved in a
transaction. Each business transaction is carried out by exactly two actors (or actor
roles), see Figure 2a. The actor that initiates the transaction is called the initiator of
the transaction, while the actor that executes the transaction is called the executor of
34
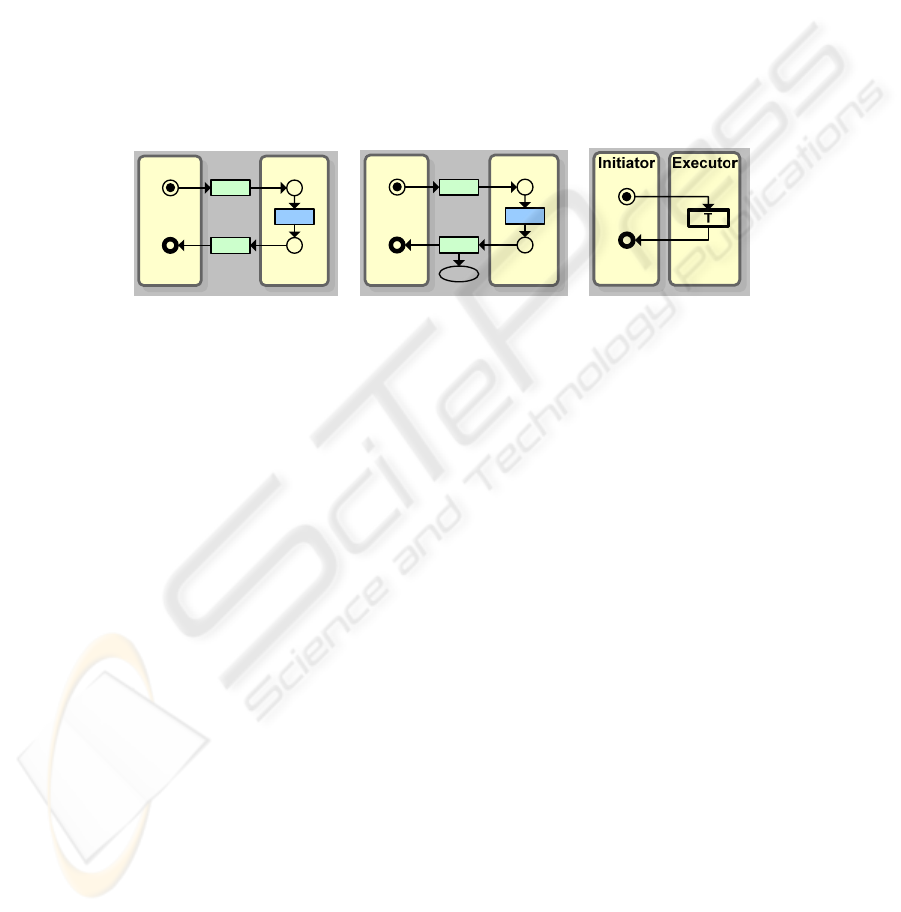
the transaction. Since the Order (O) and Result (R) phases are interactions between
the two actors, their corresponding transitions are positioned between the two actors.
The Execution (E) phase is an activity solely carried out by the executor and,
therefore, its corresponding transition is positioned within the confines (boundaries)
of the executor.
From Information System perspective, a transaction diagram should also represent
how the created result (data) is recorded. Since each transaction brings about a new
result, the Result phase of a transaction is linked to an oval-shaped element
representing the new result created (see Figure 2b). For simplicity sake, the depiction
of the oval representing a transaction result may be omitted in the models studied
later. If a business transaction is a simple one (not nesting further transactions), it is
better to compress its three phases into a compact notation, see Figure 2c. In this case,
the transaction is placed within the boundary of the executing actor, while the
initiation and ending points are placed within the boundary of the initiating actor.
a)
ExecutorInitiator
O
E
R
b)
ExecutorInitiator
O
E
R
R
c)
Fig. 2. A process diagram of transaction: a) detailed; b) with the result; c) compact.
Distinction is made between different types of transactions, simple (causal),
composite, and optional transactions. Actors’ interactions may be arbitrarily complex,
nested, extensive and multilayered (hierarchical). A complex process typically
consists of numerous transactions that are chained together and nested into each other.
A Simple (causal) transaction does not involve (trigger or cause) other transactions
during its execution (like in the above figure). It is carried out straightforwardly. In a
composite transaction, on the other hand, one or more phases will trigger further,
nested, transactions. For instance, think if actor A1 contacts actor A2 to reserve a
hotel room (we denote this request as Transaction 1, or T1). Actor A2 receives the
request and checks the room availability, but in order to fulfill the request, it has to
request actor A1 for a payment guarantee (we denote this second request as
Transaction 2, or T2). For actor A2 to complete the reservation transaction, first the
payment transaction should be completed. This process is represented in Figure 3a in
the form of a nested transaction. Notice that the Execution phase of T1 now has
several sub-phases or interactions, where each of the sub-phases is distinguished with
a letter of the alphabet attached to the transaction number (e.g., T1a/E denotes “first
sub-phase of the Execution phase of Transaction T1”). The process illustrated in the
figure starts with the receiving of a reservation request and checking the room
availability, then it waits for the payment transaction to get completed, only then the
Execution phase gets completed, let say, by conveying a confirmation number to the
first actor. A close look at the reservation process reveals that in fact, the payment
transaction, T2, is carried out between the hotel and a credit card company. Thus, the
process rather involves three actors (actor roles): A1 (customer or guest), A2 (hotel
receptionist) and A3 (credit card company). The interaction process between the three
35
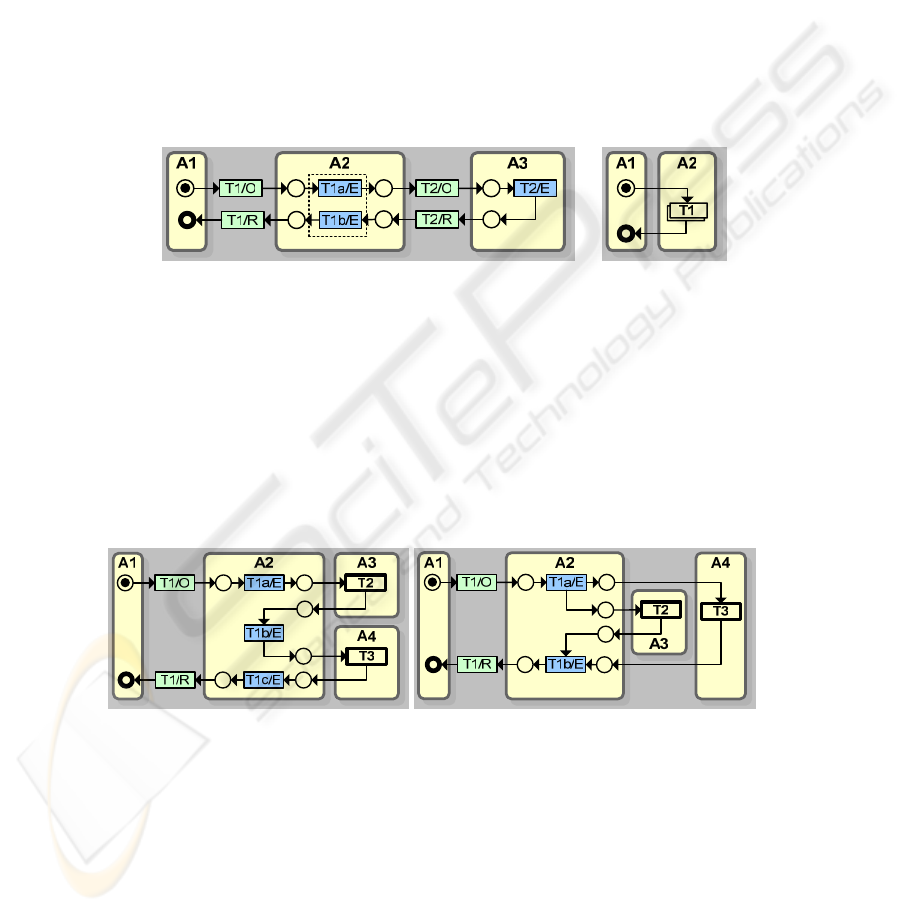
actors forms a nested transaction structure, which reveals the deep structure of
business process usually ignored or omitted in conventional methods.
One of the limitations in many modeling techniques is coping with complex real-
life systems. Usually models of real systems turn too large using diagrammatic
representation. In dealing with this issue, we introduce the “composite” (or nesting)
notation graphically represented as a multiple (layered) rectangle. For instance, the
model illustrated can be reduced to one composite transaction as shown in Figure 3b.
This can be applied to any part of a complex process for the sake of compactness or
for spotlighting a specific part of the process while concealing the other parts. The
notion of nesting structure is especially helpful in inter-organizational process
modeling in which a whole process within an organization or business unit can be
reduced to a single composite transaction, thus, keeping the model more manageable.
It should be noted that at any point (phase) an actor may quit the process or
decline to proceed or a process is terminated due to internal or external circumstances.
a)
b)
Fig. 3. Nested transactions with three actors: a) detailed; b) compact.
In this manner, complex processes with any number of transactions, actors and
outcomes can be modeled and illustrated. However, for more complex processes one
needs to use often the compact notation of a transaction in order to keep the model
better managed and controlled. The compact notation is useful for those transactions
that are simple (not nesting further transactions). If a compact notation is used, by a
convention, the whole transaction is positioned within the confines of the executing
actor. Two instances of such a compact modeling are represented in Figure 4. In the
first case, the nested transactions are initiated and executed in sequence, and in the
second case, they are initiated and executed in parallel.
Fig. 4. A model with nested transactions: in sequence and in parallel.
Another notion, a typical phenomenon in process modeling, is of probability of
some activities – optional transactions that may take place depending on some
conditions. To indicate that a transaction is an optional one, a small decision symbol
(diamond shape) is attached to its initiation (connection) point as illustrated in Figure
5a. In order to transform this optional transaction construct into standard Petri net
semantics, a traditional XOR-split that could be modeled by one place leading to two
36
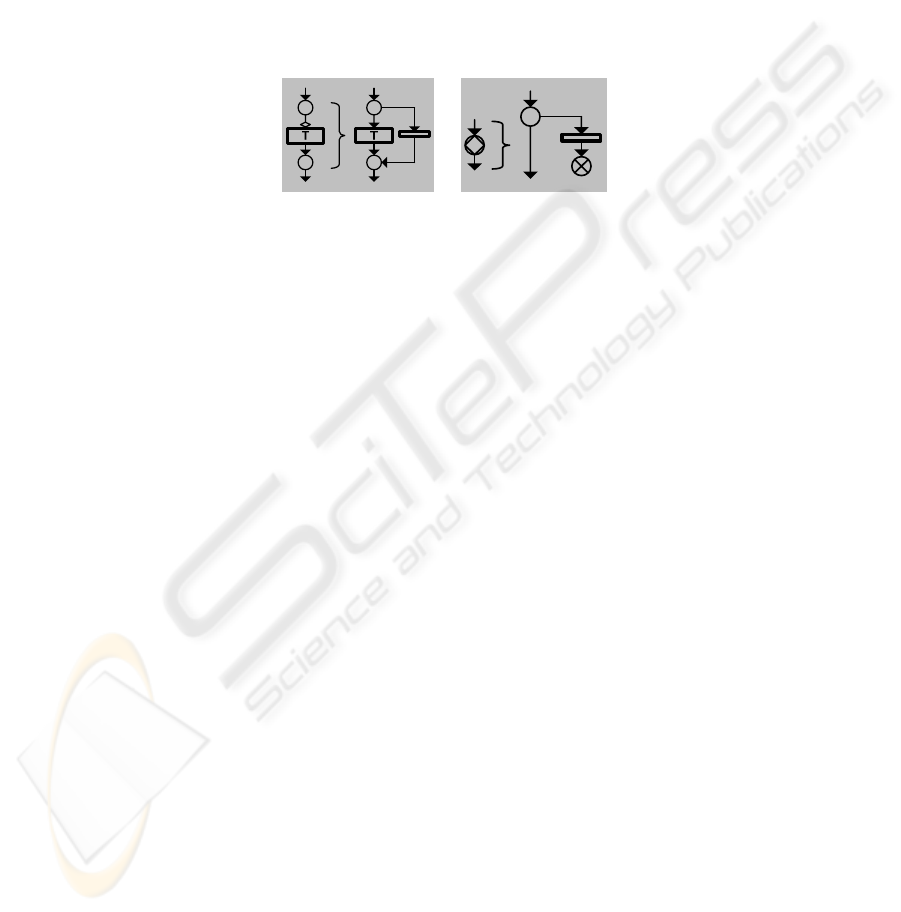
transitions is used. It requires the addition of a skip (or dummy) transition as
demonstrated in the figure (notice the tiny rectangle with no labels). A dummy
transition means that it has zero duration and utilizes no resources.
Finally, there are situations that a process may halt and result in a termination. For
example, if there is no room available, then the payment transaction is not initiated at
all. This situation is modeled through a place identified as “decision state” graphically
represented via a circle with the decision symbol (diamond shape) within it, see
Figure 5b. As it is seen, for the transformation of a decision state into standard Petri
net semantics, a traditional XOR-split that could be modeled by one place leading to
proceed or stop is used. Depending on the value of the state, the process either
proceeds or terminates as indicated by a place filled with a cross.
a)
b)
Fig. 5. Standard Petri net representation of: a) an optional transaction; b) a decision state.
Through these few simplified constructs and mini-models, we aimed to introduce
how the proposed method can capture typical situations in a business process, provide
sound concept based on communication, and ultimately contribute towards more
accurate Business Process Modeling and consequently more adequate EIS Design.
Now that the basic ideas and constructs of the proposed method are introduced, in the
following section we illustrate how this method can be applied to a simple real world
business system.
4 Case Study
What follows is a partial version of a case study demonstrating the proposed method’s
capability of capturing the system interaction with external and internal entities
(actors). This study was conducted when a large regional Pharmacy was planning to
acquire and implement a new system and extend its business with e-commerce. This
case study was conducted to help understand the Pharmacy’s operations and
requirements for a new system.
A patient requests prescription refilling by submitting a prescription to the
pharmacy technician (pharmacist). For new patient, the technician creates a profile
in the pharmacy system’s QuickScrip database. After selecting a medicine, the system
checks the current medicine for interactions with prescriptions the patient is already
taking. The user is alerted if any interactions are found and the process stops. If there
are no interactions, the user is asked by the software to transmit a claim to the
patient’s insurance company, if one is provided. The computer generates a label and
sends the information to the ‘robot’ for automatic filling. The medicine is dispensed
into a pre-selected bottle and counted using a laser and gear system which places the
medicine into the bottle. A conveyer belt sends the prescription out for a final check
by a pharmacist. Once verified, the prescription is bagged and then sent out to the
37

cashier for pick-up by the patient. The entire process normally takes no more than 10-
15 minutes. At the pick-up counter, the patient signs for their prescription and pays
the cashier. Every time a new prescription is issued, the inventory is also updated.
The inventory control sub-process entails a number of activities (transactions) that
are out of the scope in this part.
4.1 The Pharmacy Transactions
The process of “Prescription Filling” starts when a patient presents a prescription to
be filled. Thus, the first transaction (T1) is “filling prescription”. Actually, this is a
super transaction that nests other transactions. This transaction is initiated by a
“patient” and executed by the “technician”. The result of this transaction is a filled
prescription. In this manner we identify all other transactions (see Table 2):
Table. 2. Transactions of the pharmacy case.
T1: Filling prescription
Initiator
patient
Executor
technician (pharmacy)
Result
A prescription is filled
T2: Creating profile
Initiator
technician
Executor
patient
Result
A profile is created
T3: Checking medicine interaction
Initiator
technician (software agent)
Executor
QuickScrip
Result
An interaction fact is established
T4: Processing claim
Initiator
technician
Executor
insurance company
Result
A claim is processed
T5: Dispensing medicine
Initiator
technician
Executor
robot
Result
medicine is dispensed
T6: Paying for the medicine
Initiator
technician
Executor
patient
Result
medicine is paid
Now, based on the transactions identified, we build a detailed business process
model of the pharmacy system as shown in Figure 6. The model is constructed in MS
Visio using a customized stencil. By disclosing Transaction T1 (splitting its three
phases), all other nested transactions are revealed. This figure shows that once
medicine is issued (T1/R), the inventory control process is activated. As the inventory
control process is out of the scope, which itself is a network of transactions, we just
illustrate it as a composite transaction (T#). Within the scope of our model, only
Transaction T1 is a composite transaction and, therefore, we decompose it. All other
transactions (T2, T3, T4, T5 and T6) are simple transactions and, therefore, are
represented in a compact form to keep the model condensed.
38
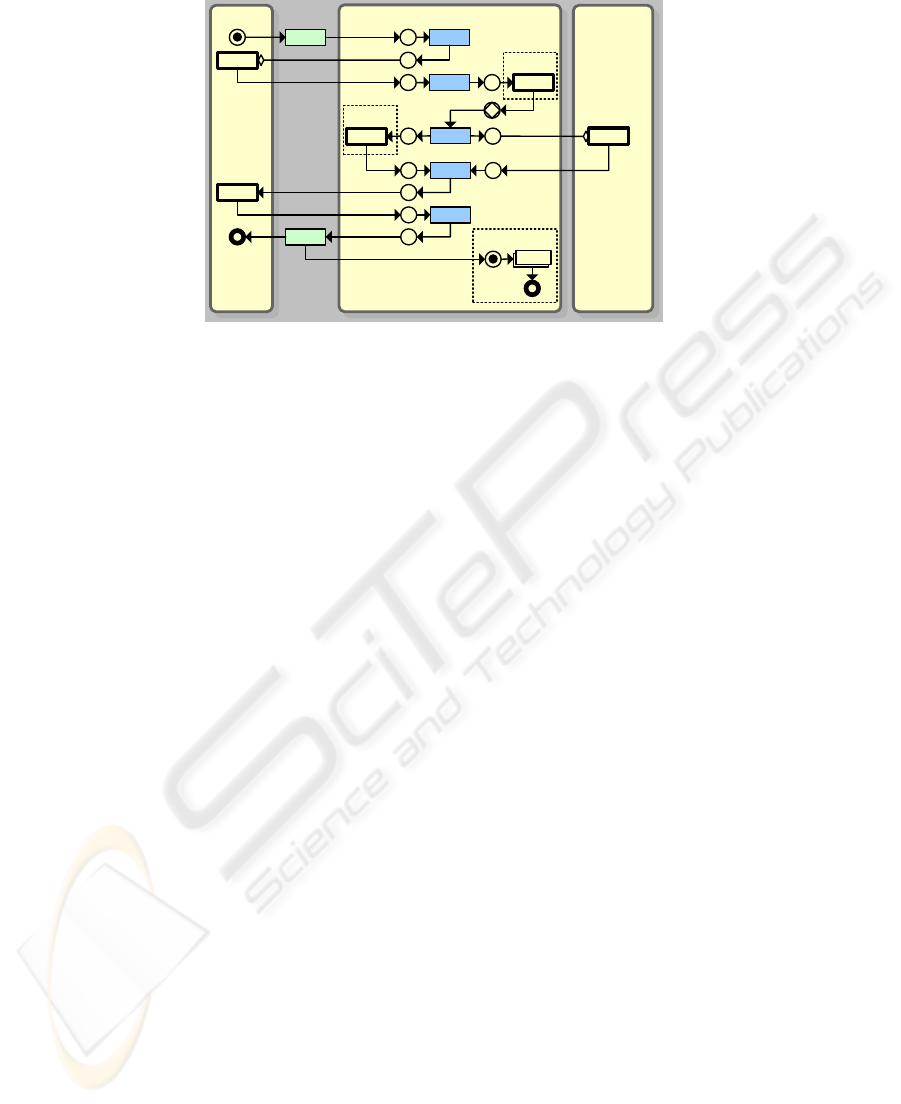
Pharmacy
InsurancePatient
T1/O T1a/E
T2
T3
T5
T4
T1d/E
T6
T1e/E
T1c/E
T1/R
T#
A3
A2
A1
T1b/E
Fig. 6. The Pharmacy detailed model (constructed with MS Visio).
In the above figure, the Pharmacy is considered as a composite actor delegating
the role of a few other actors such as “pharmacist”, “technician”, “robot” and
“software agent” for checking medicine interactions. In order to better understand the
above figure, it should be read from left to right and from the top down, just as the
arrows indicate: The patient requests prescription filling (T1/O) and with this request
the execution process starts (T1a/E). If it is a new patient, the technician asks them to
fill in a form to create a new profile (T2). This is an optional transaction indicated
with a small diamond-shape at the connection point. Then, within the pharmacy
system (QuickScrip), a request is made to check the current medicine for any
interaction (T3) (if an interaction is detected, the process terminates here, notice the
output circle of T3 containing diamond shape). If the patient is covered by an
insurance plan, through an online system, a claim is transmitted to the patient’s
insurance company to define the price of the medicine (T4). Then the robot is
instructed to fill in the prescription (T5). At this point the patient is requested to make
their portion of the payment (T6), and only then the medicine is issued to the patient
and the process is completed (T1/R). Notice, the completion of this process triggers a
transaction in the inventory control process (T#) making sure the issued medicine is
subtracted from the inventory and checks if this medicine should be ordered for
restocking.
5 Evaluation
Hevner et al. (2004) suggest that methods deploying artifacts should be evaluated
using observational (e.g., case study) and experimental (e.g., simulation) methods.
Observational (case study) approach reveals the applicability potential of a method
and its artifacts in a given environment and category that are targeted by the method.
For example, case studies on different size organizations, different levels of
complexity, different levels of abstraction, but all within the same category, e.g.,
service oriented organizations (insurance companies, healthcare/hospitals, hotels).
39

Experimental (simulation) approach reveals if models can be checked, analyzed and
verified. This not only allows models to be checked for consistency, but also
eliminates syntactic errors, illustrates dynamic behavior of models, and lends to
formal analysis.
In light of these recommendations, the proposed method has been tested on both
observational and experimental bases. A dozen case studies have been conducted
using the proposed method and discussed among peer experts in peer-refereed
publications. Some of them purposefully were conducted with the involvement of
non-experts to not only evaluate the method, but also its complexity and mastering by
only lightly trained analysts and system designers. Since the resulting models are
based on formal semantics of Petri net, each of the models has been straightforwardly
simulated, using Petri net tools, to check the models accuracy. All the models were
communicated to and discussed with the users and researchers, including within the
MSVVEIS and ICEIS community. Actually, an earlier version of this paper is
published by both ICEIS and ECIS. The feedback obtained from modelers, designers,
users, and researchers greatly helped to polish and improve the method and eliminate
flawed constructs. Although, it is not claimed that this method is now the best, and
therefore we urge researchers to use and analyze it. The feedback received, however,
confirms that this method has a promising potential within the community. We would
appreciate to see more researchers use the method and give it a critical analysis.
6 Comparison
There are a plethora of methods developed or adapted for business process modeling
that one could discuss for comparison with our method, but neither the scope of this
paper, nor the available space allows us to do so. Therefore, we confine our brief
discussion to only a few widely used methods.
As for the comparison of the proposed method and its performance against widely
accepted conventional methods such as UML, EPC and other Flowchart methods, the
main distinction that should be made is the social emphasis of the proposed method,
where involved actors and their interactions are captured as well as the actions they
perform. It is a fully business process oriented modeling method incorporating the
social character of systems. Furthermore, most of the conventional models are
checked and analyzed via translation to other formal diagrams using mapping
procedures. For instance, UML activity diagrams are often translated to Petri nets for
checking (e.g., see Eichner et al. 2005; Eshuis 2006), and several tools are developed
to translate UML diagrams to Petri net for further simulation (e.g., P-UMLaut tool
converts UML 2 Activity and Sequence diagrams into high-level Petri nets for further
simulation and 3-D animation). Another widely accepted method, investigated in
(Dehnert & Aalst 2004), is Event-driven Process Chain (EPC). The authors propose a
5-step guideline to translate EPC models to Petri net models in order to investigate
whether the process is correctly described in EPC. The analysis showed that
ambiguities of EPC models will result in faulty Petri net executions. In this regard, the
superior advantage of our method is its direct adaptation of Petri net formal semantics
for the developed notations and constructs. Thus, analysts do not need further
translations that could potentially compromise the accuracy and adequacy of
40

modeling, or cause further sophistication through the development of mapping
procedures.
As for the modeling notations that compete with Petri net, e.g. BPMN, EPCs,
Role-Activity-Diagrams, IDEF, UML, RIVA etc., the reasons for adapting Petri net
are its formal semantics, logics and formalism, and also its widespread use among
researchers, practitioners and a variety of academic disciplines. In addition, Petri net
is supported by a large number of tools for its analysis. Aalst (1996) identifies three
main reasons why Petri net possesses advantageous features: formal semantics despite
the comprehensive graphical representation; state-based representation instead of
event-based; abundance of analysis techniques. Process modeling techniques ranging
from informal techniques (e.g., dataflow diagrams) to formal ones (e.g., process
algebra) are event-based, while Petri net approach allows state-based modeling. As
mentioned, many of the models developed using conventional methods and
techniques are eventually translated into Petri nets for model checking or validation
and verification.
7 Conclusion
This paper presented an innovative method for business process modeling based on
the concept of communication as a tool for elicitation and identification of action
patterns.
The graphical language of Petri net makes it easier to communicate the models
among analysts and users, while at the same time they are based on formal semantics.
Thus, the models are fully graphical for illustration, and formal to enable complete
analysis and powerful animation as well as simulation. In turn, it allows checking of
models for correctness in describing business processes. However, in keeping models
manageable and yet easily readable, one obvious trade-off takes place in the proposed
method. This trade-off concerns the use of labels for the activities (e.g., T1, T2, T1/O,
T1/E, for denoting transactions or transaction phases). Compared to typical flowchart
models, where each rectangle contains a brief description of the underlying activity,
our method may seem more technical and less readable. The flowchart models are
easy to follow, but they are challenged when slightly complex processes are modeled,
in which case the chart is broken in pieces. In this regard, though the proposed
method seems more technical, it can construct fairly complex models on a single
sheet of paper, especially with the deployment of compact and composite notations.
There are a few potential directions this method can open up for future research:
- First of all, keep using the method in more complex real life systems to explore
turns and twists of business processes and examine the proposed method’s
capability;
- Develop modeling guidelines for practitioners to use the method in a systematic
way;
- Conduct more in-depth critical comparative analysis of the proposed method and
conventional methods such as UML (use case, activity diagram), EPC, RAD;
41

References
1. Aalst, W. van der, & Hee, K. van (2002). Workflow Management: Models, Methods, and
Systems, MIT Press, ISBN: 0-262-01189-1.
2. Aalst, W. van der, Desel, J., & Oberweis, A. (ed.) (1998). Business Process Management:
Models, Techniques and Empirical Studies. Springer-Verlag Berlin Heidelberg New York
3. Aalst, W.M.P. van der (1996). Three Good Reasons for Using a Petri-net-based Workflow
Management System. Proceedings of the International Working Conference on Information
and Process Integration in Enterprises
4. Bider I. (2005). Choosing Approach to Business Process Modeling - Practical Perspective.
Journal of Conceptual Modeling, issue 34, Publisher InConcept
5. Carr, N. G. (2003). IT Doesn't Matter. Harvard Business Review, May 2003, Vol. 81 Issue
5.
6. Dehnert, J., & Aalst, W.M.P. van der (2004). Bridging the Gap Between Business Models
and Workflow Specifications. International Journal of Cooperative Information Systems,
13(3):289-332.
7. Dietz, J.L.G. (2003). The Atoms, Molecules and Fibers of Organizations. Data and
Knowledge Engineering. Vol. 47, Issue 3, pp. 301-325.
8. Dietz, J.L.G. (2006). Enterprise Ontology –Theory and Methodology. Springer
9. Eichner, C., Fleischhack, H., Meyer, R., Schrimpf, U., Stehno, C. (2005). Compositional
Semantics for UML 2.0 Sequence Diagrams Using Petri Nets. SDL Forum 2005: 133-148.
10. Eshuis, R. (January 2006). Symbolic Model Checking of UML Activity Diagram. ACM
Transactions on Software Engineering and Methodology, Vol. 15, No. 1
11. Hevner, A.R., March, S.T., Park, J., & Ram, A. (March, 2004). Design Science in
Information Systems Research. MIS Quarterly, vol. 28 No. 1, pp. 75-105.
12. Moldt, D., & Valk, R. (1998). Object Oriented Petri Nets on Business Process Modeling. In
Aalst, W. van der, Desel, J., & Oberweis, A. (ed.) Business Process Management: Models,
Techniques and Empirical Studies. Springer-Verlag Berlin Heidelberg New York
13. Ould, M. A. (1995). Business processes: Modeling and analysis for re-engineering and
improvement. John Wiley, Chichester, UK.
14. Robinson, A. G., & Dilts, D. M. (1999). OR & ERP: A Match for the New Millenium?
OR/MS Today 26 (3), 30-35.
15. Winograd, T. (1997). The design of interaction. In P. Denning and B. Metcalfe, Eds.,
Beyond Calculation, The Next 50 Years of Computing. Springer-Verlag.
42
