
String Patterns: From Single Clustering to Ensemble
Methods and Validation
Andr
´
e Lourenc¸o
1
and Ana Fred
2
1
Instituto de Telecomunicacoes, Instituto Superior de Engenharia de Lisboa, Portugal
2
Instituto de Telecomunicacoes, Instituto Superior Tecnico, Lisboa, Portugal
Abstract. We address the problem of clustering of string patterns, in an Ensem-
ble Methods perspective. In this approach different partitionings of the data are
combined attempting to find a better and more robust partition. In this study we
cover the different phases of this approach: from the generation of the partitions,
the clustering ensemble, to the combination and validation of the combined re-
sult. For the generation we address, both different clustering algorithms (using
both the hierarchical agglomerative concept and partitional approaches) and dif-
ferent similarity measures (string matching, structural resemblance). The focus
of the paper is the concept of validation/selection of the final data partition. For
that, an information-theoretic measure in conjunction with a variance analysis
using bootstrapping is used to quantitatively measure the consistency between
partitions and combined results and choose the best obtained result without the
use of additional information. Experimental results on a real data set (contour
images), show that this approach can be used to unsupervisedly choose the best
partition amongst alternative solutions, as validated by measuring the consistency
with the ground truth information.
1 Introduction
Let D = {s
1
, s
2
, . . . , s
N
} be a set of N objects, and s
i
= {s
i
1
, . . . , s
i
L
i
} be a sequence
of length L
i
symbols, defined over an alphabet Σ. Sequences clustering or string clus-
tering is a particular form of clustering where objects are sequences of symbols, also
known as strings.
Clustering algorithms for strings patterns are typically extensions of conventional
clustering methods (assuming vector representations) to handle string descriptions, most
of them by adopting a convenient measure of similarity between patterns [1, 2]. Clus-
tering of string patterns has a broad range of applicability, such as: document image
analysis (handwriting, maps, technical drawings strings); speech and one-dimensional
signal analysis; DNA/genome sequencing and analysis; shape analysis; pattern-based
speech recognition.
Choosing a particular clustering criteria, or induced similarity between given data
points, is a difficult task, either in vector representations, either in string representa-
tions. Inspired on the work of sensor fusion and classifier combination, the most recent
trend and best performing approach in cluster analysis is the so called ”cluster com-
bination” [3–5]. These methods attempt to find better and more robust partitioning of
Lourenço A. and Fred A. (2007).
String Patterns: From Single Clustering to Ensemble Methods and Validation.
In Proceedings of the 7th International Workshop on Pattern Recognition in Information Systems, pages 39-48
DOI: 10.5220/0002438400390048
Copyright
c
SciTePress

the data by combining the information of a set of N different partitions, the cluster-
ing ensemble - P; formally, P = {P
1
, P
2
, . . . , P
i
, . . . , P
N
}, where each partition,
P
i
=
C
i
1
, C
i
2
, . . . , C
i
k
i
, has k
i
clusters.
We build on a previous paper [6], where the clustering combination was evaluated
in the context of string patterns. For the ensemble generation, different combinations
of algorithms and proximity measures for string patterns are evaluated. The combina-
tion algorithms in this context can be used to combine different paradigms, as a multi-
objective approach, attempting to find better and more robust partitioning of the data
set, for example a distinct set of algorithms (K-Means clustering, Spectral Clustering,
classical hierarchical methods) and/or different proximity measures.
The focus of this paper is the concept of validation/selection of the ”optimal” data
partition. For that, and following [7], an information-theoretic measure, the concept
of normalized mutual information, is used in conjunction with a variance analysis us-
ing bootstrapping, to quantitatively measure the consistency between partitions and the
combined results and unsupervisely choose what is the best obtained result. The ground
truth information, will be used to confirm the results and the performance of the differ-
ent algorithms and ensembles.
Section 2 describes the ensemble methods approach in the context of String patterns;
section 3 introduces the problem and possible solution for the validation of the solution;
section 4 presents results and its discussion; finally section 5 draws conclusions.
2 Ensemble Methods for String Patterns
The approach of clustering combination, also known as Ensemble Methods, involves
three different steps: the generation of the clustering ensemble, the combination of the
clustering ensemble that results in the extraction of the combined data partition, P
∗
,
and the validation of the result. Section 2.1 presents the production of the clustering
ensemble for string patterns, involving different proximity measures and algorithms,
and Section 2.2 presents the clustering combination methods.
2.1 Generation of the Clustering Ensemble
The clustering ensemble can be produced in many different ways, including: different
algorithms; single algorithm with different parameter initializations or distinct parame-
ter values; clustering different views/features of the data; manipulation of the data set,
using techniques such as bootstrap or boosting.
Following previous work [6] the clustering ensemble for string patterns can be gen-
erated based on conventional clustering methods extended for string patterns by intro-
ducing proximity measures between strings [2].
Proximity Measures. The most common similarity measures belongs to the string
matching paradigm and are based on String Editing Operations (SEO): substitution,
maintenance, insertion or deletion of symbols. The Levensthein and the weighed Lev-
ensthein distances quantify the minimum number of operations required to transform
a string s
i
into another string s
j
. Herein, we will adopt 0 cost to maintenance of a
40

symbol and unitary cost for the remaining string editing operations. Moreover, differ-
ent types of normalization are used, namely: the classical normalization by the string
length (NSED); and the normalization by the length of the editing path – normalized
string edit distance (NSEDL).
In a different paradigm, the structural resemblance, use grammars to model the
cluster’s structure, and rules of composition of clusters are assumed to reflect the simi-
larity between patterns. Several approaches are described in the literature: Fu proposed
a distance between strings based on the concept of error correcting parsing (ECP); Fred
explored the notion of compressibility of sequences and algorithmic complexity using
Solomonoff’s code (SOLO); another approach by Fred, the ratio of decrease in grammar
complexity (RDGC), is based on the idea that if two sentences are structurally similar,
then their joint description is more similar than their isolated description due to sharing
rules of symbol of composition. For details on how to compute these measures consult,
for instance, [2] and the references therein.
Clustering Algorithms. Several clustering algorithms are addressed using both the
partitional and hierarchical agglomerative approaches.
On the first approach, one of best well known and mostly used algorithm for clus-
tering is the K-means algorithm. In order to apply it to string descriptions, we have
adapted it, in order to be based on proximity measures described previously for string
pairs. Moreover, the clustering prototypes are selected as the median string. A nearest
neighbor approach, that we will refer as Fu-NN, was also explored, adopting as dis-
tance measure the string edit distance (SED). The nearest-neighbor rule is the basis for
another algorithm, where clusters are modeled by grammars, but where sequences are
compared, not directly with patterns previously included in clusters, but with the best
matching elements in languages generated by the grammars inferred from clustered
data. For grammatical inference we used the Crespi-reghizzi’s method [2], without as-
suming a priori information. We will refer to this method as FU-ECP. In a different per-
spective the Spectral clustering algorithms [8] map the original data set into a different
feature space based on the eigenvectors of an affinity matrix, a clustering method being
applied to the new feature space. In order to extend the applicability of the method to
string patterns, the definition of the affinity matrix is derived from the normalized string
edit distance (NSEDL).
In the hierarchical perspective [9], we will explore the classical Single Link (SL),
Complete Link (CL), Average Link (AL), Ward’s Link(WL), and Centroid Based Link
(Centroid) [9]. To convert the similarity measures defined above, generically referred as
S(s
1
, s
2
), into dissimilarity measures, we use:d(s
1
, s
2
) = max(similarity) − S(s
1
, s
2
)
2.2 Clusterings Combination
Several combination methods have been proposed to obtain the combined solution, P
∗
,
[3–5]. Fred and Jain proposed a method, the Evidence Accumulation Clustering (EAC),
for finding consistent data partitions, where the combination of clustering ensemble is
performed transforming partitions into a co-association matrix, which maps the coher-
ent associations and represents a new similarity measure between patterns. To unsuper-
visely find the number of clusters, the lifetime method [3] can be used. Strehl and Gosh
41

have formulated the clustering ensemble problem as an optimization problem based on
the maximal average mutual information between the optimal combined clustering and
the clustering ensemble. Three heuristics are presented to solve it, exploring graph the-
oretical concepts (CSPA, HGPA, MCLA). Topchy, Jain and Punch, proposed to solve
the combination problem based on a probabilistic model of the consensus partition in
the space of clusterings. In this paper we will be concentrated on the first approach - the
EAC algorithm.
3 Clustering Validation
Different clustering algorithms lead in general to different partitions of the data set. The
problem of evaluation/comparison of clustering results as well as deciding the number
of clusters better fitting the data is fundamental in clustering analysis and it has been
subject of many research efforts [9–12].In the context of clustering combination ap-
proaches the problem of clustering validation is still central. The selection/weighting
of the best partitions or clusters of the clustering ensemble determines the performance
of the clustering combination algorithms. Different approaches can be followed. The
stability analysis, measuring the reproducibility of clustering solutions, either perturb-
ing the data set or the clustering ensemble, offers an interesting solution [11,13,7]. We
will focus in the stability analysis proposed in [7] where the robustness of the EAC
algorithm was accessed by variance analysis, based on bootstrapping of the clustering
ensemble.
3.1 Stability Analysis
The clustering ensemble P is perturbed using bootstrapping, producing B bootstrap
versions of the clustering ensembles: P
B
= {P
b
1
, . . . , P
b
i
, . . . , P
bB
}, where P
b
i
is a
clustering ensemble that when combined will generate the combined data partition de-
noted by P
∗b
i
.
Using the normalized mutual information [7],defined as NMI(P
a
, P
b
) =
2I(P
a
,P
b
)
H(P
a
)+H(P
b
)
, and frequency counts as approximations for probabilities (in this case
the percentage of shared patterns between partition) it is possible to define the aver-
age normalized mutual information between the k-cluster combined partitions and the
bootstrap clustering ensembles,
NMI(P
∗k
b
, P
b
), as:
NMI(P
∗k
b
, P
b
) =
1
B
B
X
i=1
NMI(P
∗k
b
i
, P
b
i
) (1)
and the corresponding standard deviation, std{N M I(P
∗k
b
, P
b
)} as:
std{NMI(P
∗k
b
, P
b
)} =
v
u
u
t
1
B − 1
B
X
i=1
(NMI(P
∗k
b
i
, P
b
i
) −
NMI(P
∗k
b
, P
b
))
2
(2)
These two measures enable the verification of the consistency of the different com-
bined partition P
∗k
b
i
with each perturbed bootstrap version of the clustering ensemble
P
b
i
.
42

The consistency of the result will also be evaluated in a different perspective, as-
sessing if the combined results, P
∗k
b
i
, are consistent with each other. For that we define
the normalized mutual information between P
∗k
b
i
and P
∗k
b
j
,
NMI(P
∗k
b
i
, P
∗k
b
j
), as:
NMI(P
∗k
b
, P
∗k
b
) =
1
N
2
B−1
X
i=1
B
X
j=i+1
NMI(P
∗k
b
i
, P
∗k
b
j
) (3)
For the measures presented in equations 1, 2, 3, similar definitions are used for
defining
C
i
(P
∗k
b
, P
b
), var{C
i
(P ∗
k
b
, P
b
)} and
C
i
(P
∗k
b
, P
∗k
b
), where C
i
represents the
consistency index [14] that finds the best match between partitions, counting the per-
centage of agreement between the labelings.
4 Experimental Results and Discussion
To test the proposed approach we will follow previous work [6] and apply the stability
analysis to the combination results resulting from the problem of unsupervised catego-
rization of contour images of hardware tools, using string descriptions.
4.1 Data Set
The real data set is composed by 634 contour images of 15 types of hardware tools
[15]: t1 to t15. As shown in Figure 1, some of the hardware tools have moving parts;
different poses (open, closed and half open), leading to different shapes. When counting
each pose as a distinct sub-class in the object type, we obtain a total of 24 different
”objects”. We will test the algorithms with this number of clusters.
String descriptions of object’s shapes were obtained for each image, segmenting the
object from the background, sampling the object boundary at 50 equally spaced points,
and finally using 8-directional differential chain code [16] to describe the boundary.
Fig.1. Data set. Typical samples of the database of images of hardware tools; string descriptions
are used to represent the contours of images.
4.2 Single Clustering Results
Each of the clustering algorithms presented as basis for constructing the clustering en-
semble was applied to the data set. Table 1 summarizes the obtained results, in terms
43

Table 1. C
i
(P, P
o
) individual clustering results.
Algorithm Similarity Measure/ Parameters C
i
nc
NN-StoS-Fu
SEONL th=0.3 25.4 14
SEO th=8 69.7 72
NN-ECP-Fu
SEO th=4 25.4 13
SEO th=5 27.4 7
SEON th=0.09 27.4 7
Kmeans
SEONL 48.3 15
SEO 47.3 15
Hier-SL
SEONL 21.5 24
SOLOM 15.9 24
RDGC 24.3 24
ECP 16.6 24
Hier-CL
SEONL 39.3 24
SOLOM 54.9 24
RDGC 42.4 24
ECP 41.8 24
Hier-AL SOLOM 57.3 24
Hier-WL
SEONE 90.7 24
SOLOM 60.6 24
RDGC 51.7 24
ECP 55.2 24
Spectral
NSEDL σ=0.08 76.5 24
NSEDL σ=0.16 67.4 24
NSEDL σ=0.44 82.6 24
of the number of clusters (column ”nc”) in the data partition P and the corresponding
consistency with the ground truth information, P
o
, C
i
(P, P
o
) (column ”C
i
”).
These partitions, have very heterogeneous results, obtaining a minimum of 7 clus-
ters using NN-ECP-Fu (with SEO and th=5), to the correct number of cluster and a
consistency of 82.6% using spectral clustering algorithm, or 90.7% using the hierarchi-
cal Wards (WL) link.
4.3 Ensemble Methods Results and Validation
Using the combination techniques presented in section 2.2, we propose to combine the
clustering ensemble, assuming known the number of clusters, K, (with the value 24),
and using the lifetime criteria.
Following [6], two different experiments were conducted. The first, that we will call
Heterogenous Ensemble, uses partitions produced by the different paradigms described
above (with all the algorithms and proximity measures) in a total of 23 partitions. The
second uses only the partitions obtained using the spectral clustering algorithm. For
that, the followed approach consisted in fixing the number of clusters in each partition
(K = 24) and varying the parameter σ within the interval [0.08 : 0.02 : 0.5], where
0.02 corresponds to an increment, resulting on a total of 22 partitions.
Table 2 shows the obtained results of the combination of the two ensembles (Hetero-
geneous and Spectral Ensembles). The rows of the table represent the algorithms (SL,
44
CL, AL, WL or Centroid) used in the extraction of the combined data partition from the
co-association matrix. The columns represent the consistency index C
i
(P
∗
, P
o
) and
C
i
(P
∗k
b
, P
o
), between the combined data partition and the ground truth, and the con-
sistency index between the bootstrap versions of the clustering ensemble and the ground
truth information (in terms of mean and standard deviation). Moreover the columns are
divided in k-fixed and lifetime version of the combination method, representing the ob-
tained result with fixed number of clusters (equal to the true number of clusters, K=24),
and the with the lifetime criteria, that chooses the number of clusters that best suits the
data. Notice that the consistency index, when the number of clusters is equal to the true
number of clusters, is equal to the percentage of agreement (1- P
e
).
Table 2. Results of the combination of Heterogeneous and Spectral clustering Ensembles in terms
of the consistency index between the combined partition and the ground truth - C
i
(P
∗
, P
o
) and
between the bootstrap versions of the clustering ensemble and the ground truth - C
i
(P
∗k
b
, P
o
).
Comb. Alg.
Heterogeneous Spectral
k-fixed life-time k-fixed life-time
Ci
Bootstrap
Ci
Bootstrap
Ci
Bootstrap
Ci
Bootstrap
Ci std{Ci} Ci std{Ci} Ci std{Ci} Ci std{Ci}
EAC-SL 61.7 53.9 11.7 14.5 16.6 3.3 83.8 76.9 2.9 67.0 66.7 5.7
EAC-CL 73.3 63.7 9.8 21.1 19.2 14.5 69.9 71.2 3.0 79.5 70.6 2.6
EAC-AL 73.3 69.7 9.7 21.1 21.8 4.3 76.0 74.5 4.1 70.2 71.2 3.3
EAC-WL 93.7 84.0 7.0 14.5 16.1 6.7 80.4 81.1 1.4 84.4 64.4 28.0
EAC-Cent 77.0 68.9 13.5 21.1 28.1 16.5 79.7 75.9 3.9 76.3 73.8 6.0
The combination results have considerably higher results than the average perfor-
mance obtained with the individual methods in the clustering ensemble (43.6% av-
erage consistency index). Moreover, it is worth noticing that the combination results
outperform the best individual clustering results: the Heterogeneous clustering ensem-
ble gives the best global performance (consistency index with the EAC-WL method
-C
i
(P
∗
, P
o
)- of 93.7%). In the Spectral clustering ensemble the results are, as in the
previous ensemble, better than the single clustering results. Due to reduced space, in
rest of the paper only the heterogenous ensemble will be considered, since it obtains
better results.
In terms of the different paradigms for the selection of the number of clusters in
the combination method (using fixed-k or lifetime), in the heterogeneous ensemble the
fixed-k outperformed the lifetime criteria, since the number of obtained clusters using
this criteria was only 3 (or 2 in some cases).
To understand the bootstrap versions of each ensemble, in table 2, columns
C
i
and
std{C
i
}, represent the average and the standard deviation of the consistency between
the combination of the bootstrap versions of the clustering ensemble, denoted by P
∗k
b
,
and the ground truth P
o
. As shown, the average consistency is different from the ob-
tained with all the ensemble (P), since these versions of the ensemble were obtained
perturbing P via bootstrapping (i.e sampling with replacement). Moreover the standard
deviation in some cases is very large, which manifest the variability of the bootstrapped
ensembles.
45

The stability analysis will try to choose the best combined partition, or in another
perspective, try to find ”How to choose the extraction method?” and ”If we should use
the k-fixed or lifetime criteria?”
Table 3 present consistency results between the bootstrap versions of the cluster-
ing ensemble P
b
and the obtained clustering combination results P
∗k
b
, in terms of
NMI(P
∗k
b
, P
b
) (equation 1), std{NMI(P ∗
k
b
, P
b
)} (equation 2), and C
i
(P
∗k
b
, P
b
),
std{C
i
(P ∗
k
b
, P
b
)}, based on 100 bootstrap experiment (using the same number of par-
titions in each ensemble), for the heterogeneous and spectral ensembles respectively.
Moreover it presents the consistency between the obtained combination results in the
different bootstrap experiences, in terms of
NMI(P
∗k
b
, P
∗k
b
), Ci(P
∗k
b
, P
∗k
b
).
Table 3. Heterogeneous clustering ensemble - Column: P
∗k
b
, P
b
represent the consistency be-
tween the bootstrap versions of the clustering ensemble P
b
and the obtained clustering com-
bination results P
∗k
b
, in terms of NMI(P
∗k
b
, P
b
), std{NMI(P ∗
k
b
, P
b
)}, and C
i
(P
∗k
b
, P
b
),
std{C
i
(P ∗
k
b
, P
b
)}; Column: P
∗k
b
, P
∗k
b
represent the consistency between the obtained combina-
tion results in the different bootstrap experiences, in terms of
NMI(P
∗k
b
, P
∗k
b
), Ci(P
∗k
b
, P
∗k
b
).
Comb. Alg.
fixed-k life-time
P
∗k
b
, P
b
P
∗k
b
, P
∗k
b
P
∗k
b
, P
b
P
∗k
b
, P
∗k
b
NMI C
i
NMI C
i
NMI C
i
NMI C
i
µ std µ std µ std µ std
EAC-SL 0.581 0.0217 0.478 0.0166 0.832 0.691 0.265 0.0872 0.441 0.0058 0.817 0.949
EAC-CL 0.586 0.0231 0.448 0.0185 0.815 0.652 0.240 0.2185 0.428 0.0059 0.417 0.713
EAC-AL 0.605 0.0125 0.463 0.0106 0.896 0.779 0.392 0.0492 0.474 0.0061 0.890 0.950
EAC-WL 0.603 0.0088 0.434 0.0126 0.915 0.809 0.309 0.0624 0.436 0.0060 0.572 0.848
EAC-Cent 0.599 0.0235 0.473 0.0149 0.859 0.731 0.408 0.1203 0.474 0.0059 0.639 0.761
Comparing the best obtained results (considering the ground truth information -
table 2), for the fixed-k version was obtained with the EAC-WL (considering all the
ensemble and also the bootstrap versions); and for the life-time approach the best results
were obtained using the EAC-CL, EAC-AL and EAC-Cent (considering the bootstrap
version the best was the EAC-Cent but with a high standard deviation, followed by the
EAC-AL with a much lower standard deviation).
Following the average consistency between the combined results and the bootstrap
ensembles -
NMI(P
∗k
b
, P
b
) - the best partition is not always correctly chosen, the same
happening with the
C
i
(P
∗k
b
, P
b
). The standard deviation measures of this consistency
std{NMI(P ∗
k
b
, P
b
)} and std{C
i
(P ∗
k
b
, P
b
)}, are the more suitable for the selection
of the best partition, choosing in the case of the NMI the best partitions (by other
words best method). Moreover it leads to the choice of the k-fixed version (instead of
the lifetime version) of the algorithm.
Following the other perspective, the consistency between the combination results (in
the different bootstrap versions of the ensemble) - P
∗k
b
- in terms of
NMI(P
∗k
b
, P
∗k
b
),
Ci(P
∗k
b
, P
∗k
b
), the best partitions are selected. This measure can be considered a mea-
sure of reproducibility of clustering solutions, since with different clustering ensembles,
obtained perturbing the original clustering ensemble, the different combined solutions
46
0.46 0.48 0.5 0.52 0.54 0.56 0.58 0.6 0.62
0.2
0.3
0.4
0.5
0.6
0.7
0.8
0.9
1
NMI(P
*k
b
,P
ensemble
b
)
C
i
(P
*k
b
,P
o
)
single
complete
average
ward
centroid
(a) Corr(N M I(P
∗k
b
, P
b
),C
i
(P
∗k
b
, P
o
))
0.008 0.01 0.012 0.014 0.016 0.018 0.02 0.022 0.024
0.4
0.5
0.6
0.7
0.8
0.9
1
std(NMI(P
*k
b
,P
ensemble
b
))
C
i
(P
*k
b
,P
o
)
single
complete
average
ward
centroid
(b) std(N M I)
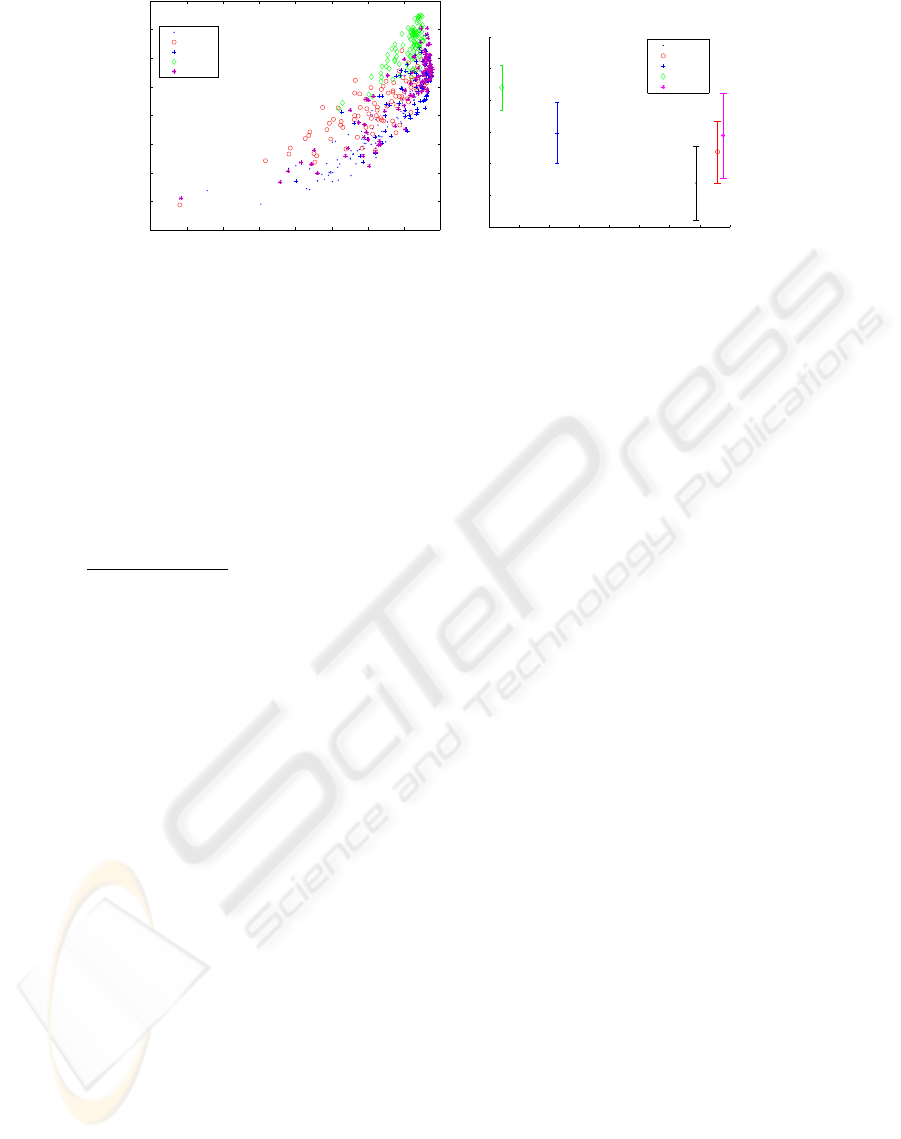
Fig.2. In both figure y-axis represent the consistency of the combined solutions with the ground
truth - C
i
(P
∗k
b
, P
o
). In the left figure the x-axis represents the N M I between the combined
solutions and the ensembles NMI(P
∗k
b
, P
b
); in the right figure the x-axis represent the standard
deviation of this measure std(NM I(P
∗k
b
, P
b
)).
are compared. To understand the variability of the obtained solutions, Figure 2 presents
the correlation between C
i
(P
∗k
b
i
, P
o
) (y-axis) and NMI(P
∗k
b
i
, P
b
) (x-axis).
It can be seen from the left figure, that the partitions with the best results (according
with the ground truth information P
o
- y-axis) are the partition with the symbol ♦
(in green), EAC-WL. The right figure, which represents the standard deviation of the
combined results with the clustering ensembles, shows that was the chosen method.
Analyzing analogous correlations for consistency of the combined solutions, like,
NMI(P
∗k
b
, P
∗k
b
) lead to the same conclusions.
5 Conclusion
In this paper we focus the concept of validation/selection of the ”optimal” data partition
in the Ensemble Methods perspective. The problem of clustering of string patterns was
used as an example of application of this analysis. It consisted in a variance analysis
using bootstrap to quantitatively measure the consistency between the partitions of the
clustering ensemble and combined results and by the other hand the consistency be-
tween the obtained combination results in the different bootstrap experiments. These
preliminary results show that the variance (standard deviation) of the consistency of the
combined results with the clustering ensemble and the consistency between the com-
bination results in the different bootstrap experiences lead to the choice of the most
adequate solution. Further experiments are being conducted to further confirm this re-
sult.
47

References
1. K.S Fu. Handbook of Pattern Recognition and Image Processing, chapter Syntatic pattern
recognition, pages 85–117. Academic Press, 1986.
2. A. Fred. Pattern Recognition and String Matching, chapter Similarity measures and cluster-
ing of string patterns. Kluwer Academic, 2002.
3. A. Fred and A.K. Jain. Combining multiple clustering using evidence accumulation. IEEE
Trans Pattern Analysis and Machine Intelligence, 27(6):835–850, June 2005.
4. A. Strehl and J. Ghosh. Cluster ensembles - a knowledge reuse framework for combining
multiple partitions. Journal of Machine Learning Research 3, 2002.
5. A. Topchy, A.K. Jain, and W. Punch. A mixture model of clustering ensembles. In Proceed-
ings SIAM Conf. on Data Mining, April 2004. in press.
6. Andr
´
e Lourenc¸o and Ana L. N. Fred. Ensemble methods in the clustering of string patterns.
In Seventh IEEE Workshops on Application of Computer Vision (WACV/MOTION’05), vol-
ume 1, pages 143–148, 2005.
7. A. Fred and A.K. Jain. Robust data clustering. In Proc. of IEEE Computer Society Conf. on
Computer Vision and Pattern Recognition, CVPR, 2003.
8. A.Y. Ng, M.I. Jordan, and Y. Weiss. On spectral clustering: Analysis and an algorithm.
In S. Becker T. G. Dietterich and Z. Ghahramani, editors, Advances in Neural Information
Processing Systems 14, Cambridge, MA, 2002.
9. A.K. Jain and R.C. Dubes. Algorithms for Clustering Data. Prentice Hall, 1988.
10. A.K. Jain, M.N. Murty, and P.J Flynn. Data clustering: A review. In ACM Computing
Surveys, volume Vol 31, pages 264–323, 1999.
11. Erel Levine and Eytan Domany. Resampling method for unsupervised estimation of cluster
validity. Aaa, 2000.
12. M. Halkidi, Y. Batistakis, and M. Vazirgiannis. Cluster validity methods: Part i. SIGMOD
Record, June 2002.
13. V. Roth, T. Lange, M. Braun, and J. Buhmann. A resampling approach to cluster validation.
In Computational Statistics-COMPSTAT, 2002.
14. A. Fred. Finding consistent clusters in data partitions. In Josef Kittler and Fabio Roli, editors,
Multiple Classifier Systems, volume 2096, pages 309–318, 2001.
15. A.L. Fred., J.S. Marques, and P.M Jorge. Hiden markov models vs syntactic modeling in ob-
ject recognition. In Proc. of the Int’l Conference on Image Processing (ICIP), Santa Barbara,
October 1997.
16. A.K. Jain. Fundamentals of Digital Image Processing. Prentice-Hall, 1989.
48
