
SEGMENTATION AND CLASSIFICATION OF CUTANEOUS
ULCERS IN DIGITAL IMAGES THROUGH ARTIFICIAL
NEURAL NETWORKS
André de Souza Tarallo, Adilson Gonzaga
Department of Electric Engineering, USP University, Av.Trabalhador São Carlense- 400, São Carlos, Brazil
Marco Andrey Cipriano Frade
Department of Medical Clinics, USP University, Ribeirão Preto, Brazil
Keywords: Leg Ulcer, Computer Vision, Artificial Neural Network.
Abstract: Treatments of leg ulcers are generally expensive and those conducted through the direct manipulation for
analysis of its evolution. The treatment efficiency is observed through the reduction of the size of ulcers in
relation to the amount of tissues found in their beds, which are classified as granulated/slough. These results
are obtained through analyses performed after consultation due to the time these analyses take. This work
proposes a new non-invasive technique for the follow-up of treatments aimed at cutaneous ulcers. In this
methodology, it was proposed that digital photos of cutaneous ulcers would be submitted to an artificial
neural network (ANN), so that all surrounding the wound except for the wound itself could be extracted
(skin/background), thus obtaining the ulcerated area. Computer vision techniques have been applied in order
to classify the different types of tissues found in the ulcer bed, thus obtaining the corresponding granulation
and slough percentages as well as its area. The results obtained have been compared with the results
obtained by Image J software. Finally, this methodology will be a useful tool for health professionals in
relation to the quickness and precision that it will provide results along the consultation.
1 INTRODUCTION
Leg ulcers are a public health problem worldwide
and reach from 3% to 5% of the population older
than 65 years of age and 1% of the adult population.
(Mekkes et al., 2003). The treatment presents some
complications due to its long-term characteristic,
discomfort of curatives and uncertainness in relation
to its success, once its cure depends on several
factors that act as intervenient variables in the
process, causing significant social and economic
impact. The treatment is painful, expensive and slow
due to a number of associated etiopathogenic
factors, and the disease represents one of the main
causes for work absenteeism.
The use of computer tools involving image
processing (Computer Vision) and ANN consists of
an alternative analysis method for the follow-up of
leg ulcer treatments. (Albu and Ungureanu, 2005).
This method does not allow the direct contact with
the wound, once ulcers are analyzed through
digitized images (Goldman and Salcido, 2002).
Therefore, the health professional disposes of tool
designed to support the treatment of ulcers.
The objective of this work is to present a
proposal to aid in the quantitative analysis of each
tissue found in the inner part of wounds, which are
classified as granulated and slough and in the
calculation of the wounded area. With these
measurements, one may have a perspective in
relation to the treatment evolution, since it provides
a dynamic-therapeutic healing follow-up.
This work also proposes the development of
methodology to classify leg ulcer tissues in order to
support specialists along the treatment evolution.
The employment of computer software with the
proposed methodology may lead the patient to feel
safer, since there is no direct contact with the wound
to obtain samples for analyses. In a first phase, the
proposal consists of performing the extraction of
features from the leg ulcer digital image base
through color samples removed from ulcer images
manually and of applying them to the neural
59
de Souza Tarallo A., Gonzaga A. and Andrey Cipriano Frade M. (2008).
SEGMENTATION AND CLASSIFICATION OF CUTANEOUS ULCERS IN DIGITAL IMAGES THROUGH ARTIFICIAL NEURAL NETWORKS.
In Proceedings of the First International Conference on Health Informatics, pages 59-65
Copyright
c
SciTePress
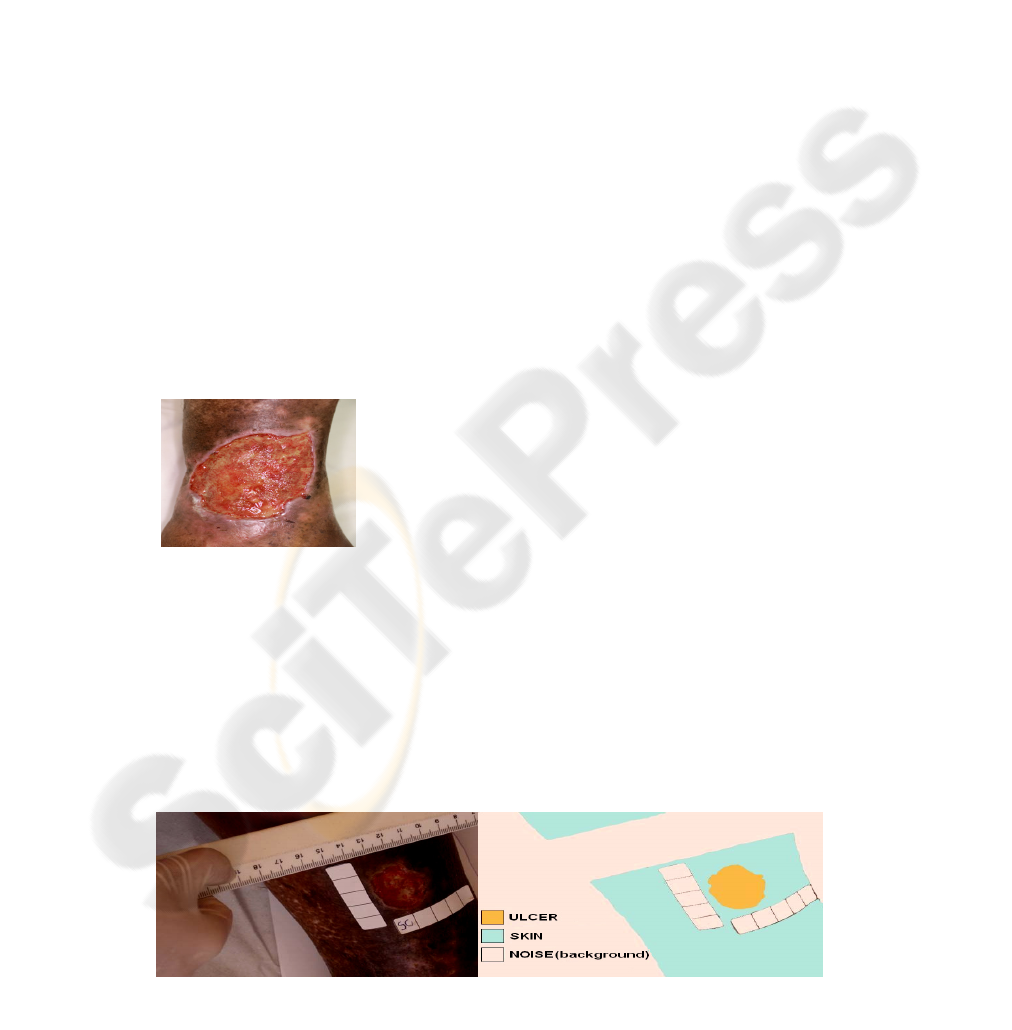
Figure 2: Example of an image with noise, skin and ulcer regions.
network test for images segmentation – Training
Phase. In a second phase image processing
techniques were used to classify tissues found at the
inner region of the wound - Test Phase.
2 LEG ULCERS
Leg ulcers occur due to more than one cause: venous
hypertension (~80%), arterial insufficiency (~10%)
or the combination of both – the called “mixed
ulcers”, among others. (Abbade and Lastória, 2005).
Ulcers occurring at the tip end of the lower limbs are
a result of venous, arterial or neurovascular diseases
such as varix, thrombosis venous, arteriosclerosis,
diabetes and arterial hypertension, among others.
(Dean, 2006).
Each type of ulcer presents own characteristics,
requires different treatments, and must be evaluated
separately. (Borges, 2005 and Dean, 2006).
A deficient blood circulation decreases the
intake of oxygen and nutrients and reduces the
removal of metabolism-derived products such as
free radicals, factors that contribute for the healing
delay. The main problem of leg ulcers is the
recurrence; 30% of healed ulcers recur within the
first year and this rate increases to 78% after two
years when inadequately treated. (Barros, 2000).
Figure 1: Venous Leg Ulcer.
A good analysis of some characteristics,
parameters and interpretation of clinical ulcer
examinations is vital, and among these
characteristics: number and size of the ulcer, edges
and appearance of the lesion bottom, type of ulcer,
skin-ulcer state, arterial test, venous test and
evaluation of the microbiological status (culture,
exams) are worth mentioning. (Kupcinskas, 2006).
Leg ulcer is a very relevant and common
problem in health services worldwide and affects
between 0.1% and 1% of the adult population with
studies pointing to prevalence. (Mekkes et al., 2003).
However, the key for the selection of effective ulcer
treatments is based on the evaluation process of its
etiology.
Venous-origin leg ulcers – Figure 1 – popularly
known as varicose ulcers, are mainly caused by
chronic venous insufficiency, term described as
lower limbs syndrome, which represents the
incapacity of maintaining the balance between the
arterial blood flow that reaches the lower limb and
the venous flow that returns to the right atrium as a
result of the incompetence of the superficial and/or
deep venous system with symptoms such as edema,
pigmentation, pain and disabilities. (Barros, 2000)
(Pitta, Castro and Burihan, 2000).
In normal people, the blood pressure decreases
during the practice of physical exercises, but in
patients with venous incompetence, the pressure
remains high during effort. Venous ulcers are mainly
characterized by the presence of edema, darkened
pigmentation, varicose veins and
lipodermatosclerosis (hardening and fibrosis in the
dermis and subcutaneous tissue) at the lower limbs.
(Phillips and Dover, 1991).
In the study conducted by Skaraborg (cited in
Figueiredo, 2003), 5.6% of people with 65 years of
age or older presented open or healed lower limbs
ulceration and 2.4% of the adult population above 15
years of age have already had ulcers. European data
show that 1.5% of the adults will have ecstasy ulcer
sometime in their lives.
3 MATERIAL AND METHODS
The photographs were taken through a Sony Cyber
shot P-93 camera with 3 mega pixels, 3X optical
zoom and without digital zoom. The images
randomly selected from our the image bank were
standardized and non-standardized in relation to
zoom, illumination, distance between the camera
and the patient’s leg and the focus in the patient’s
leg. We made the image bank because none was
HEALTHINF 2008 - International Conference on Health Informatics
60
found publicly available library. Fifty images of
thirty five patients were selected to test the validity
of the proposed methodology.
The methodology proposed is divided into two
phases: in the first phase, the extraction of the color
characteristic and the ANN training occur (Training
Phase) with ten images. (Haykin, 2001). The second
phase consists of segmenting images with forty
images (ANN Test), elimination of noises,
improvement of the image quality and later tissue
classification in the wound bed – Test Phase.
(Gonzalez and Woods, 2002).
In the first phase, initially two algorithms were
applied to images in order to obtain, skin, ulcer (bed)
and noise (background - all that is not skin and
ulcerated area) color - Figure 2-, which will serve as
inputs for the ANN training to distinguish the color
characteristics of the wound edge from the other
colors not involved in the wound thus, forming
training standards.
The color characteristics corresponding to skin
and non-skin (skin/noise/background) in the RGB
model are obtained through the first algorithm; this
process is manually performed by the computer
operator (this process should be performed by a
health professional, once he will know which are the
best points to be selected in order to find out what
each color represents in the image). The software
used for the development of this methodology was
the Matlab 7.0, (Math Works, 2004) which shows
the 50 images selected (one at a time) and waits for
the computer operator to select the image region
with the mouse with the aid of the algorithm. Each
color characteristic of the selected region is stored in
a text-type file to form the feature vector (skin/non-
skin matrix), according to Figure 3.
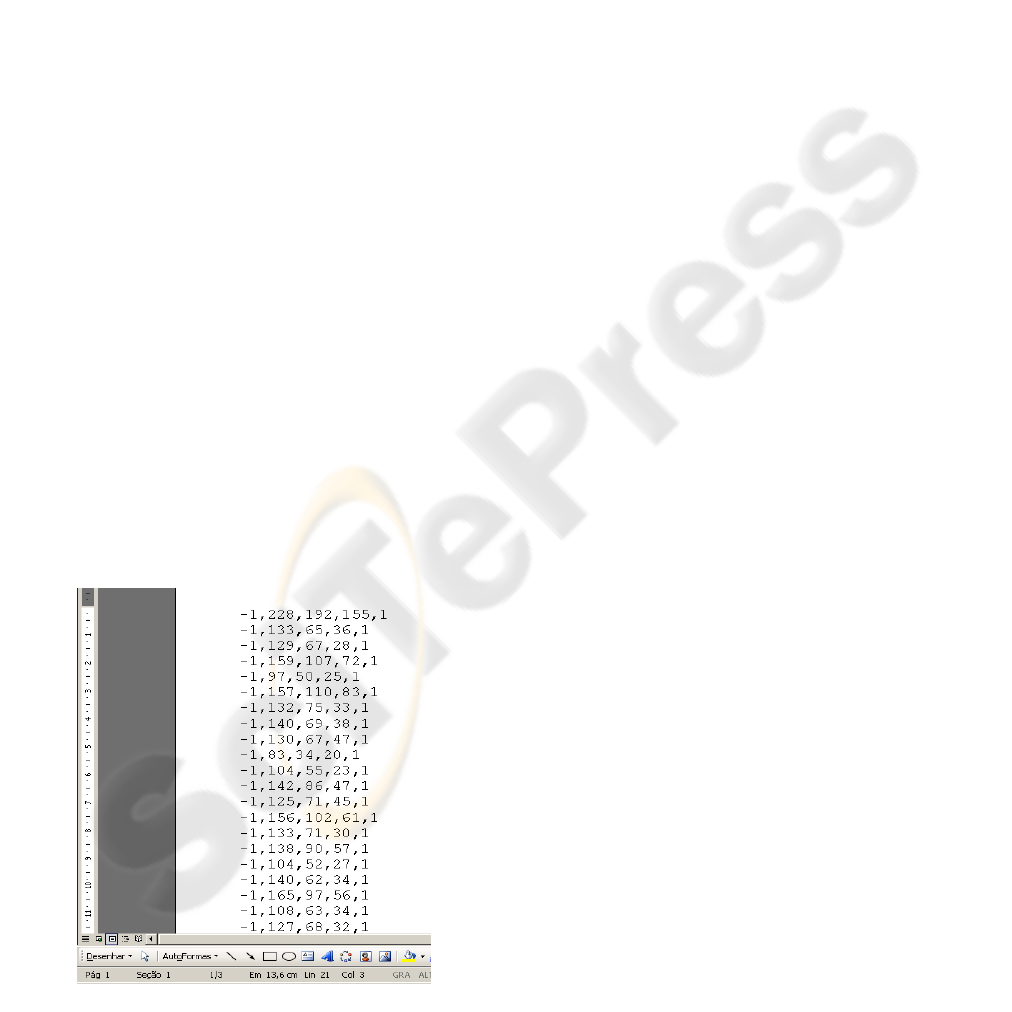
Figure 3: Example of Skin/Non-Skin Matrix.
If one photo contains several interesting
characteristic regions, this image is opened more
than once for the selection of the characteristics.
The values presented in each line of Figure 3
represent the following:
• -1 is a bias used by the neural network for
the activation of the neuron;
• The three next values refer to the RGB
value in relation to the color selected by the
user;
• 1 is the value to be used as exit desired by
the neural network.
The second algorithm is used to obtain the
wound color characteristics in the RGB model,
which are obtained as in the first algorithm. The
feature vector (wound matrix) of each selected color
is saved in another text-type file. The desired exit of
the wound matrix is the 1.
These two matrixes will form the “training
patterns”, which will be used for the training.
The first phase of the proposed methodology in
divided into two stages. In the first stage, the
entrance characteristics for the neural network are
obtained (color characteristics) and in the second
one, these characteristics are applied in the neural
network for its training – Figure 4.
3.1 ANN Training
The extracted characteristics (training patterns) are
applied to an ANN for its training and later
classification and separation of the wound from the
remaining portion of the image (Test Phase). The
MLP Feedforward neural network architecture was
used with the Back-propagation training algorithm
(Haykin, 2001), which was the architecture most
used for classification in several areas, and the
cutaneous ulcer images were generated in the RGB
color model. Before the Test Phase, the ANN must
be trained in order to learn about the color
characteristics obtained through both algorithms
previously mentioned. The training characteristics
are the following:
Both features vectors are concatenated in
order to form the training matrix. Bias, RGB
and the desirable output are arranged in
different variables, and the RGB
characteristics are normalized for the [-1, 1]
interval.
The neural network is initialized using the
minimum/maximum function of the training
matrix.
SEGMENTATION AND CLASSIFICATION OF CUTANEOUS ULCERS IN DIGITAL IMAGES THROUGH
ARTIFICIAL NEURAL NETWORKS
61
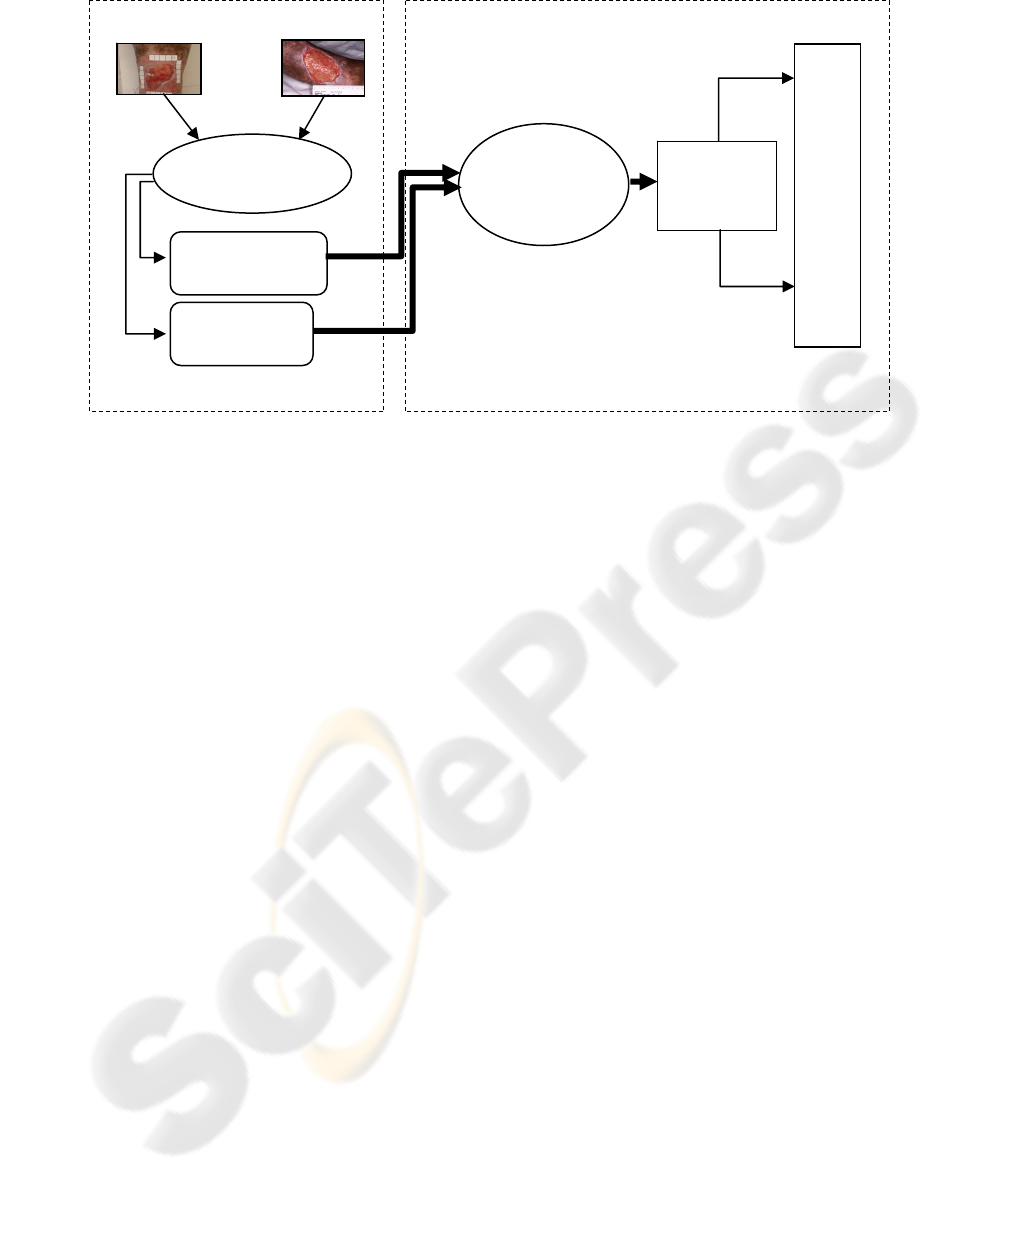
Figure 4: First phase of the proposed methodology.
The neural network training was performed
using the tangent-hyperbolic sigmoid
activation function (so that the values
corresponding to the RGB characteristics do
not exceed the normalized interval). The
moment gradient is used for the three occult
layers of the neural network plus the output
layer.
Values corresponding to other parameters
used in this algorithm and in the Neural
Network will be specified in the next topics.
3.2 ANN Test (Classification of Images)
In the second phase, or Test Phase, the efficiency of
the Neural Network is verified in the segmentation
of the 40 images from results obtained in the training
(first phase). A post-processing is required to
eliminate some remaining noises to better prepare
the image for the tissue classification. Figure 5
presents the second phase of the proposed
methodology. The techniques employed are the
erosion and dilation morphologic operations.
(Gonzalez and Woods, 2002). Finally, the tissues are
classified based on the counting of pixels, where
similar colors are associated to the type of tissue.
Besides the granulation and slough tissue
classification, the percentage of these two types of
tissues and the ulcer area in the image were
calculated.
The algorithm used (ANN Test) presents the
following steps:
1) Segmentation of Images;
2) Post-Processing: Images are processed
through dilation and erosion and image
superposition in order to eliminate noises and
to show the wound region only;
3) Counting of pixels corresponding to the
granulation and slough tissue and calculation
of the percentage corresponding to each type
of tissue in the image;
4) Generation of an image with markings in
which pixels corresponding to granulation and
slough are counted: white pixels are
granulation tissue and the others are the
slough tissue;
5) Calculation of the leg ulcer wounded area
in cm2.
The segmentation is performed by the Neural
Network using parameters from the Training Set and
commands based on Neural Networks toolbox from
the Matlab 7.0 software (Math Works, 2004); and
the resulting image that distinguishes the wound
from the rest of the image is obtained – pre-
processed image.
3.2.1 Post-Processing
The pre-processed image is then submitted to a post-
processing in order to eliminate noises and to show
the wound region only. To do so, erosion and
dilation morphologic operators were used.
In order to use erosion and dilation operators in the
Matlab software, the figure has to be converted into
gray scale, which is the only way that the figure
allows the use of such morphologic operators
(Gonzalez and Woods, 2002).
In order to use these morphologic operators, a
structuring element should be created to serve a
Inputs to
the Neural
Network
N
eural
Network
MLP
Stage 2
T
R
A
I
N
I
N
G
1......5
Selection of
Manual Points
Wound
Matrix
Skin/Non-Skin
Matrix
Stage 1
HEALTHINF 2008 - International Conference on Health Informatics
62
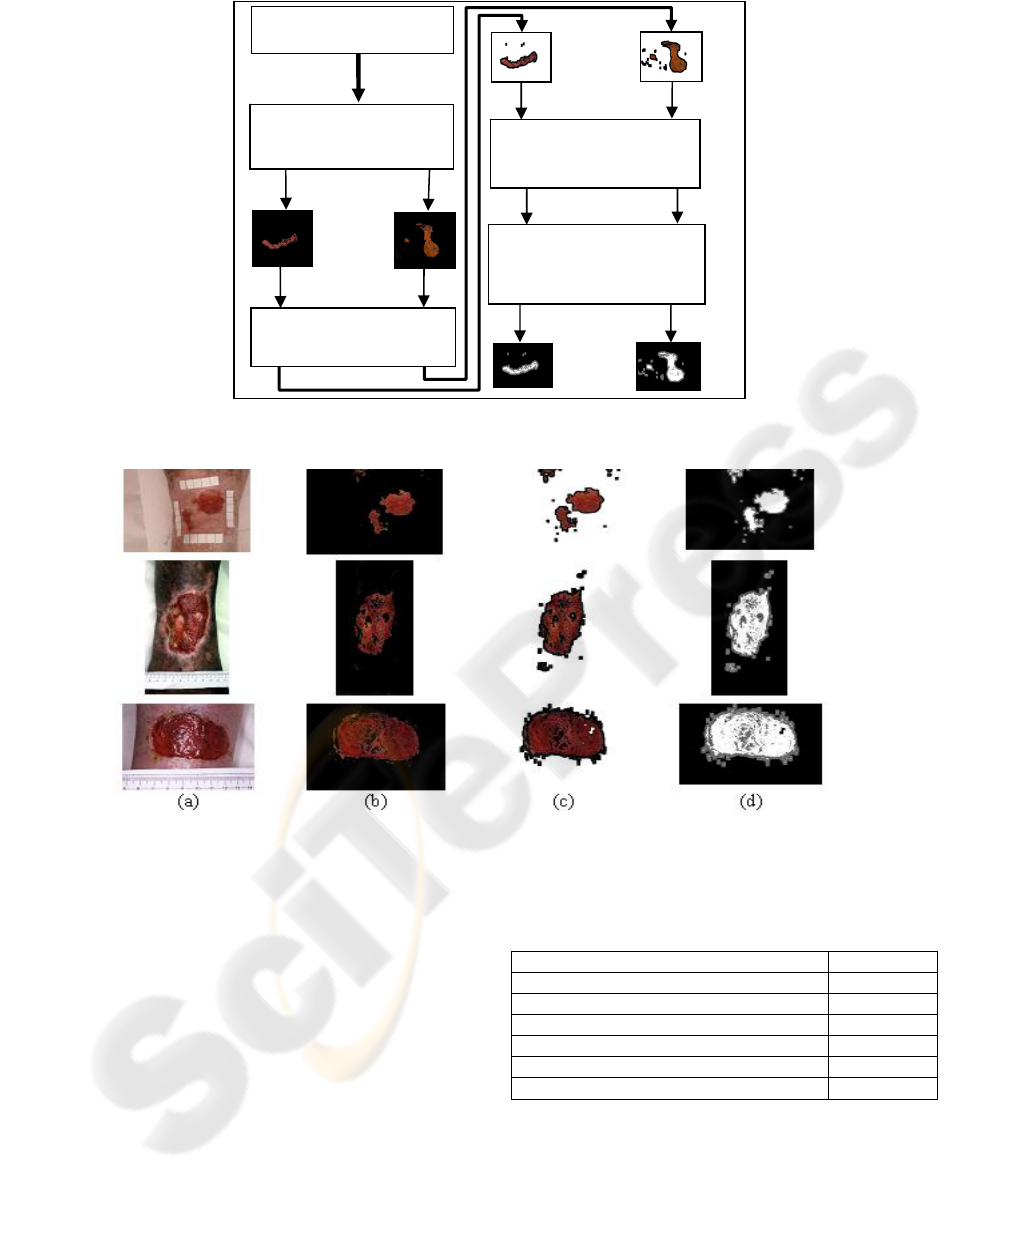
Figure 5: Second phase of the proposed methodology.
Figure 6: Leg Ulcer Segmentation Results. In (a) Original Image – (b) Pre-Processed Image – (c) Post-Processed Image –
(d) Image with counted pixels.
dilation parameter. The structuring element used had
a square format (Math Works, 2004). Following, the
Sobel edge detector was used.
This image was superposed to the original image
with the objective of obtaining an improved and less
noisy new image – post-processed image in which
pixels were counted and calculations were
performed. Finally, an image based on the post-
processed image was generated, with marking of the
sites in which slough and granulation pixels were
counted. Figure 6 presents images according to the
algorithm execution sequence. The parameters used
in the neural network of this methodology may be
observed in Table 1.
Table 1: Values of the Neural Network Parameters.
Parameter Value
Neurons in the 1
st
hidden layer 4
Neurons in the 2
nd
hidden layer 4
Neurons in the 3
rd
hidden layer 1
Moment Term 0.5
Maximum Number of Iterations 1000
Training Error Rate 1x10
-3
4 RESULTS AND ANALYSES
Considering the 40 test images and the segmented
wound area only, the average slough and granulation
Training Results
N
eural Network Tes
t
1...50
Image Processing
Techni
q
ues
1...50
Counting of pixels
of each image
Calculation of the
percentage of each
tissue
1...50
SEGMENTATION AND CLASSIFICATION OF CUTANEOUS ULCERS IN DIGITAL IMAGES THROUGH
ARTIFICIAL NEURAL NETWORKS
63
percentages in relation to the total image may be
verified in Table 2. The results were obtained
through the proposed methodology.
Table 2: Arithmetic average of the tissue percentage–
Proposed Methodology.
Total Image Wound Area
Slough 10.5% 26.1%
Granulation 18.4% 73.9%
The same images tested in the proposed
methodology were applied to the Image J for
comparison purposes, because this software is used
for made analyses of images of leg ulcers at
department of dermatology of FMRP (Ribeirão
Preto Medical School) and it is desirable to have a
tool more practical than the Image J.
The results obtained through Image J may be
observed in Table 3. (Gomes, Santana and Minatel,
2005).
Table 3: Arithmetic average of the tissue percentage –
Image J.
Total Image Wound Area
Slough 18.9% 43.3%
Granulation 30.0% 56.7%
The area of each wound in cm
2
in relation to the
total image was also calculated both through the
proposed methodology and through the Image J; the
arithmetic averages of results may be observed in
Table 4.
Table 4: Arithmetic average of the Wound Areas.
Proposed
Methodology
Image J
Average Area 13.1cm
2
14.1cm
2
The results obtained through the Image J
freeware software and with our methodology
seemed to be satisfactory; in the total tissue area, the
average was 13.1 cm
2
through the proposed
methodology and 14.1 cm
2
through Image J (Figure
7). In relation to the granulation, the average
obtained was 12.4 cm
2
through the proposed
methodology and 12.6 cm
2
through Image J (Figure
8). In relation to slough, the average obtained was
1.8 cm
2
through and 1.9 cm
2
through Image J
(Figure 9).
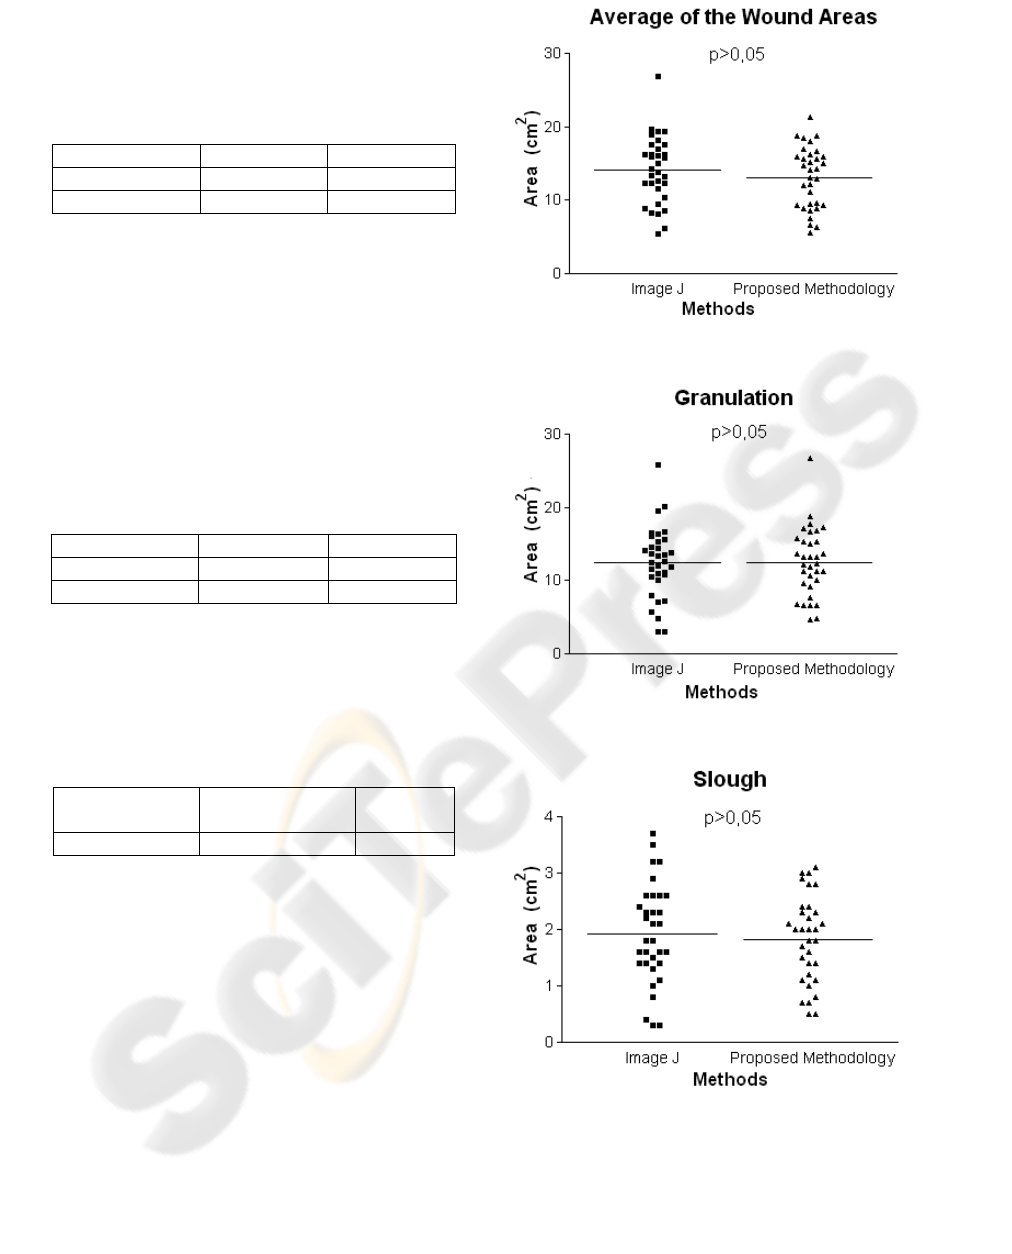
Figure 7: Results of the t Test for total area.
Figure 8: Results of the t Test for granulation.
Figure 9: Results of the t Test for slough.
It is worth reminding that the area evidenced
through Image J is manually performed, and takes a
long time until it comes to the final results, whereas
in the proposed methodology, this process is
automatically performed by the neural network,
HEALTHINF 2008 - International Conference on Health Informatics
64

which makes the processing faster and safer. This
area evidenced manual affects in the difference of
the results of the table 2 and 3 as well as some
terrible interpretations of RNA owed the qualities of
the images and of obtaining of the same ones.
The results were analyzed by a medical area
specialist, who verified the concordance of results
obtained.
Figure 7 shows the graphic of the t-student test
applied to results obtained through both the
proposed methodology and Image J for total areas.
Lines in the center of the graphic show the
arithmetic averages of results obtained through each
methodology and one may observe that they are very
close to each other.
Similarly, there are two other graphics that also
corroborate the efficiency of results obtained
through both Image J and the approach of this paper.
Figure 8 shows the results of t-student tests for
granulation area and Figure 9 for slough area.
5 CONCLUSIONS
Both the Image J and our methodology based on
ANN presented satisfactory results. The t-student
test at 95% was applied and the results confirmed
the efficiency of both methods. This finding testifies
that the variation observed between the results
obtained through both methodologies is acceptable
and that they can be applied in practice.
The results obtained suggest that both image
analysis methods are effective in the measurement of
total area, granulation and slough, being considered
as adequate for the dynamic-therapeutic evaluation
of leg ulcers. Artificial Neural Networks seem to be
a high-level methodology for the analysis of images
due to the lower interference from the
operator/researcher, since it does not require manual
design.
This new application will be one more tool to aid
in the diagnosis at FMRP and perhaps replace the
image J because of its little practicality. For better
performance of this new application is desirable to
use standardized images, as mentioned in item 3,
because the images non-standardized not behaved so
well on the standardized; but nevertheless been
achieved good and acceptable results general finals.
This project encourages and contributes for the
application of new technologies and hence the use of
softwares in this area with the emergence of new
research lines.
REFERENCES
Abbade, L. P. F., Lastória, S., 2005. Venous ulcer:
epidemiology, physiopathology, diagnosis and
treatment. International Journal of Dermatology, Vol.
44, pp. 449 – 456.
Albu, A., Ungureanu, L., 2005. Artificial Neural Network
in Medicine. In Symposium on Applied Computational
Intelligence.
Barros, J. R., 2000. Insuficiência Venosa Crônica. In Pitta,
G. B. B., Castro, A.A. & Burihan, E. Angiologia e
Cirurgia Vascular: Guia Ilustrado, in
UNISAL/ECMAL, Brazil, Maceió.
Borges, E. L., 2005. Tratamento Tópico de Úlcera
Venosa: Proposta de Uma Diretriz Baseada em
Evidência, MSc. Thesis, University of São Paulo.
Dean, S., 2006. Leg Ulcers – Causes e Management.
Reprinted from Australian Family Physician, Vol. 35,
no. 7, pp. 480-484.
Figueiredo, M., 2003. Úlcera Varicosa. Angiologia e
Cirurgia Vascular: Guia Ilustrado, viewed, 13 April
2007, <http://www.lava.med.br/livro/pdf/marcondes_
ulcera.pdf>.
Goldman, R.J., Salcido, R., 2002. More Than One Way to
Measure a Wound: An Overview of Tools and
Techniques – Clinical Management. Advances in Skin
& Wound Care, vol.15, no.5.
Gomes, F.G., Santana, L. A. & Minatel, D. G., 2005. Uso
do Software Image J Para Análise Clínico-Fotográfica
das Úlceras de Perna. 5
o
. Encobio “Encontro de
Bioengenharia”, University of São Paulo, pp. 37.
Gonzalez, R., Woods, R., 2002, Digital Image Processing,
2nd edn, Prentice Hall.
Haykin, S., 2001, Neural Networks: A Comprehensive
Foundation, 2nd edn, Prentice Hall.
Kupcinskas, A. J., 2006, viewed 13 February 2006,
<http://www.ajkj.med.br/ulc.htm>.
Mekkes, J.R., Loots, M.A.M., Van Der Wal, A.C., & Bos,
J.D., 2003. Causes, Investigation And Treatment Of
Leg Ulceration. British Journal of Dermatology,
vol.148, pp. 388-401.
Phillips, T. J., Dover, J. S., 1991. Leg Ulcers. J Am Acad
Dermatol, St Louis, vol.25, pp. 965-987.
Pitta, G. B. B., Castro, A. A. & Burihan, E, 2000.
Angiologia e Cirurgia Vascular: Guia Ilustrado, in
UNISAL/ECMAL, Brazil, Maceió.
Math Works, 2004, ver. 7, computer program, The Math
Works Inc., Matlab Help, USA.
SEGMENTATION AND CLASSIFICATION OF CUTANEOUS ULCERS IN DIGITAL IMAGES THROUGH
ARTIFICIAL NEURAL NETWORKS
65
