
AUTOMATIC BREAST CONTOUR DETECTION IN DIGITAL
PHOTOGRAPHS
Jaime S. Cardoso, Luis F. Teixeira
INESC Porto, Faculdade de Engenharia, Universidade do Porto, Portugal
Maria J. Cardoso
Faculdade de Medicina, Universidade do Porto, Portugal
Keywords:
Computer-aided medical system, breast cancer conservative treatment, breast contour, shortest path problem.
Abstract:
Breast cancer conservative treatment (BCCT), due to its proven oncological safety, is considered, when fea-
sible, the gold standard of breast cancer treatment. However, aesthetic results are heterogeneous and difficult
to evaluate in a standardized way, due to the lack of reproducibility of the subjective methods usually ap-
plied. The objective assessment methods, considered in the past as being less capable of evaluating all aspects
of BCCT, are nowadays being preferred to overcome the drawbacks of the subjective evaluation. A recent
computer-aided medical system was developed to objectively and automatically evaluate the aesthetic result
of BCCT. In this system, the detection of the breast contour on the digital photograph of the patient is a nec-
essary step to extract the features subsequently used in the evaluation process. In this paper an algorithm
based on the shortest path on a graph is proposed to detect automatically the breast contour. The proposed
method extends an existing semi-automatic algorithm for the same purpose. A comprehensive comparison
with manually-drawn contours reveals the strength of the proposed method.
1 INTRODUCTION
Breast cancer conservative treatment (BCCT) has
been increasingly used over the last twenty years due
to identical survival resultswhen comparedto mastec-
tomy, and a better cosmetic outcome. Although con-
siderable research has been put into the oncological
aspects of BCCT, diverse aesthetic results are com-
mon due to the difficult standardization of this type
of treatment, stressing the importance of the aesthetic
evaluation in institutions dedicated to breast cancer
treatment so as to improve working practices.
The first and more generalized methods used for
aesthetic evaluation of BCCT were the subjective ap-
preciation of the patient, directly or through pho-
tographs, by one ore more observers (Harris et al.,
1979). The categorization of the aesthetic result,
subjectively estimated and combined by observers
through this visual inspection relies on the complex
interplay of multiple factors. Considering the subjec-
tivity of any human decision, the obtained results are
questionable and frequently the reproducibility values
obtained among observers are only modest. In fact,
this lack of reproducibility has been shown by oth-
ers (Christie et al., 1996), which creates uncertainty
when comparing results between studies. It has also
been demonstrated that observers from different pro-
fessional backgrounds evaluate cases differently, at-
taining even lower agreement results (Cardoso et al.,
2005).
Objective methods of evaluation have emerged as
a way to overcome these drawbacks of the subjective
evaluation. Initially they consisted only in the com-
parison between the two breasts of simple measure-
ments marked directly in patients or in photographs
(Limbergen et al., 1989; Christie et al., 1996). The
correlation of objectivemeasurements with subjective
overall evaluation has been reported by several au-
thors (Christie et al., 1996). Trying to overcome the
sense that objective asymmetry measurements were
insufficient, other groups proposed the sum of the in-
dividual scores of subjective and objective individual
indices (Al-Ghazal et al., 1999). More recently, a
computer-aided medical system was developed to ob-
jectively and automatically perform the aesthetic eval-
uation of BCCT (Cardoso and Cardoso, 2007b). The
91
S. Cardoso J., F. Teixeira L. and J. Cardoso M. (2008).
AUTOMATIC BREAST CONTOUR DETECTION IN DIGITAL PHOTOGRAPHS.
In Proceedings of the First International Conference on Health Informatics, pages 91-98
Copyright
c
SciTePress

development of this system entailed the automatic ex-
traction of severalfeatures from the photographs(Fig-
ure 1), capturing some of the factors considered to
have impact on the overall cosmetic result: breast
asymmetry, skin colour changes due to the radiother-
apy treatment and surgical scar visibility. In a sec-
ond phase, a support vector machine classifier was
trained to predict the overall cosmetic result from the
recorded features (Cardoso and Cardoso, 2007b).
(a) (b) (c)
Figure 1: Typical photographs.
In order to extract the identified relevant features
from the image, the detection of the breast contour
is necessary. In (Cardoso and Cardoso, 2007a) the
authors describe a semi-automatic method for the de-
tection of the breast contour. The user has to manu-
ally identify the two endpoints of the breast contour.
Subsequently, the algorithm automatically finds the
contour in-between. The algorithm has been imple-
mented in a computer-aided medical system: the soft-
ware automatically finds the contours, extracts rele-
vant features and outputs a predicted overall cosmetic
assessment (excellent, good, fair, or poor).
Here, we improve on the work of (Cardoso and
Cardoso, 2007a) in two different directions. First, we
present an algorithm for the automatic detection of the
endpoints of the breast contour, thus eliminating any
user input from the process. Therefore a totally auto-
matic breast contour detection is achieved. Next, we
provide a thorough evaluation of the performance of
the proposed method against manually-drawn breast
contours. Standard metrics are employed to compare
two contours.
Before presenting the proposed approach, and for
completeness, we recover the framework for breast
contour detection between two known endpoints of
(Cardoso and Cardoso, 2007a). Then, in section 3
we detail how to automatically find the endpoints of a
breast contour. Examples are provided and a perfor-
mance analysis is conducted in section 4. Finally, in
section 5, we conclude the paper and present possible
directions of future work.
2 A SHORTEST PATH APPROACH
TO CONTOUR DETECTION
When knowing the two endpoints of the breast con-
tour, we are left with the problem of finding the path
between both endpoints that goes through the breast
contour. As the interior of the breast itself is essen-
tially free of edges, the path we are looking for is the
shortest path between the two endpoints, if paths (al-
most) entirely through edge pixels are favoured. More
formally, let s and t be two pixels of the image and P
s,t
a path over the image connecting them. We are inter-
ested in finding the path P that optimizes some pre-
defined distance d(s,t). This criterion should embed
the need to favour edge pixels.
In the work to be detailed, the image grid is con-
sidered as a graph with pixels as nodes and edges con-
necting neighbouring pixels. Therefore, some graph
concepts are in order.
2.1 Definitions and Notation
A graph G = (V,A) is composed of two sets V and
A. V is the set of nodes, and A the set of arcs (p,q),
p,q ∈ V. The graph is weighted if a weight w(p,q)
is associated to each arc, and it is called a digraph
if the arcs are directed, i.e., (p,q) 6= (q, p). A path
from p
1
to p
n
is a list of unique nodes p
1
, p
2
,. .. , p
n
,
(p
i
, p
i+1
) ∈ A. The path cost is the sum of each arc
weight in the path.
In graph theory, the shortest-path problem seeks
the shortest path connecting two nodes; efficient al-
gorithms are available to solve this problem, such as
the well-known Dijkstra algorithm (Dijkstra, 1959).
2.2 Proposed Algorithm
If the weight assigned to an edge captures the in-
tensity of the contour of the adjacent pixels, finding
the best contour translates into computing the min-
imum accumulated weight along all possible curves
connecting s and t:
d(s,t) = min
P
s,t
∑
w(p, q). (1)
Note that, if we ignore the weight component, we are
simply computing the regular Euclidian distance be-
tween s and t along the path P
s,t
(which will be a
straight line for the shortest path).
Therefore, to detect the breast contour in (Car-
doso and Cardoso, 2007a) it is proposed a two step
approach:
1. Apply an edge detector to the original image
(other operations, replacing the edge detector, will
be proposed latter in this work). The resulting bi-
nary image enhances the points of interest.
2. Detect the breast contour on the edge image, by
finding the shortest path between the two end-
points.
We now detail this second step.
Starting by modelling the edge image as a graph,
correspond a node to each pixel. Connect two nodes
with an arc on the graph iff the corresponding pixels
are neighbours (8-connected neighbourhoods) on the
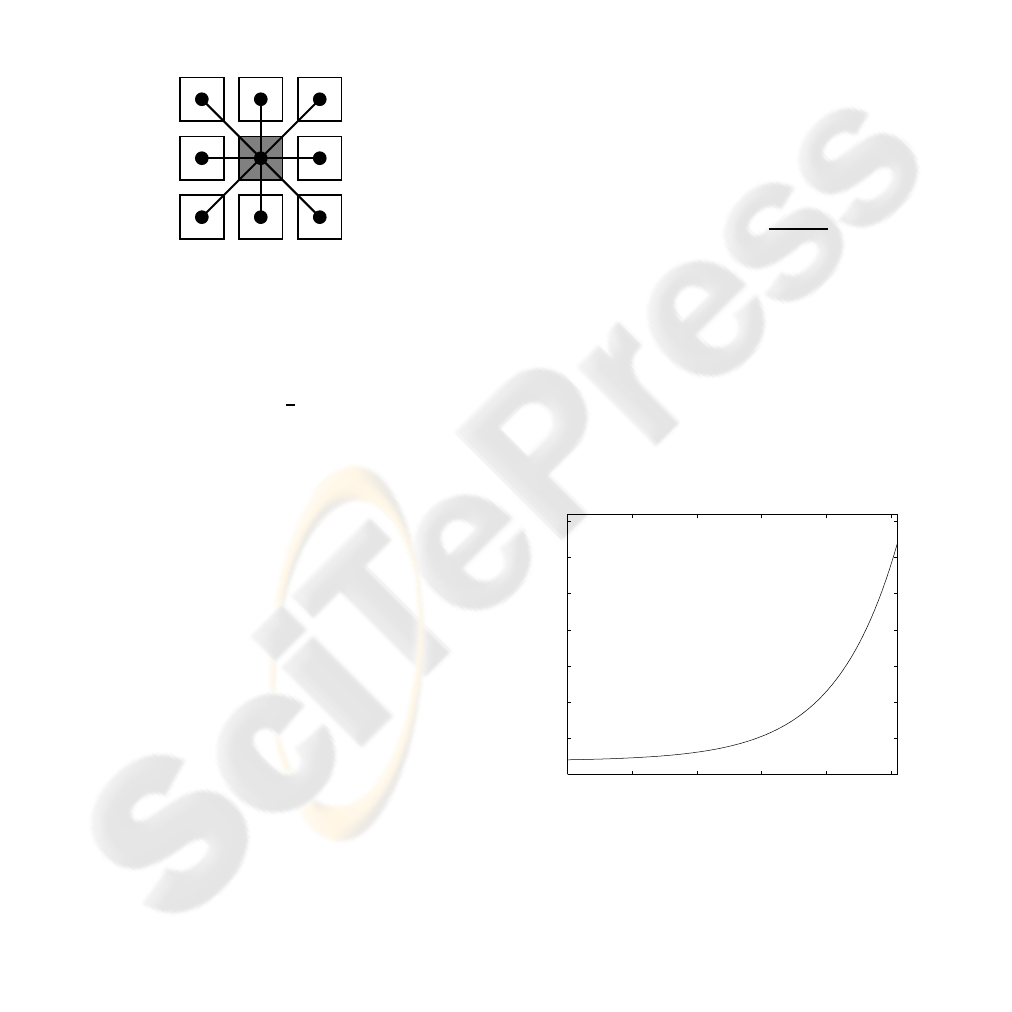
image. The weight of each arc is a function of pixels
values and pixels relative positions — see Figure 2:
w
5
w
1
w
3
w
7
w
2
w
4
w
8
w
6
Figure 2: Arc weight between two pixels.
w
i
=
(
f(p,q
i
) if q
i
∈ 4-connected neighbourhood of p
h(p,q
i
) if q
i
6∈ 4-connected neighbourhood of p
In this work we set h(.,.) =
p
(2) f(., .).
Now, to favour paths through edge pixels, one can
set
f(p,q) =
(
c
1
if both p and q are edge pixels
c
2
otherwise
,
with c
2
> c
1
. In this work c
1
and c
2
were experi-
mentally determined as 2 and 32, respectively. Note
that c
1
must be set greater than zero, to also favour
the smallest path, when more than one exists through
edge pixels only. Finally, the solution to the shortest
path problem will yield the intended breast contour.
2.3 Algorithm Generalization
The proposed paradigm can be conveniently general-
ized. The application of an edge detector in the first
step can miss to detect segments of the breast con-
tour. This is especially true for women with small
breasts (leading to weak contours) or when the breast
is severely deformed with the excision of a large sam-
ple of tissue. A natural improvement is to replace
the binary image outputted by the edge detector with
a richer gradient image. Now, the shortest path al-
gorithm should try to follow pixels with high gra-
dient values. Thus, the f(.,.) and h(., .) functions
have to be properly generalized. A simple strategy
is to set f(p,q) =
ˆ
f
255 − min(grad(p),grad(q))
,
where
ˆ
f(.) is a monotonically increasing function.
Note that this more general setting has the binary case
as a particular instantiation. To summarize, the pro-
posed general framework to find the contour between
two endpoints encompasses:
• A gradient computation of the original image. In a
broader view, this can be replaced by any feature
extraction process that emphasizes the pixels we
are seeking for.
• Consider the gradient image as a weighted graph
with pixels as nodes and edges connecting neigh-
bouring pixels. Assign to an edge the weight
w
i
= f(p, q) or w
i
= h(p,q), as described before.
The gradient model adopted in the experiments re-
ported latter is based on the Sobel operator. The So-
bel operator is applied on the x and y directions; from
the computed values, S
x
and S
y
, the magnitude of the
gradient is estimated as z =
q
S
2
x
+ S
2
y
. Costs were
assigned based on an exponential law:
ˆ
f(z) = αexp(βz) + δ, α,β, δ ∈ ℜ
The parameters α,β, δ were chosen to yield
ˆ
f(0) = 2
and
ˆ
f(255) = 32, leading to the same range of costs
as the binary model. The third degree of freedom was
experimentally tuned. The adopted transformation
was (see also Figure 3)
ˆ
f(z) = 0.15exp(0.0208z) +
1.85.
0 50 100 150 200 250
0
5
10
15
20
25
30
35
input
ˆ
f
Figure 3: Transformation
ˆ
f(.).
3 AUTOMATIC DETECTION OF
ENDPOINTS
The challenge now is to automatically extract the end-
points. In order to address this key problem we will
assume, very reasonably, that the photo contains only
the torso of the patient.
The position of the external endpoint of the breast
contour can be assumed at the point of the body where
the arm contour intersects the trunk contour. How-
ever, because patients are in the arms-down position,
the arm’s contour is almost indistinguishable from the
trunk’s contour. Therefore, we define the external
endpoint of the breast contour as the highest point of
the trunk contour.
The approach just delineated requires first the de-
tection of the trunk contour. That may be searched
among the strongest lines of gradient with approxi-
mate vertical direction.
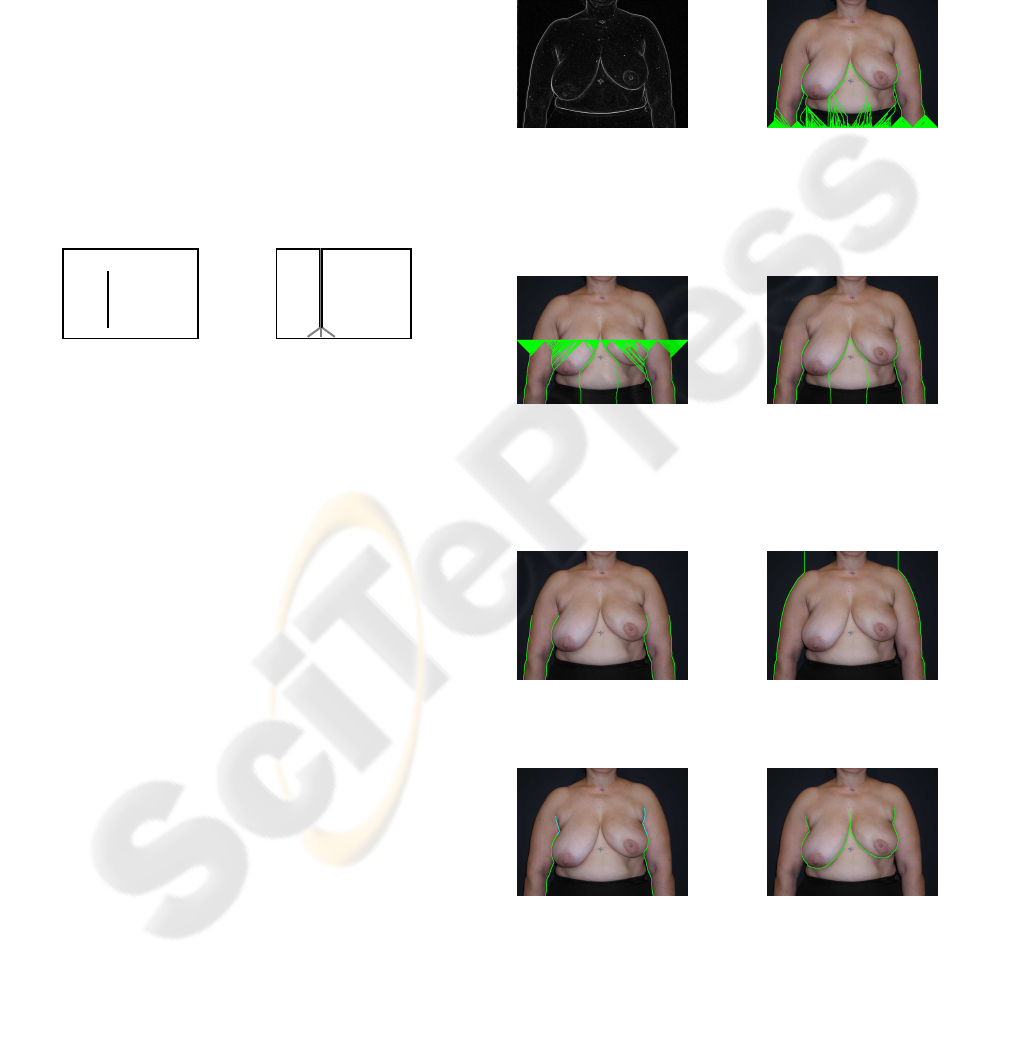
In order to get a first intuition of the general result,
it is instructive to explore a basic example. Consider
in Figure 4(a) the gradient intensity, with black pixels
representing high intensity values.
(a) A single vertical line
of nonzero gradient.
s
1
s
2
s
3
(b) The shortest path be-
tween some points on the
bottom and the top mar-
gin.
Figure 4: A first exemplificative example.
In Figure 4(b) the shortest paths between starting
points s
i
on the bottom row and the whole top row
are traced. The distance between a fixed point on the
bottom row and the whole top row can be generally
formulated as the distance between a point s and a
region Ω. The distance from a pixel s and a region Ω
is given by
d(s,Ω) = min
t∈Ω
d(s,t), (2)
where d(s,t) was defined previously. All the traced
paths got attracted by the vertical line.
Phase 1: we propose to apply this procedure to the
bottom half of our photographs:
1. Compute the gradient of the image (see Fig-
ure 5(a)).
2. Compute the shortest path between each point in
the bottom row and the whole middle row of the
gradient image (see Figure 5(b)).
3. Compute the shortest path between each point in
the middle row and the whole bottom row of the
gradient image (see Figure 5(c)).
4. Discard all paths except for those common to
steps 2 and 3 (see Figure 5(d)).
5. Discard paths with a cost superior to half of the
maximum possible cost (see Figure 5(e)). Finally,
the trunk contour is defined as the two contours
closest to the middle of the photograph.
(a) Gradient. (b) Shortest paths from
a pixel s in the bot-
tom line and the whole
middle row Ω
1
, super-
imposed on the original
image.
(c) Shortest paths from
a pixel s in the mid-
dle row and the whole
bottom row Ω
2
, super-
imposed on the original
image.
(d) Strong paths be-
tween the middle and
bottom rows.
(e) Selected paths, su-
perimposed on the orig-
inal image.
(f) Strong paths be-
tween the top and
bottom rows.
(g) The external end-
point of the breast con-
tour is the highest point
of the shortest path.
(h) Totally automated
breast contour.
Figure 5: Results for a real photograph.
It is appropriate to introduce now the concept of
strong path.
Definition. A path P
s,t
is a strong path between re-
gions Ω
1
and Ω
2
if P
s,t
is the shortest path between
s ∈ Ω
1
and the whole region Ω
2
, and P
s,t
is the short-
est path between t ∈ Ω
2
and the whole region Ω
1
.
With this definition, steps 2, 3 and 4 are just the
computation of the strong paths between the middle
and bottom rows.
At the end of this phase we have already the po-
sition of the two trunk contours, but we have stopped
the process at the middle of the image. Perhaps it is
important to stress that if the process was conducted
between the bottom and top rows, the trunk contours
would be lost, as the only strong paths between the
top and bottom rows would be the external silhouette
of the patient (see Figure 5(f)) .
Phase 2: to determine the top of the trunk contour,
we need to continue the path produced in phase 1 un-
til a certain condition is met. Towards that end, we
propose to find the shortest path between the end-
ing point of the strong contour found in phase 1 and
row R
i
,R
i
= middle row,· ·· ,top row. We select the
highest row for which the shortest path does not con-
tain a long sequence (
LENGTHTHRESHOLD
) of consec-
utive pixels with low gradient (
GRADIENTTHRESHOLD
).
Figure 5(g) illustrates the results obtained for the
exemplificative photograph (
LENGTHTHRESHOLD
and
GRADIENTTHRESHOLD
were set to 12 and 48, respec-
tively).
Before applying the algorithm presented in Sec-
tion 2 to compute the breast contour we need also
the internal endpoint of the breast contour. This was
estimated simply as the middle point between the
two external endpoints. Finally, the computation of
the breast contour yields the result presented in Fig-
ure 5(h).
4 RESULTS
The methodology proposed in this paper was assessed
on a set of photographs from 120 patients. The pho-
tographs were collected in three different institutions
in Portugal. All patients were treated with conserva-
tive breast surgery, with or without auxiliary surgery,
and whole breast radiotherapy, with treatment com-
pleted at least one year before the onset of the study.
Breast images were acquired employing a 4M pixel
digital camera. A mark was made on the skin at the
suprasternal notch and at the midline 25 cm below the
first mark (see Figure 1). These two marks create a
correspondence between pixels measured on the dig-
ital photograph and the length in centimetres on the
patient.
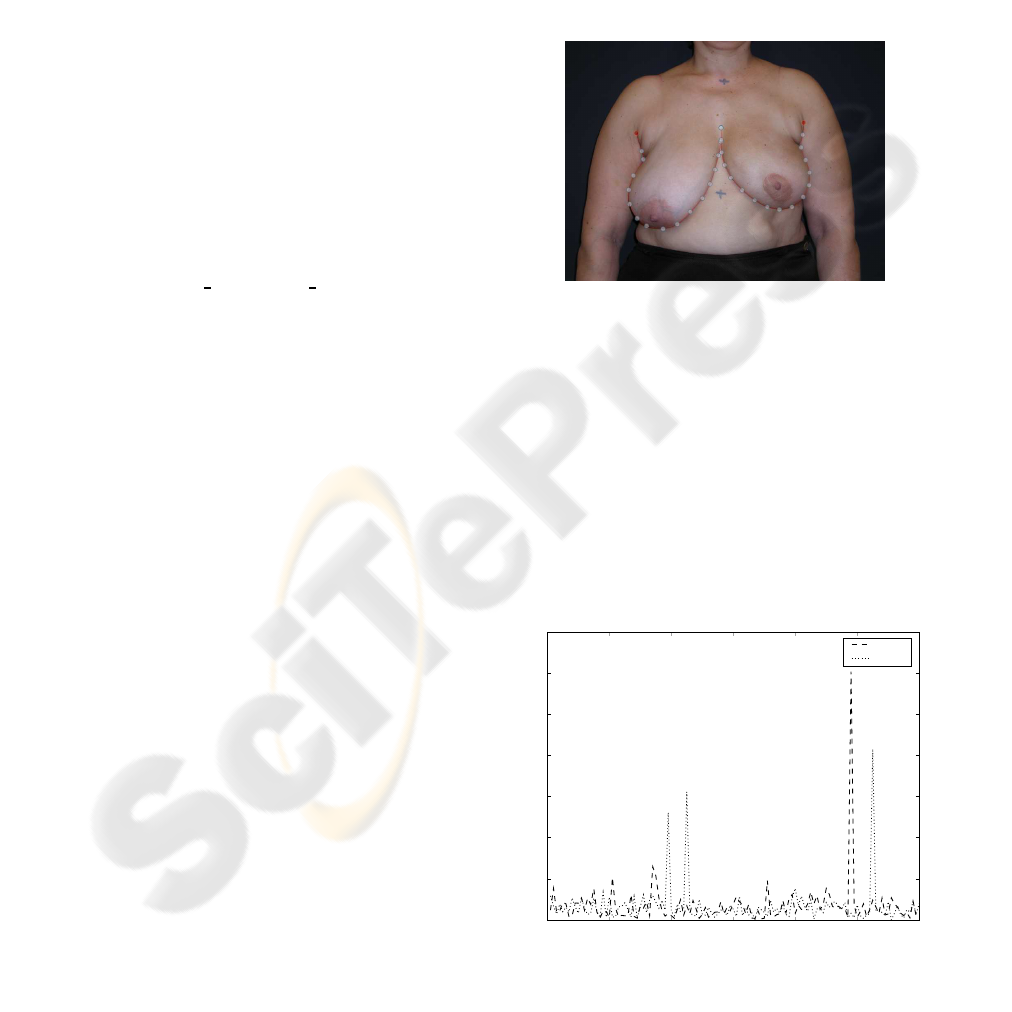
In order to investigate the possibility of defining
an automated method of detecting the breast contour,
a set of patients with known breast contour was re-
quired. Since, ideally, the automated method should
correlate coherently with human assessment, eight
different observers were asked to manually draw the
contours. A software tool was developed specifically
to assist on this job. The user defines the contour by
positioning seventeen control points of cubic splines,
see Figure 6.
Figure 6: Software for manual breast contour definition.
Before applying the proposed algorithm, each im-
age was downsized to a constant width of 768 pix-
els, while keeping the aspect ratio. This improves the
computational performance of the implementation of
the software, without degrading the quality of the fi-
nal result.
Figure 7 shows the evolution of the error when es-
timating the external endpoints’ position of the breast
contour. The error in pixels was scaled to centimetres
with the help of the marks made on the skin of the
patient. Table 1 summarizes the results.
0 20
40
60 80
100 120
patient number
0
2
4
6
8
10
12
14
distance (cm)
left
right
Figure 7: Evolution of error (cm) in the position of the ex-
ternal endpoints of the breast contour over 120 photographs.
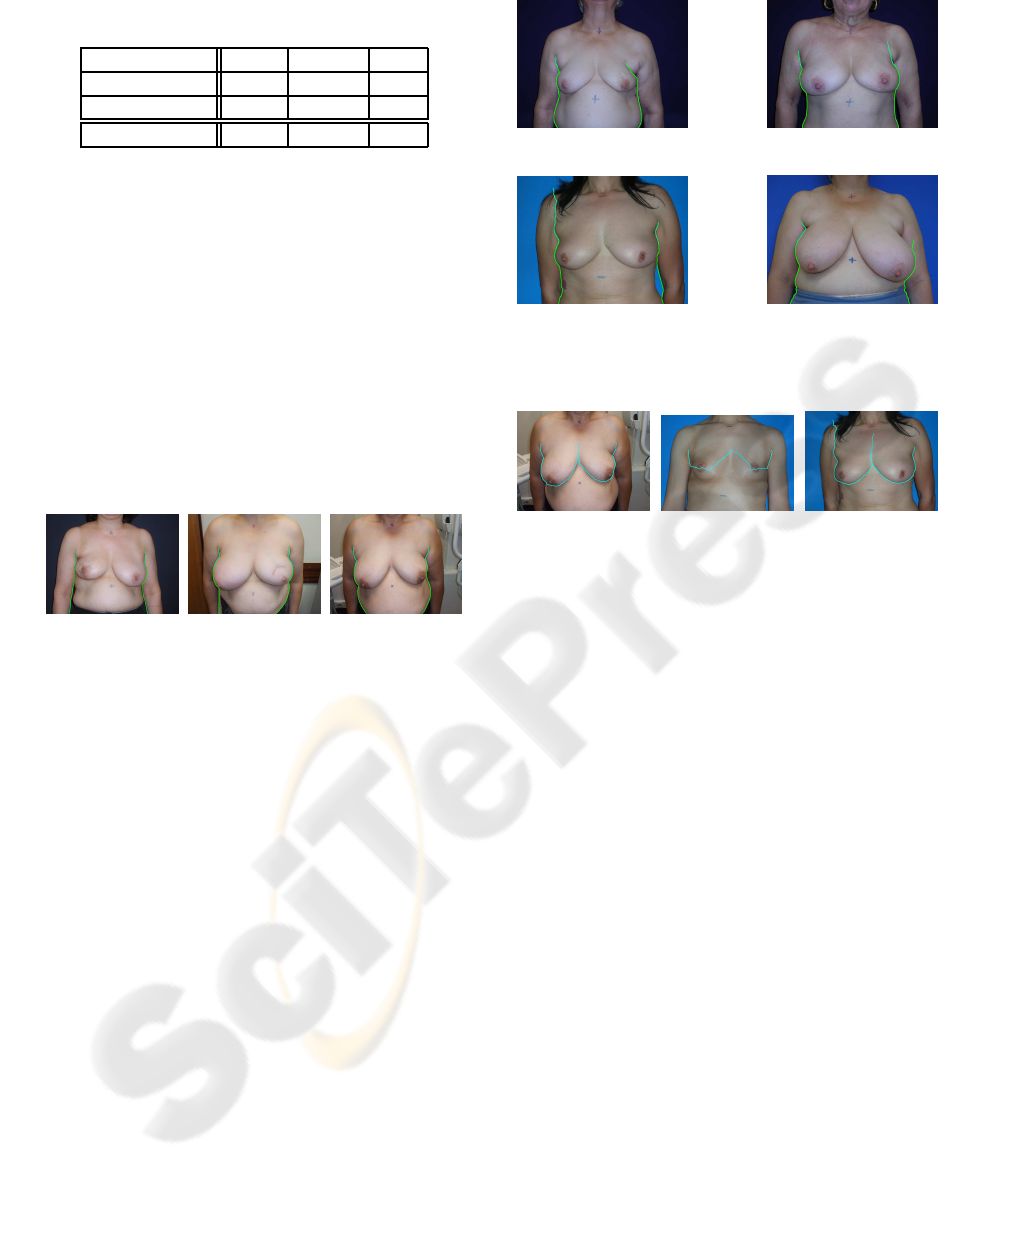
Table 1: Mean, standard deviation and maximum value of
errors in the position of the endpoints.
Error (cm) mean std dev max
left endpoint 0.7 1.1 12.1
right endpoint 0.7 1.0 8.3
total 0.7 1.1 12.1
It can be observed that the proposed algorithm
has a very interesting performance. The average er-
ror is quite low, less than 1 centimetre. Figure 8
shows some of the photographs for each the algorithm
worked satisfactorily. It represents the result after the
two phases of the algorithm. The highest point of the
trunk contour provides the detected external endpoint
of the breast contour. It is visible in patient #35 that
the algorithm is robust against cluttered background.
It is also visible in Figure 8 that, although the strong
paths detected in phase 1 do not always correspond
exactly to the trunk contour, the algorithm is still able
to successfully detect the endpoints.
(a) Patient #05. (b) Patient #22. (c) Patient #35.
Figure 8: Selected successful results.
Nevertheless, four endpoints were clearly mis-
placed. These results, displayed in Figure 9, bring to
light some of the limitations of the current state of the
proposed approach. In patients #39, #45 and #105 the
shortest path followed a ‘wrong’ contour, misplacing
the endpoint. With patient #98 the long hair created a
false ‘path’ till the top of the image.
After the automatic detection of the endpoints, the
algorithm detailed in Section 2 to find the breast con-
tour was applied to the photographs. Different scenar-
ios can take place:
1. The endpoints were successfully located and the
breast contour is correctly found. This desirable
result is illustrated in Figure 10(a).
2. The endpoints were successfully located but the
algorithm misses to follow adequately the breast
contour (see Figure 10(b)).
3. The endpoints were poorly located but the algo-
rithm rapidly finds and tracks the right breast con-
tour (see Figure 10(c)).
4. The endpoints were poorly located and the breast
contour is incorrectly tracked (this scenario did
not occur in the experimental set of photographs).
(a) Patient #39. (b) Patient #45.
(c) Patient #98. (d) Patient #105.
Figure 9: All poor results.
(a) Patient #35. (b) Patient #114. (c) Patient #98.
Figure 10: Breast contour results.
In a last set of experiments, the quality of the
breast contour tracking algorithm was assessed. In-
stead of a simple subjective evaluation as provided in
(Cardoso and Cardoso, 2007a), we conducted a com-
plete objective evaluation, based on the hausdorff and
the average distances to compare two contours. The
hausdorff distance is defined as the “maximum dis-
tance of a set to the nearest point in the other set”.
Roughly speaking, it captures the maximum separa-
tion between the manual and the automatic contours.
As observed in Figure 11 and Table 2 the experimen-
tal values obtained for the hausdorff distance corre-
late well with the error on the endpoints. This fact
means that, most of the times, the major error on the
automatic contour is located on the endpoint, with the
shortest path algorithm recovering the true contour
rapidly. A clear exception is patient #73, for which
the error in the endpoints is negligible but the haus-
dorff distance between contours is very high. Here,
the contour tracking algorithm missed to follow the
contour, although it received proper endpoints.
The average distance between two contours cap-
tures better the perceived quality of the automatic
breast contour. Here, the distance is averaged over
the whole contour. Figure 12 and Table 3 summarize
these results. As expected by visual inspection pa-
tient of #98 in Figure 10(c), although the error on the
endpoint’s location was high, the breast contour algo-
0 20
40
60 80
100 120
patient number
0
2
4
6
8
10
12
14
hausdorff distance (cm)
right
left
Figure 11: Evolution of hausdorff distance (cm) in the po-
sition of the breast contour over 120 photographs.
Table 2: Mean, standard deviation and maximum value of
hausdorff distance in the position of the breast contour.
Hausdorff dist. (cm) mean std dev max
left endpoint 1.5 1.7 13.5
right endpoint 1.3 1.2 8.7
total 1.4 1.5 13.5
Table 3: Mean, standard deviation and maximum value of
average distance in the position of the breast contour.
Average dist. (cm) mean std dev max
left endpoint 0.2 0.6 5.2
right endpoint 0.1 0.3 2.4
total 0.2 0.4 5.2
rithm recovered rapidly, translated into a small aver-
age distance (but a high hausdorff distance).
The consequences of the diverse errors enumer-
ated before to the computer-aided medical system are
different and have to be further studied. For exam-
ple, one of the features used for the objectiveaesthetic
evaluation of the BCCT is the difference between the
levels of inferior breast contour points. This measure
is quite robust over strong errors on the endpoints’
position, as long as the breast contour is correctly
tracked. Other features, such as the difference in the
area of the breast are much more sensible to the posi-
tioning of the endpoints. One line of future investiga-
tion is the selection of features robust to the common
errors of the automatic detection of notable points
(contour endpoints, breast contour, nipples, etc) but
still capturing adequately the aesthetic result, leading
to a good classification performance.
0 20
40
60 80
100 120
patient number
0
1
2
3
4
5
6
average distance (cm)
right
left
Figure 12: Evolution of the average distance (cm) in the
position of the breast contour over 120 photographs.
5 CONCLUSIONS
A method has been described for applying graph con-
cepts to the task of automatically extracting the breast
contour in digital photographs of the torso of a pa-
tient, after submitted to a breast cancer conservative
treatment. In the proposed framework the problem of
finding the endpoints of the breast contour is formu-
lated as a problem of finding strong contours between
two regions, a concept introduced here for the first
time. The breast contour is found as the solution to
the shortest problem on a graph, after conveniently
modelling the image as a weighted graph. Prelimi-
nary results indicate an excellent performance in the
task of finding the external endpoints of the contour
and a good performance on detecting the breast con-
tour. Future work will focus on improvements to the
algorithm including generalizing the solution to other
typical patient positions in these studies.
ACKNOWLEDGEMENTS
This work was partially funded by Fundac¸˜ao para
a Ciˆencia e a Tecnologia (FCT) - Portugal through
project PTDC/EIA/64914/2006.
REFERENCES
Al-Ghazal, S. K., Blamey, R. W., Stewart, J., and Morgan,
A. L. (1999). The cosmetic outcome in early breast
cancer treated with breast conservation. European
journal of surgical oncology, 25:566–570.

Cardoso, J. S. and Cardoso, M. J. (2007a). Breast contour
detection for the aesthetic evaluation of breast cancer
conservative treatment. In International Conference
on Computer Recognition Systems (CORES’07).
Cardoso, J. S. and Cardoso, M. J. (2007b). Towards an in-
telligent medical system for the aesthetic evaluation of
breast cancer conservative treatment. Artificial Intel-
ligence in Medicine, 40:115–126.
Cardoso, M. J., Santos, A. C., Cardoso, J. S., Barros, H.,
and Oliveira, M. C. (2005). Choosing observers for
evaluation of aesthetic results in breast cancer conser-
vative treatment. International Journal of Radiation
Oncology, Biology and Physics, 61:879–881.
Christie, D. R. H., O’Brien, M.-Y., Christie, J. A., Kron,
T., Ferguson, S. A., Hamilton, C. S., and Denham,
J. W. (1996). A comparison of methods of cosmetic
assessment in breast conservation treatment. Breast,
5:358–367.
Dijkstra, E. W. (1959). A note on two problems in connex-
ion with graphs. Numerische Mathematik, 1:269–271.
Harris, J. R., Levene, M. B., Svensson, G., and Hellman,
S. (1979). Analysis of cosmetic results following pri-
mary radiation therapy for stages i and ii carcinoma of
the breast. International Journal of Radiation Oncol-
ogy Biology Physics, 5:257–261.
Limbergen, E. V., Schueren, E. V., and Tongelen, K. . V.
(1989). Cosmetic evaluation of breast conserving
treatment for mammary cancer. 1. proposal of a quan-
titative scoring system. Radiotherapy and oncology,
16:159–167.
