
CLASSIFICATION OF PREMATURE VENTRICULAR BEAT
USING BAYESIAN NETWORKS
Lorena S. C. de Oliveira, Rodrigo V. Andreão and Mário Sarcinelli-Filho
Federal University of Espírito Santo, Graduate Program on Electrical Engineering
Av. Fernando Ferrari, 51, Goiabeiras, CEP 29075-910, Vitória, ES, Brazil
Keywords: Artificial Intelligence, Medical Informatics, Bayesian Networks, Decision-Support Systems, PVC detection.
Abstract: This paper presents a system based on Bayesian networks (BN) to support medical decision-making. The
proposed approach is able to learn from available data, and provides an intuitive graphical interpretation of
the problem, which can be easily configured by a physician. This approach is evaluated for the first time in
the problem of premature ventricular contraction (PVC) detection, using a representative set of records of
the MIT-BIH database. The results obtained emphasize the capability of the Bayesian network to make
decisions even when the information about some symptoms or events is not complete. Moreover, the good
performance obtained opens many perspectives for the use of BN to deal with beat classification.
1 INTRODUCTION
In the last two decades a great effort has been
invested to develop systems to automatically
interpret long-term electrocardiogram (ECG)
records. Two important reasons are the great
demand for those exams and the long time
specialists spend to make a complete diagnosis
based on such records. The particular interest for
ECG is due to its efficiency in the diagnosis of
arrhythmia and the great incidence of cardiac
diseases in industrialized countries (Kadish et al.,
2001).
Most of the automatic analyses of ECG are
made through rule-based systems conceived by
experts in the fields of artificial intelligence and
pattern recognition. In general, a rule-based system
consists in acquiring the knowledge about a given
process or problem through a set of examples or
facts already happened in order to apply it to new
situations related to the same problem. Several
works in this field employ heuristic rules, neural
networks and statistical approaches to build such
systems.
Heuristic approaches model the human reasoning
through a set of deterministic rules, which are very
dependent on how the individual deals with a
particular problem. The cause-effect relations among
the rules can be graphically represented, allowing
the individual to follow the decision logic and
criticize the results. However, this kind of approach
does not necessarily consider the uncertainty, a key
feature when regarding decision-making systems.
An example of a heuristic approach for PVC
classification is presented in (Andreão, Dorizzi and
Boudy, 2006), where the limitation of the heuristic
rule is dealt with through using regions of certainty
related to the possible values of a certain variable.
On the other hand, statistical approaches are
built after a learning phase based on a set of selected
examples. Thus, the classification capability of this
class of approaches is highly dependent on the
information learned a priori. However, they embed a
certain potential of evolution (through using a new
set of examples in the learning phase).
A method which is in evidence nowadays to
deal with arrhythmia classification is the use of
neural networks (Farrugia, Yee and Nickolls, 1991;
Kuppuraj, 1993). However, such approaches
perform as black boxes, making too hard to an
expert in cardiology to interpret and configure the
classifier. Another weak point associated to the use
of neural networks is their inflexibility to adapt
themselves to new examples, since the learning
procedure demands a large set of examples.
Moreover, the uncertainty related to the
classification problem is not really treated. That is
186
S. C. de Oliveira L., V. Andre
˜
ao R. and Sarcinelli-Filho M. (2008).
CLASSIFICATION OF PREMATURE VENTRICULAR BEAT USING BAYESIAN NETWORKS.
In Proceedings of the First International Conference on Health Informatics, pages 186-191
Copyright
c
SciTePress

why many systems employing neural networks
should be improved before aiming at being
considered as a tool for the decision-making
associated to a diagnosis (Crawford et al., 1999).
In order to overcome the limitation of the NN
to deal with uncertainty, Gao et al. (2005) used a
probability measure in the output layer of an NN for
each beat class. However, the other limitations of the
NN above mentioned continue unsolved.
Finally, other statistical approaches, such us
those employing Bayesian networks, have shown to
be promising to address most of the limitations of
the NN. Indeed, Bayesian networks are quite
suitable to deal with uncertainty (Pearl, 1988), they
are flexible enough to learn from new examples and
they provide a very intuitive graphical representation
that could easily be configured by a cardiologist.
Following this reasoning, a rule-based system is
here proposed to assist the cardiologist in the
diagnosis of premature ventricular beats, a quite
common arrhythmia present in long-term
electrocardiograms. Such a system is based on the
Bayesian network framework, which is quite
suitable to take into account the uncertainty
associated to human interpretation. To the extent of
the author’s knowledge, this is the first time such
framework is used for the particular problem of
beat-classification. The major characteristics of such
approach are hereinafter stressed, and experiments
validating it are presented as well.
2 METHODOLOGY
2.1 Bayesian Networks
Probabilistic methods are a well-known topic in the
field of artificial intelligence (AI), and are quite
useful to model uncertainty.
To know probability is a need when one should
deal with the idea of a random experiment, which
generates events having an assigned uncertainty of
occurrence (Clarke and Disney, 1970). In the theory
of probability one finds the Theorem of Bayes,
which is employed to compute P(A|B) the
conditional probability of the occurrence of an event
A given the evidence B, i.e., the event B was
observed. Such a theorem states that
,
)(
)()|(
)|(
BP
APABP
BAP =
(1)
where P(A|B) is the posterior probability of A given
B, P(B|A) is the prior probability of B given A, P(A)
is the prior probability of A, and P(B) is the prior
probability of B.
The Bayesian networks are based on the
Theorem of Bayes, working on the causal relations
among random variables. They are direct acyclic
graphs, whose nodes represent random variables
with assigned uncertainty whose arcs represent the
direct causal relation between the connected nodes.
These causal relations are quantified through
conditional probability distributions (Pearl, 1988).
The network does not necessarily have nodes
corresponding to all causes of a given event, since
the influence of irrelevant factors is modelled by the
probability. Thus, using just a few variables it is
possible to deal with a large number of causes.
The Bayesian networks can be composed of
discrete random variables (multinomial distribution),
continuous random variables (Gaussian and
exponential distributions (Shachter, 1986; Buntine,
1991)), or a mixture of both.
2.2 ECG Analysis
The automatic analysis of the ECG signal has been a
topic of research over the three last decades. The
ECG is a record of the heart electrical activity in
which changes in the elementary waveforms of the
signal (P, QRS complex and T waves) characterizes
an abnormal beat (see Figure 1).
In particular, the premature ventricular
contraction (PVC) is a heart beat which is generated
by an electrical impulse which does not follow the
normal electrical conduction path through the heart
(sinus node, atrioventricular node, and ventricles).
Instead, it starts at the ventricles earlier than
expected. A PVC beat is characterized by a heart
beat without the P wave (atrial contraction), a
premature and large QRS complex and a
compensatory pause just after, as shown in Figure 2.
Figure 1: Heartbeat observed on an ECG with elementary
waveforms and intervals identified (Andreão, Dorizzi and
Boudy, 2006).
CLASSIFICATION OF PREMATURE VENTRICULAR BEAT USING BAYESIAN NETWORKS
187

Because of its characteristics and the availability
of ambulatory ECG signal databases rich on this
arrhythmia, most work in the field of ECG analysis
evaluate the performance classifying systems
through the detection of PVC beats
.
Taking the characteristics of the PVC beat,
however, it is very difficult to precise how much
premature it is. Actually, a beat is premature when
the R-R interval, which means the time interval
between its peak and the peak of the previous beat,
is shorter than it should be. The problem here is that
the decision of how long should this interval be to
characterize a premature beat depends on the point
of view of the cardiologist, which characterizes an
uncertainty that should be taken into account by the
system during classification.
2.3 Bayesian Network for PVC
Classification
The first step to be followed when building a
Bayesian network is to identify, from the problem
given, the random variables and their causal
relations. Figure 3 illustrates the graphical
representation of the Bayesian network implemented
here. The nodes, represented as rectangles, are
discrete random variables, while the nodes,
represented as circles, are continuous random
variables. RR is the random variable modelling the
time interval between two consecutive QRS-
complexes (or heart beats), whose probability
density function (pdf) is a Gaussian function. The
node LL is also a random variable with a Gaussian
pdf, now representing the measure of the duration of
the QRS-complex, in terms of likelihood (Andreão,
Dorizzi and Boudy, 2006).
Every time a PVC episode occurs (PVC node is
true) the related beat is premature (Premature Beat
node is true), and if its QRS-complex is larger than
the normal one the Ventricular Node is also true.
Since the nodes PVC, Premature Beat and
Ventricular Beat are discrete, their conditional
probabilities are represented by a table in which the
binary possibilities true (T) and false (F) have their
related probabilities.
After identifying all random variables, it is
necessary to estimate their respective probabilities.
This procedure can be accomplished by a specialist
having the prior knowledge about each variable of
the system. In our case, the knowledge of the
specialist about the distributions (pdfs) of the RR
and LL random variables was obtained through a
labelled database, where each heart beat of the ECG
record has a Normal or a PVC label (see Section 3).
However, the RR and LL values are not provided by
the database. In this paper, it was used the HMM-
ECG system developed by Andreão, Dorizzi and
Boudy (2006), which automatically labels the signal,
returning as a result the RR and LL values of each
detected heartbeat. The values are normalized
according to the value of the last normal beat
detected.
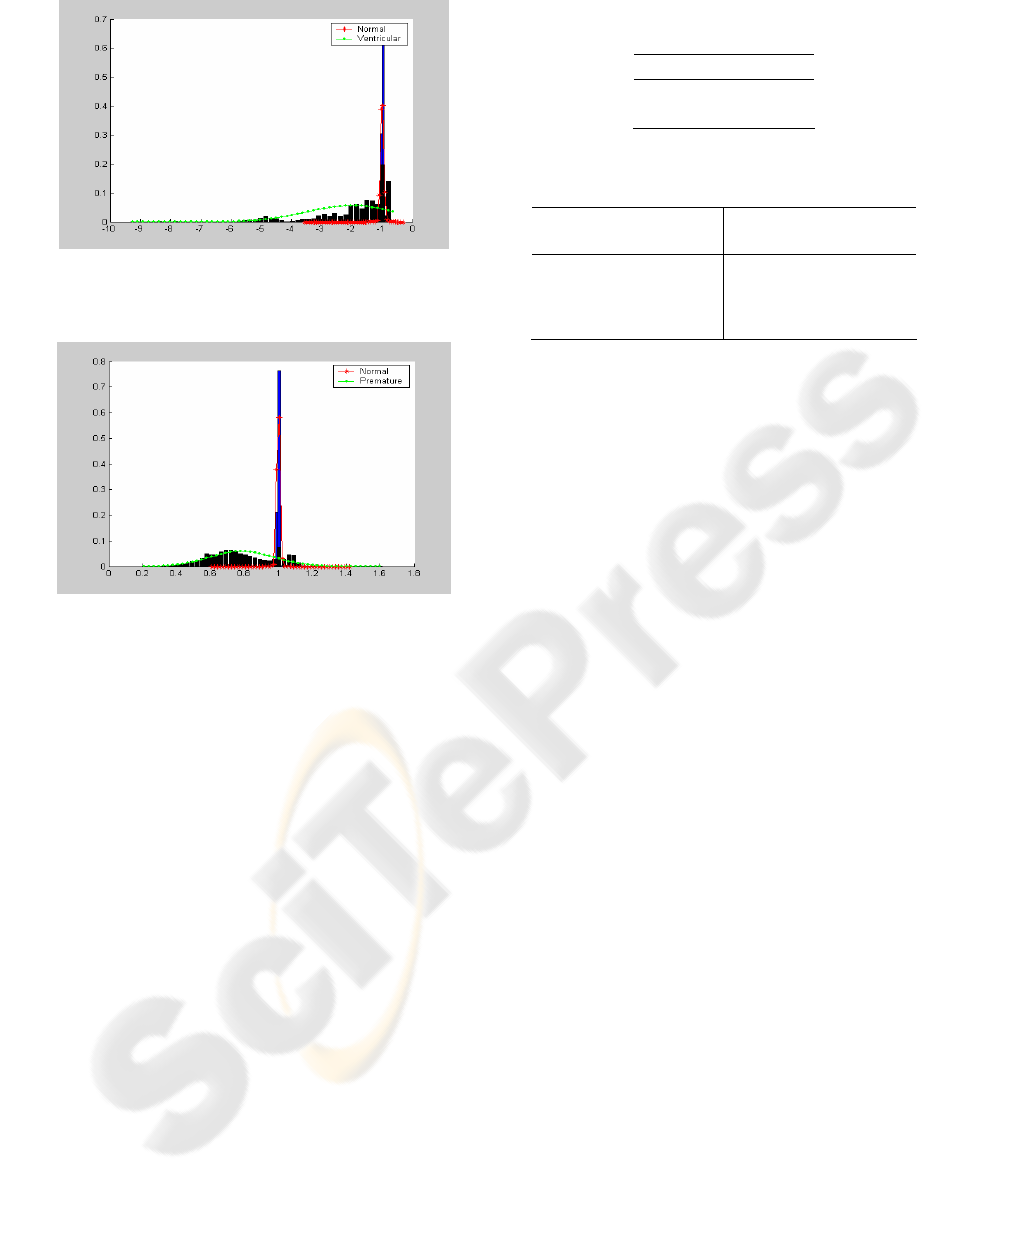
The mean and variance of the LL and RR pdfs
were estimated over a training set extracted from the
MIT-BIH (1997) database, and the results are shown
in Figures 4 and 5, respectively. There, one can
observe that the normal values are all normalized as
one and the abnormal ones are spread to the right for
the LL values and to the left for the RR values.
The other variables of the network are modelled
through tables of conditional probability, which are
shown in Tables 1 and 2.
PVC
Premature
Beat
Ventricular
Beat
RR
LL
Figure 3: Graphical representation of the Bayesian
N
etwork for PVC beat classification.
Normal
interval
Shorter
interval
Longer interval
Normal Normal PVC Normal
Figure 2: Electrocardiogram containing PVC beat.
HEALTHINF 2008 - International Conference on Health Informatics
188
The estimation of the variables individually does
not model the relations of dependency among
variables suitably. This is why we have implemented
a learning step where all network parameters are
adjusted from a training set of examples. Such a
learning step is performed in two different ways: 1)
it is firstly considered that the five nodes are all
observable. This means that from the labels of the
database we can identify the right value for each
node, given the observations of RR and LL; 2) the
second learning strategy considers that some nodes
are non-observable (hidden) nodes. In this paper, the
nodes RR, LL and PVC are observable, while the
nodes Premature Beat and Ventricular Beat are non-
observable. The necessary information is provided
by the HMM-ECG system (Andreão, Dorizzi and
Boudy, 2006) and the cardiologist labels as well.
Since there are non- observable nodes in the second
strategy, the expectation-maximization learning
algorithm has been used to train the network based
on a training data set. For the first strategy the
classical junction-tree method (Pearl, 1988) was
adopted, which also maximizes the probability of the
observations given the model.
Table 1: Probability of PVC after a process of heuristic
learning.
PVC Probability
T 60%
F 40%
Table 2: Probability of Premature Beat and Ventricular
Beat after a process of heuristic learning.
PVC Prem.
Beat
% PVC Ventr.
Beat
%
F F 95% F F 95%
T F 5% T F 5%
F T 5% F T 5%
T T 95% T T 95%
3 RESULTS
All experiments have employed the MIT-BIH
database, which possesses forty eight sequences of
heart beats. However, only forty three of such
sequences were used here, because recorded
sequences containing pace beats or too much signal
amplitude distortion were removed.
The forty three sequences used were split in a
training set, which was used to adjust the parameters
of the Bayesian network, and a test set, necessary to
evaluate the performance of the trained network in
terms of PVC classification. The total number of
beats (normal and PVC) correspond to 95,257 beats,
where 64,074 beats were used for training and
31,183 were used for testing. It is important to
remark that the MIT-BIH database contains other
types of beats, which were considered as normal in
our experiments.
The Bayesian network was built using a
MATLAB toolbox called BNT (2002). The
Expectation Maximization and Junction Tree
learning algorithms were used to train the network.
The performance of the network is assessed in
terms of: 1) confusion matrix; 2) sensibility, here
understood as the capacity of the system to correctly
identify normal beats (true positives); 3) specificity,
here understood as the probability of classifying the
PVC beats (true negatives); 4) positive predictive,
which is the probability that an event detected as
normal effectively belongs to this class of beats; 5)
negative predictive, which is the probability that an
event detected as PVC effectively belongs to this
class of beats.
The first experiment evaluates the performance
of the network after manually estimating the
probabilities of each random variable based on the
training data set (a try-and-error methodology), as
Figure 5: Histogram of the RR interval of the Normal an
d
Premature beats. Two Gaussians functions are used to
approximate both histograms.
Figure 4: Histogram of the likelihood of the Normal an
d
Ventricular QRS complexes. Two Gaussian functions are
used to approximate both histograms.
CLASSIFICATION OF PREMATURE VENTRICULAR BEAT USING BAYESIAN NETWORKS
189

described in the previous section. The results
obtained for the test data set are in Table 3.
The second experiment considers the effect of
the learning-from-data step, which results in a better
modelling of the relationship among variables, for
which just observable nodes are considered. The
network parameters were adjusted based on the same
training data set, and the results for the same test
data set are shown in Table 4.
The third experiment also performs parameter
estimation through a learning strategy. However, in
this case, observable and non-observable nodes were
considered, for the same training data set used in the
previous experiments. The results for the same test
data set are shown in Table 5.
One can observe from Table 3 that the negative
predictive value is very low, showing that the PVC
detection provided by the system is not trustful
enough yet, since these type of beat has a probability
of just 32,34% of being the correct one. On the other
hand, the adoption of a learning-from-data step
improves significantly the system performance. This
means that the strategy to be adopted for estimating
the contribution of each variable requires some
knowledge about the other variables, which is
fulfilled by the training method adopted, as well as
means that the estimation of the parameters for each
variable independently is a quite poor strategy.
Table 3: Classification results for the Bayesian network
without the learning-from-data step.
Confusion Matrix
Classification
N
Classification
V
Label N
26.427 3.007
Label V
312 1.437
Sensibility
98,83%
Specificity
82,16%
Positive Predictive
89,78%
Negative Predictive
32,34%
Table 4: Classification results for the Bayesian network
after the learning from data step and considering only
observable nodes.
Confusion Matrix
Classification
N
Classification
V
Label N
29.244 190
Label V
388 1.361
Sensibility
98,69%
Specificity
77,82%
Positive Predictive
99,35%
Negative Predictive
87,75%
Table 5: Classification results for the Bayesian network
after the learning from data step and considering
observable and non-observable nodes.
Confusion Matrix
Classification
N
Classification V
Label N
29.344 90
Label V
358 1.391
Sensibility
98,79%
Specificity
79,53%
Positive Predictive
99,69%
Negative Predictive
93,92%
When comparing the two training strategies, one
can observe that the one with hidden nodes is
significantly better in terms of negative predictive (a
smaller number of false positive PVC beats has been
identified). The main reason for this improvement is
the inclusion of a certainty zone in the values of LL
and RR generated by the HMM-ECG system
(Andrião, Dorizzi and Boudy, 2006). Thus, the
hidden nodes have been left free to be estimated by
the learning method and, hence, a more appropriate
value is computed regarding the observed events.
Finally, the good results (see Table 5) obtained
confirmed that the Bayesian network is a powerful
tool to acquire knowledge from an available data set
labelled by an expert. Moreover, when used as a tool
for diagnostic aid it can indicate the degree of
certainty associated to each result, through using the
concept of probability.
In Christov et al (2006), the PVC wave is
classified using two approaches, knowing
Morphological Descriptors (MD) and Matching
Pursuits for extracting time-frequency beat
descriptors (TFD), and the result found for MD and
TFD were, respectively, 96,27% and 94,77% for
Sensibility; 99,13% and 99,08% for specificity;
89,87% and 89,19% for positive predictive and
finally 99,70% and 99,58% for negative predictive.
As a comparison, the Bayesian approach presents a
better result in terms of sensibility and predictive
negative. However, it is necessary to stress that in
Christov et al (2006) more than one channel is used,
while in this work it was used just one channel
(regarding the recorded ECG).
In the approach proposed by Andreão, Dorizzi
and Boudy (2006), the result for just one channel is
64.36% for Sensibility and 66.14% for Positive
Predictive. When using two channels, however, the
results are significantly improved: 87,20% for
Sensibility and 85,64 % for Positive Predictive
The performance of the Bayesian network for
only one channel has confirmed that the method is
HEALTHINF 2008 - International Conference on Health Informatics
190

suitable for the proposed application. Although the
performance is not yet as good as those of the best
systems, some improvements can be carried out in
the model, through the use of channel fusion.
4 CONCLUSIONS
For the first time this framework is employed in this
particular problem. The Bayesian network presents a
more comprehensive graphical representation, deals
with uncertainty through its probabilistic
representation, and can work with incomplete data
through its inference engine.
The capability of learning the network
parameters from a training data set was verified
using two training strategies, and the result is that
when working with non-observable nodes the
training method based on the EM algorithm
produces a better modelling of the uncertainty
related to the observed data and the labels defined by
a cardiologist.
Our future work will focus on evaluating the
performance of this system using a fusion strategy in
order to explore information obtained from multiple
channels. On the other hand, this network will be
extended to classify more arrhythmias, as ischemic
episodes.
We hope that this system can be further
developed and then implemented to assist an expert
in the analysis of such events in ECG signals.
ACKNOWLEDGEMENTS
This research has received financial support from
CAPES (a foundation of the Brazilian Ministry of
Education), CNPq (an agency of the Brazilian
Ministry of Science and Technology) and FAPES (a
foundation of the Secretary of Science and
Technology of the Government of the State of
Espirito Santo, Brazil).
REFERENCES
Andreão, R. V., Dorizzi B. and Boudy, J. (2006) ‘ECG
Signal Analysis Through Hidden Markov Models’,
IEEE Transactions on Biomedical Engineering, vol.
53, no. 8, August, pp. 1541-1549.
BNT, How to use the Bayes Net Toolbox (2002) viewed
06/07/2007 http://boole.cs.iastate.edu/book/1-
Science/1-ComputerScience/3-Paper/1-
AI/Bayesian/How%20to%20use%20the%20Bayes%2
0Net%20Toolbox.htm.
Buntine, W. L. (1991) ‘Theory Refinement on Bayesian
Networks’, Proceedings of the 7
th
Conference on
Uncertainty in Artificial Intelligence, 13-15 July,
1991, Morgan Kaufmann, Los Angeles, California, pp.
52-60.
Clarke, A. B. and Disney, R. L. (1970) Probability and
Random Processes for Engineers and Scientists, New
York: John Wiley & Sons, Inc.
Crawford M. H. et al. (1999) ‘ACC/AHA Guidelines for
Ambulatory Electrocardiography’, Journal of the
American College of Cardiology, vol. 34, no. 3, pp.
912-948.
Christov I. et al (2006), ‘Comparative study of
morphological and time-frequency ECG descriptors
for heartbeat classification’, Journal of Biomedical
Engineering, Medical Engineering & Physics’, vol 28,
no.7, pp. 876-887.
Farrugia S., Yee, H. and Nickolls, P. (1991) ‘Neural
Network Classification of Intracardiac ECGs’,
Proceedings of the IEEE and INNS Int. Joint Conf. on
Neural Networks, 18-21 November, 1991, Singapore,
pp. 1278-1283.
Gao, D. et al. (2005) ‘Bayesian ANN Classifier for ECG
Arrhythmia Diagnostic System: A Comparison Study’,
Proceedings of International Joint Conference on
Neural Networks, July 31 - August 4, 2005, Montreal,
Canada, vol. 4, pp. 2383-2388.
Kadish A. et al. (2001) ‘ACC/AHA Clinical Competence
Statement on Electrocardiography and Ambulatory
Electrocardiography’, Journal of the American
College of Cardiology, vol. 38, no. 7, pp. 2091-2100.
Kuppuraj, R. N. (1993) ‘A Neural Network System to
Classify Simulated ECG Rhythms’, Proceedings of the
IEEE Biomedical Engineering Conference, New
Orleans, Louisiana, USA.
Lauritzen, S. L. and Spiegelhalter, D. J. (1988) ‘Local
Computations with Probabilities on Graphical
Structures and their Application to Expert Systems
(with discussion)’, Journal of the Royal Statistical
Society Series B (Methodological), vol. 50, no. 2, pp.
157-224.
MIT-BIH Harvard-MIT Division of Health Sciences and
Technology Biomedical Engineering Center (1997)
‘Arrhythmia DataBase Directory’, viewed 06/07/2007,
http://www.physionet.org/physiobank/database/html/
mitdbdir/mitdbdir.htm.
Pearl, J. (1988) Probabilistic Reasoning in Intelligent
Systems: Networks of Plausible Inference, 2nd
printing, San Francisco: Morgan Kaufmann.
Shachter, R. D. (1986) ‘Evaluating Influence Diagrams’,
Operations Research, vol. 34, no. 6, December, pp.
871-882.
CLASSIFICATION OF PREMATURE VENTRICULAR BEAT USING BAYESIAN NETWORKS
191
