
HEALTHCARE RISK MODELING FOR MEDICAID PATIENTS
The Impact of Sampling on the Prediction of High-Cost Patients
Sai T. Moturu, Huan Liu
Department of Computer Science and Engineering, School of Computing and Informatics
Arizona State University, Tempe, AZ 85287
William G. Johnson
Center for Health Information & Research (CHiR), School of Biomedical Informatics
Arizona State University, Tempe, AZ 85287
Keywords: Predictive risk modeling, healthcare costs, high-cost patients, high-risk patients, non-random sampling,
over-sampling, under-sampling, imbalanced data, skewed data, Medicaid, data mining, classification.
Abstract: Healthcare data from the Arizona Health Care Cost Containment System, Arizona’s Medicaid program
provides a unique opportunity to exploit state-of-the-art data processing and analysis algorithms to mine
data and provide actionable findings that can aid cost containment. Our work addresses specific challenges
in this real-life healthcare application to build predictive risk models for forecasting future high-cost
patients. We survey the literature and propose novel data mining approaches customized for this compelling
application with specific focus on non-random sampling. Our empirical study indicates that the proposed
approach is highly effective and can benefit further research on cost containment in the healthcare industry.
1 INTRODUCTION
The Center for Health Information and Research
(CHiR) at Arizona State University houses a
community health data system called Arizona
HealthQuery (AZHQ). AZHQ contains
comprehensive health records of patients from the
state of Arizona linked across systems and time. The
data, which include more than six million persons,
offer the opportunity for research that can impact on
the health of the community by delivering actionable
results for healthcare researchers and policy makers.
One of the primary issues plaguing the
healthcare system is the problem of rapidly rising
costs. Many reasons have been put forward for the
consistent growth in health care expenditures
ranging from the lack of a free market and the
development of innovative technologies to external
factors like economy and population growth
(Bodenheimer, 2005). A first step to tackle these
issues is to devise effective cost containment
measures. One efficient approach to cost
containment is to focus on high-cost patients
responsible for these expenditures and undertake
measures to reduce these costs. Predictive risk
modeling is a relatively recent attempt at proactively
identifying prospective high-cost patients to reduce
costs. We embark on the challenging task of
building predictive risk models using real-life data
from the Arizona Health Care Cost Containment
System (AHCCCS), Arizona’s Medicaid program,
available in AZHQ. The AHCCCS data was selected
because it contains a large number of patients who
can be tracked over multiple years and it contains
many features needed for the analysis in this study.
Apart from data analysis challenges due to the
voluminous amount of patient records and the
considerable amount of variation for similarly
grouped patients, such cost data provides a bigger
challenge. It has been commonly observed that a
small proportion of the patients are responsible for a
large share of the total healthcare expenditures. This
skewed pattern has remained constant over many
decades. Previous studies show that more than two-
thirds of the health costs are from the top ten percent
of the population (Berk & Monheit, 2001). Similar
patterns are observed in our empirical study.
126
T. Moturu S., Liu H. and G. Johnson W. (2008).
HEALTHCARE RISK MODELING FOR MEDICAID PATIENTS - The Impact of Sampling on the Prediction of High-Cost Patients.
In Proceedings of the First International Conference on Health Informatics, pages 126-133
Copyright
c
SciTePress

Since a tiny percentage of patients create a large
portion of the impact, identifying these patients
beforehand would allow for designing better cost
containment measures. Early identification could
help design targeted interventions for these higher
risk patients who could then be part of more
effective, specially designed disease or case
management programs. Early identification could
help defer or mitigate extremely negative outcomes.
This approach also ensures that the different
players shaping the healthcare market be satisfied.
Insurers and employers who pay for the healthcare
costs would stand to gain considerably from reduced
costs. Employers in particular have an added
incentive as this would reduce other “indirect costs”
incurred due to the time taken by the patient to
return to work and the resulting loss of productivity.
Additional benefits for these players include better
return on investment due to an improvement in the
allocation of available resources and a basis for the
establishment of capitation reimbursements. On the
other hand, such an approach does not directly
impact providers and suppliers who provide services
to the patients. However, before achieving such
gains, the imbalanced nature of the data provides a
considerable challenge for accurate prediction.
As a part of this study, we propose a predictive
risk modeling approach to identify high-risk
patients. We use data mining and machine learning
techniques to design such an approach as they are
known to work well with large data and in particular
when the data collection has been automated and
performance takes precedence over interpretability
(Scheffer, 2002). Data mining has been successfully
used in the past for financial applications like credit
card fraud detection, stock market prediction, and
bankruptcy prediction (Zhang and Zhou, 2004).
Healthcare data provides a unique opportunity
for knowledge discovery using data mining while
also presenting considerable challenges. Despite the
success of data mining in various areas, it hasn’t
been regularly used to tackle these challenges
though limited examples exist (Anderson,
Balkrishnan, & Camacho, 2004; Cios & Moore,
2002; Li et al., 2005). We study the possibility of
applying data mining techniques to aid in healthcare
risk modeling, where we aim to forecast whether a
patient would be of high cost for the next year based
on data from the current year.
2 RELATED WORK
2.1 Learning from Imbalanced Data
Due to the existence of high-risk, high-cost patients
healthcare expenditure data is highly skewed. As a
result, it is essential to pay attention to the data
imbalance when dealing with such data. This is not
uncommon and has been observed in applications
like credit card fraud detection, network intrusion
detection, insurance risk management, text
classification, and medical diagnosis. The problems
of dealing with imbalanced data for classification
have been widely studied by the data mining and
machine learning community (Chawla, Japkowicz,
& Kolcz, 2004). Most classification algorithms
assume that the class distribution in the data is
uniform. Since the metric of classification accuracy
is based on this assumption, the algorithms often try
to improve this faulty metric while learning.
The two most common solutions to this problem
include non-random sampling (under-sampling or
down-sampling, over-sampling or up-sampling and a
combination of both) and cost-sensitive learning.
Both solutions have a few drawbacks (most
importantly, under-sampling might neglect few key
instances while over-sampling might cause
overfitting) but they have shown improvement over
conventional techniques (McCarthy, Zabar, &
Weiss, 2005; Weiss & Provost, 2001).
Various studies have compared over-sampling,
under-sampling and cost-sensitive learning. While
some found that there was little difference in the
results from these methods, others found one among
them to be the best. Results from different studies
are inconclusive in selecting the best among them
(Batista, Prati, & Monard, 2004; Drummond &
Holte, 2003; Maloof, 2003; McCarthy et al., 2005).
The use of a combination of under-sampling and
over-sampling has also been found to provide
improved results over the individual use of these
techniques. Additionally, it has be found using
varying ratios of the minority and majority classes
that the best results were generally obtained when
the minority class was overrepresented in the
training data (Estabrooks, Jo, & Japkowicz, 2004;
Weiss & Provost, 2001). The use of synthetically
generated instances for the minority class has also
been proposed (Chawla, Bowyer, Hall, &
Kegelmeyer, 2002) but the prudence of using this
technique for highly varied instances in healthcare
data needs to be evaluated.
Despite the reported success of these techniques
in other domains, none have been applied with
HEALTHCARE RISK MODELING FOR MEDICAID PATIENTS - The Impact of Sampling on the Prediction of
High-Cost Patients
127

respect to healthcare expenditure data in the past. In
this study, we explore the possibility of using non-
random sampling as a key element in creating
predictive models for identifying high-risk patients.
Preliminary work has confirmed the usefulness of
this approach (Moturu et al., 2007).
2.2 Techniques and Predictors
Healthcare data sets have been used in the past to
predict future healthcare utilization of patients where
the goal varied from being able to predict individual
expenditures to the prediction of total healthcare
expenditures. Typically, various regression
techniques have been employed in the past with
varying success for these tasks but the assumptions
of independence, normality and homoscedasticity
are not satisfied by the skewed distribution of the
costs. Regression techniques generally tend to
predict the average cost for a group of patients
satisfactorily but on an individual basis, the
predictions aren’t too accurate. Other approaches
include the transformation of the distribution to
match the assumptions of the analysis technique and
the use of the Cox proportional hazards model
(Diehr, Yanez, Ash, Hornbrook, & Lin, 1999).
Apart from these statistical methods, multiple
risk-adjustment models that can forecast individual
annual healthcare expenses are currently available.
These can be used to predict high-cost patients by
setting a cost threshold. Popular models including
Adjusted Clinical Groups (ACG), Diagnostic Cost
Groups (DCG), Global Risk-Adjustment Model
(GRAM), RxRisk, and Prior Expense show
comparable performance (Meenan et al., 2003).
The performance of predictive modeling
techniques is highly dependent on the data and
features used. Different sources have provided data
for the prediction of future utilization. Self-reported
health status information gathered from patients
using surveys has been used to predict medical
expenditures (Fleishman, Cohen, Manning, &
Kosinski, 2006) and group patients into cost
categories (Anderson et al., 2004). Unlike these
studies, our work employs administrative claims-
based data. For such data both demographic and
disease-related features have proven to be useful in
the past. Demographic variables like age have been
known to work well as predictors for expenditure.
Disease-related information in the form of
comorbidity indices has been used in the past as
predictors of healthcare costs and the use of both
inpatient and outpatient information was found to be
useful (Perkins et al., 2004). However, simple count
measures like number of prescriptions and number
of claims were found to be better predictors of
healthcare costs than comorbidity indices (Farley,
Harrdley, & Devine, 2006). Though the performance
of comorbidity indices might vary, disease-related
information is still a key predictor. Such information
from various utilization classes such as inpatient,
outpatient and pharmacy information has been used
in the past, either separately or together to predict
cost outcomes. Combining information from
different utilization classes has been found to be
useful (Zhao et al., 2005). In this study we use a set
of features similar to those that have proven useful
in the past together with data mining techniques that
haven’t been explored with respect to this area.
3 PREDICTIVE RISK
MODELING
3.1 Data and Features
The substantially large amount of data in AZHQ
necessitates the selection of a specific subset for
analysis. The requirement for a multi-year claims-
based data set representing patients of varied
demographics and containing disease-related
information from various utilization classes,
AHCCCS data is well-suited for risk modeling.
Despite being only a small part of AZHQ, AHCCCS
data provides a large sample size of 139039 patients.
2002
FEATURES
Demographic
Disease-related
C
L
A
S
S
2003
FE
A
TURES
Demographic
Disease-related
C
L
A
S
S
2004
FEATURES
Demographic
Disease-related
C
L
A
S
S
Trainin
g
Testin
g
Figure 1: Illustration of Training and
Test Data Sets
Four hundred and thirty seven demographic and
disease-related features, either categorical or binary,
were extracted from the original AHCCCS data. The
patients were categorized into the minority or rare
class (high-cost) and the majority class based on the
paid amount. Figure 1 depicts the structure of the
data and its division into training and test data. Since
the goal is to predict future healthcare costs, features
from one year and class from the following year
have been used together. Training data was
constructed with features from 2002 and class from
2003 while test data was constructed with features
from 2003 and class from 2004.
Figure 1: Ilustration of Training and Test Data Sets.
HEALTHINF 2008 - International Conference on Health Informatics
128

The demographic variables employed include
age category (ages in groups of five), gender, race
(Asian, Black, Hispanic, Native American, White
and Other), marital status (single, married, divorced,
separated and widowed) and county. Age and gender
have been included due to previous success while
race, location and marital status have been added as
they could impact both financial and health aspects.
We avoid comorbidity or multimorbidity indices
due to lack of flexibility. To allow the inclusion of
inpatient, outpatient and emergency department
information, International Classification of Diseases
(ICD) procedure codes have been further grouped
into twenty major diagnostic categories (MDC). For
pharmacy data, the classification has been derived
from the National Drug Code (NDC) classification
with 136 categories. The practice of discounting
billed charges in the healthcare industry requires that
the amounts paid for the services are used as
measures of costs rather than the amounts charged.
Payments are used in this study and we select two
different thresholds for the separation of high-cost
patients. These thresholds of $50,000 (954 or 0.69 %
high-cost patients) and $25,000 (3028 or 2.18%
high-cost patients) ensure that the resultant data is
sufficiently highly skewed.
3.2 Analysis
Knowledge discovery using data mining requires
clear understanding of the problem domain and the
nuances of the data. These are achieved in the
previous sections. Further, the analysis consists of
three major steps. The first step is data preprocessing
and is considered one of the most important parts of
data mining. This is followed by the application of
data mining techniques on training data to learn an
appropriate model. Finally, this model is evaluated
on test data using suitable evaluation metrics.
Training and test data are created in the data
preprocessing step with required features being
extracted from the data. The creation of a training
data set provides a major challenge. The large size
of the data makes the learning task tedious and
necessitates the sampling of instances to reduce size.
The nature of imbalanced data sets, which invariably
result in poor performance while using conventional
analysis techniques, needs to be taken into
consideration for the selection of appropriate
training instances. To address this challenge, non-
random sampling has been employed as a
combination of over-sampling the minority class and
under-sampling the majority class to create a
training sample. This approach is reasonable as it
has been employed successfully with such data in
the past. Though the use of an equal number of
training instances from both classes seems intuitive,
it has been suggested that a higher number of
instances from the minority class might improve
sensitivity (Weiss & Provost, 2001). We evaluate
this suggestion using multiple training samples with
varying proportions of the two classes.
The next step is the creation of predictive
models. We have preliminarily tested a variety of
popular classification algorithms to focus on the
challenge of learning from the training data. Out of
the algorithms tested, five have worked considerably
better. These include AdaBoost (with 250 iterations
of a Decision Stump classifier), LogitBoost (also
with 250 iterations of a Decision Stump classifier),
Logistic Regression, Logistic Model Trees, and the
Support Vector Machine (SVM) classifier.
Performance evaluation provides the final
challenge in our analysis. Since the data is highly
skewed, traditional measures like accuracy aren’t
particularly useful. We propose the following four
evaluation metrics to gauge performance:
• Sensitivity: Sensitivity corresponds to the
proportion of correctly predicted instances of
the minority class with respect to all such
instances of that class. It is equal to the number
of true positives over the sum of true positives
and false negatives.
FNTP
TP
T
N
N
N
S
+
=
• Specificity: Specificity corresponds to the
proportion of correctly predicted instances of
the majority class with respect to all such
instances of that class. It is equal to the number
of true negatives over the sum of true negative
and false positives.
FPTN
TN
P
NN
N
S
+
=
• F-measure: F-measure is typically used as a
single performance measure that combines
precision and recall and is defined as the
harmonic mean of the two. Here we use it as a
combination of sensitivity and specificity.
PT
PT
M
SS
SS
F
+
=
**2
•
G-mean: G-mean typically refers to geometric
mean and in this study it is the geometric mean
of sensitivity and specificity.
PTM SSG *=
HEALTHCARE RISK MODELING FOR MEDICAID PATIENTS - The Impact of Sampling on the Prediction of
High-Cost Patients
129
To evaluate the performance of predictive risk
models, it is necessary to understand the relevance
of their predictions. The identification of high-cost
patients allows for targeted interventions and better
case management. Therefore, identifying most of
these patients would prove useful. Such high
sensitivity is achieved with a corresponding decrease
in specificity, which is acceptable due to the cost
benefits from identifying a large percentage of the
high-cost patients. Consider the following example
of two predictive models created using non-random
and random sampling whose predictions are
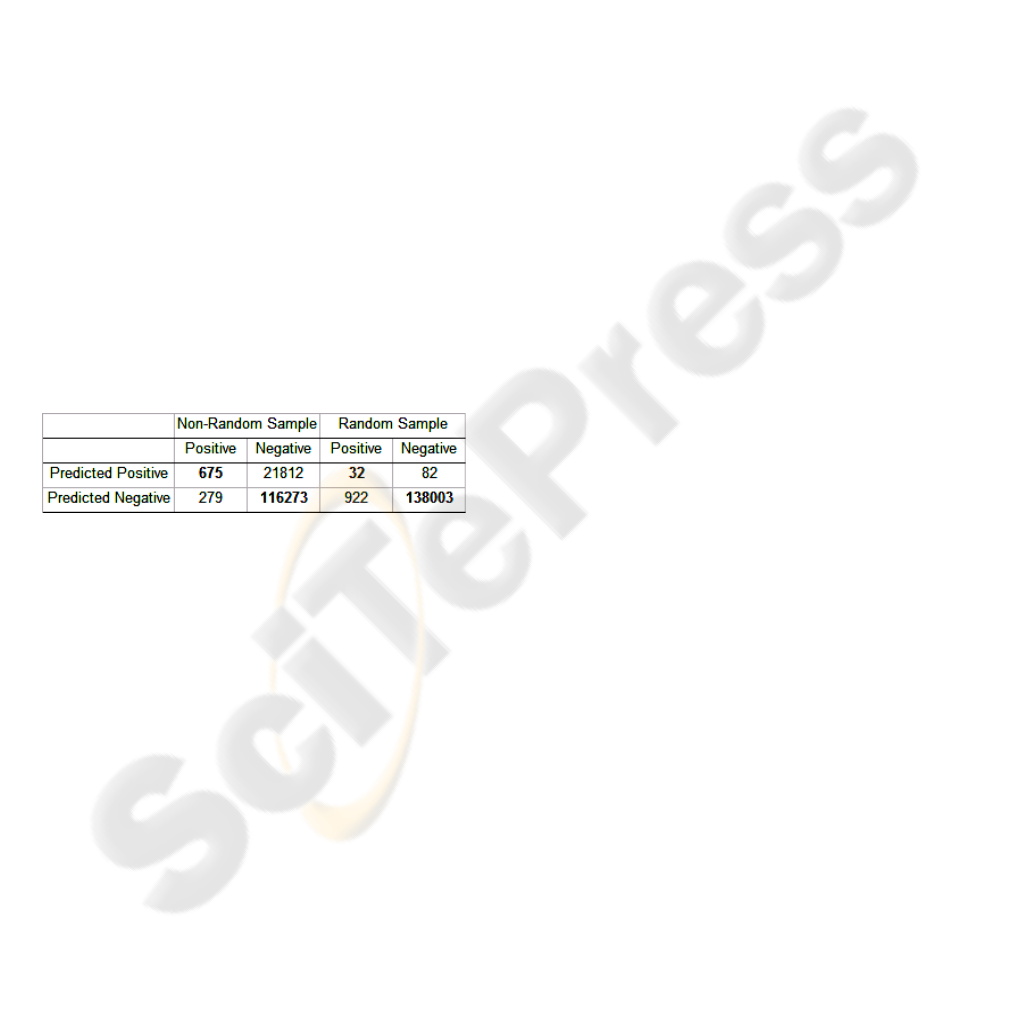
depicted through a confusion matrix in table 1.
Identifying a limited number of high-cost patients
(32 as opposed to 675) with greater prediction
accuracy means that a large percentage of high-cost
patients are unidentified and therefore a considerable
portion of the health and cost benefits are
unattainable. Alternatively holding targeted
interventions and providing effective disease
management for 22487 patients (675 correct and
21812 incorrect) could result in health benefits for
the actual high-risk patients and cost benefits for the
employers and insurers. This example indicates the
need for high sensitivity along with an acceptable
trade-off between specificity and sensitivity.
Table 1: Random vs. Non-random Sampling.
3.3 Predictive Modeling
Recall that our preliminary results indicate the
usefulness of non-random sampling for predictive
modeling. Further, we identified five classification
algorithms that show promise and delineated four
measures for performance evaluation considering the
imbalance of data. These elements set the stage for
an empirical study designed to markedly indicate the
usefulness of non-random sampling to our approach
for predictive modeling. Further, this sampling
technique is applied on suitably varied training data
samples. Additionally, two class thresholds are used
to check for the robustness of our approach to
differently skewed data sets. These experiments help
to provide a comparative outlook of our approach
and also indicate its benefits and flexibility.
4 EMPIRICAL STUDY
We first provide details of our experimental design
along with the software environment, algorithms and
then discuss experimental results.
4.1 Experimental Design
Employing the AHCCCS data as depicted in Section
3.1, we evaluate the predictions across an extensive
range of experiments. All experiments have been
performed using the Weka software (Witten &
Frank, 2005). Training data is created from the data
set with features from 2002 and class from 2003.
The model learned from this training data is used to
predict on the test data set with features from 2003
and class from 2004. Non-random sampling was
used to create training data as a default. The default
class threshold used was $50,000. For each
experiment, the five algorithms listed previously
have been used to create predictive models with a
goal of identifying the best one. The following
dimensions were used for comparison.
4.1.1 Random Versus Non-Random
Sampling
Experiments across this dimension were designed to
depict the differences in performance between the
sampling techniques. One set of experiments used
random sampling where 50% of the data was
randomly selected for training. Another set of
experiments used non-random sampling where the
minority class was over-sampled and the majority
class was under-sampled. Twenty different random
samples were obtained for both classes, with every
sample containing 1,000 instances. The resulting
training data sample contained 40,000 instances.
4.1.2 Varying Proportions of the Minority
Class Instances in the Training Data
These experiments were designed to evaluate the
differences of learning using non-randomly sampled
data with varied proportions of rare class instances.
Multiple training data sets were created with
proportions of instances from the minority class
being 10%, 25%, 40%, 60%, 75% and 90%.
Random samples of 1000 instances each were drawn
both classes according to the appropriate proportion
for that training data set. However, the total number
of instances was maintained at 40,000. For example,
the training set with 40% rare class instances had 16
random samples from that class resulting in 16,000
instances. Six different non-randomly sampled
HEALTHINF 2008 - International Conference on Health Informatics
130
training data sets were obtained in addition to the
existing one with equal instances from both classes.
4.1.3 Varying the Class Threshold
Two different thresholds ($50,000 and $25,000) for
the differentiation of high-cost patients have been
used for the various training data samples described
in Section 4.1.2 to assess whether our approach is
robust to variations along this boundary.
4.2 Results and Discussion
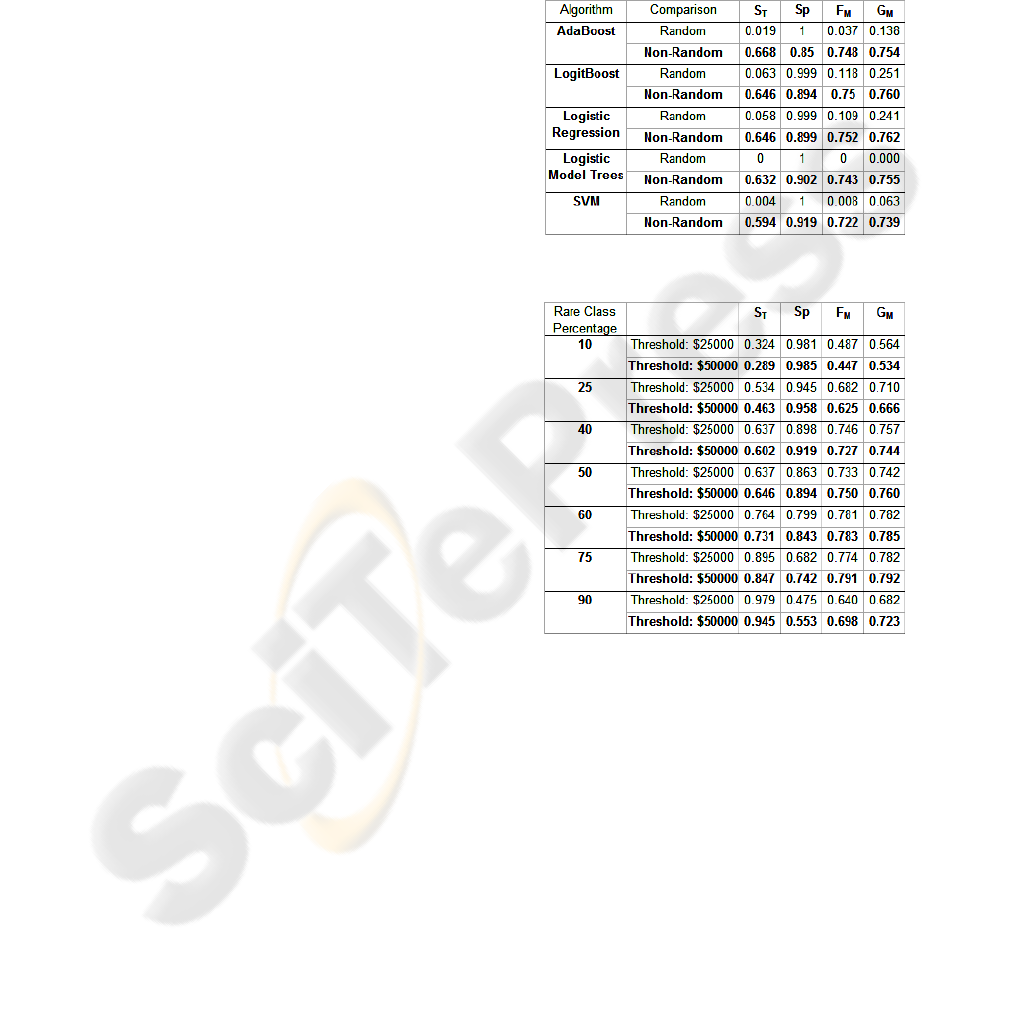
4.2.1 Importance of Non-Random Sampling
Both random and non-random samples are drawn
from the same data set to form training data in order
to build predictive models. The purpose of this
experiment is twofold: (1) to verify whether non-
random sampling is indeed necessary as suggested in
our preliminary analysis, and (2) to use a baseline to
compare predictions from the two techniques. It is
apparent from Table 2 that random sampling
provides very poor sensitivity with less than ten
percent of the high-cost patients identified correctly.
We can also consider a baseline model where
patients are predicted to be in the same class as they
were in the previous year. Such a model performs
better with a sensitivity of 0.276 and a specificity of
0.993 for this data set resulting in an F-measure of
0.432 and a G-mean of 0.524. The low sensitivity
indicates that not many high-cost patients remain in
that category the following year making predictive
modeling more difficult. Non-random sampling
shows a marked improvement but as one would
expect, this comes with a loss in specificity.
Nevertheless, the F-measure and G-mean are much
higher indicating that the trade-off between
sensitivity and specificity is better than the baseline.
These results clearly indicate the effectiveness of
non-random sampling for predictive modeling.
4.2.2 Classification Algorithm Performance
Five different classification algorithms were used to
learn predictive models across the experiments with
the purpose of identifying the best among them.
Recall that these algorithms were selected over
many other algorithms based on our preliminary
analysis. Results from Table 2 (and similar
comparisons in Section 4.2.3 as shown in Figure 2)
clearly indicate that these five algorithms perform
consistently well with very similar sensitivity and
specificity making it difficult to select the best one.
One can only conclude that any of these algorithms
could be used to learn a suitable predictive model
from a non-randomly sampled training data set.
Combining results in Section 4.2.1, we conclude that
all classification models perform similarly poorly or
well with random or non-random sampling. Hence,
non-random sampling plays an instrumental role in
significantly boosting performance.
Table 2: Random vs. Non-random Sampling.
Table 3: Varying class proportions in training data.
4.2.3 Using Varied Class Proportions
Using a higher proportion of minority class instances
in the training data sample is expected to improve
results (Weiss & Provost, 2001). Experiments were
designed to evaluate this expectation and this trend
is observed with our data as well. Table 3 depicts the
results for this comparison using the LogitBoost
algorithm. Using a higher proportion of minority
class instances in the sample (60% and 75%)
performs better than an equal proportion as indicated
by both the F-measure and the G-mean. A receiver
operating characteristics (ROC) curve can be
generated from these different proportions. Figure 2
depicts such a curve that provides a better visual
representation of the improvement in results. It has
to be noted that the two cases with improved results
HEALTHCARE RISK MODELING FOR MEDICAID PATIENTS - The Impact of Sampling on the Prediction of
High-Cost Patients
131
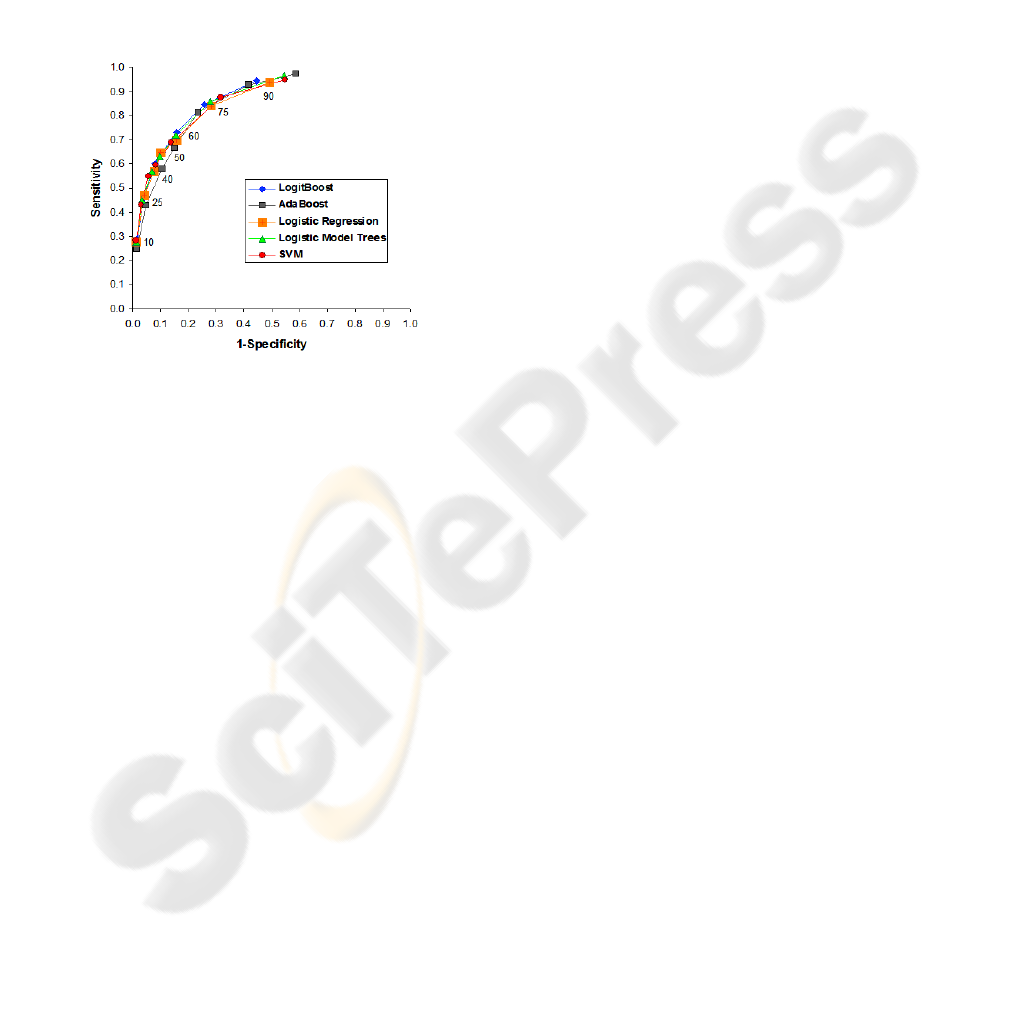
(60% and 75%) show a very different trade-off
between sensitivity and specificity despite similar
values for the F-measure and G-mean. Such an
observation indicates a unique opportunity to deal
with differences across the differently proportioned
samples. It is difficult to identify a suitable trade-off
without the availability of data that can establish the
cost benefits to be gained from a particular trade-off.
In such a scenario, such experiments can be
invaluable as they provide multiple trade-offs to
choose from. Upon the availability of information
about the cost benefits, the suitably proportioned
training data sample can be selected for analysis.
Figure 2: ROC Curve.
4.2.4 Varying the Class Threshold
Two thresholds for the differentiation of cost
categories have been used to indicate the robustness
of our approach to changes in class threshold. We
observe from Table 3 that results for both the
thresholds are comparable with the higher threshold
proving slightly better as indicated by F-measure
and G-mean. Since the training data is balanced by
non-random sampling, the slight underperformance
from the data with lower threshold could be due to
the fact that there are more patients closer to the
lower threshold, increasing the chance of an error in
prediction. This particular comparison serves to
indicate the adaptability of our approach while using
differently skewed data sets for predictive modeling.
5 CONCLUSIONS
Predictive risk modeling for forecasting high-cost
patients is an important area of research and this
study provides a look at a beneficial new technique
using a real-world data set. Results indicate that
creating training data using non-random sampling
helps balance the challenges resulting from the
skewed nature of healthcare cost data sets. Further,
over-representing the minority class in the training
data helps improve performance. Our study
manifests the significance of sampling in building
predictive risk models. However, it is hard to judge
the best trade-off between specificity and sensitivity
when there is no available data on the cost benefits.
In this sense, using varied proportions of instances
from the two classes in the training data can work as
a boon in disguise. When data on cost benefits is
available, one can test the use of different
proportions of instances from the two classes to
select the case with the best cost benefit. This makes
our approach for predictive modeling much more
adaptable.
Our comparison of classification algorithms for
this task indicates that all of the selected ones work
almost equally well. Though we find that it is hard to
choose between these algorithms, results indicate to
future users a handful of appropriate classification
techniques to be used along with non-random
sampling for predictive modeling. Our proposed
approach creates a model by learning from the data
and is therefore not restricted to the use of a specific
type of data or features. Further, the threshold for
high-cost patients is tunable and can be varied
depending on the goals of a particular study. All
these taken together signify the flexibility of
predictive risk modeling for future high-cost patients
using classification techniques to learn from non-
randomly sampled training data and the benefits that
can be obtained from such analyses.
Considering the variation in data, predictors
and evaluation metrics, comparison with previous
studies is improper, Nevertheless, the ROC curve in
Figure 2 is similar (the performance of the best
model is comparable) to that obtained for existing
risk-adjustment models (Meenan et al., 2003). The
numbers are also better (our results double the
sensitivity at about the same level of specificity)
than a decision-tree based predictive modeling
technique (Anderson et al., 2005). This validates the
usefulness of this technique that is further enhanced
by its flexibility. As can be observed, sampling is the
most important component of this technique and is
very beneficial for predictive modeling
Predictive risk modeling is a useful technique
with practical application for numerous employers
and insurers in the goal to contain costs. We provide
a promising approach that is valuable, flexible and
proven to be successful on real-world data.
Nevertheless, there is further scope to improve the
interpretation of these results. It is commonly
observed that a considerable percentage of high-cost
HEALTHINF 2008 - International Conference on Health Informatics
132

patients do not remain that way every year. Also,
two patients could share very similar profiles with
only one of them being high-cost. Studying these
seemingly anomalous patients could provide a better
understanding of how a high-cost patient is different
from other patients. In addition, the current sampling
approach and available classification techniques
could be further tuned to improve results.
Apart from these possibilities, the most
promising future direction is in working with key
data partners. This avenue provides the opportunity
to obtain information on the cost containment
methods used and their efficiency as well as real
data on the cost benefits obtained from previous
predictive models. Working with such partners, we
endeavor to provide a reasonable, patient-specific
answer to this question that would significantly
impact cost containment in the healthcare industry.
REFERENCES
Anderson, R.T., Balkrishnan, R., & Camacho, F. (2004).
Risk Classification of Medicare HMO Enrollee Cost
Levels using a Decision-Tree Approach. Am J
Managed Care, 10(2), 89-98.
Batista, G. E. A. P. A., Prati, R. C., & Monard, M. C.
(2004). A Study of the Behavior of Several Methods
for Balancing Machine Learning Training Data. ACM
SIGKDD Explorations Newsletter, 6(1), 20-29.
Bodenheimer, T. (2005). High and Rising Health Care
Costs. Part 1: Seeking an Explanation. Ann Intern
Med, 142, 847-854.
Berk, M. L., & Monheit, A. C. (2001). The Concentration
of Health Care Expenditures, Revisited. Health
Affairs, 20 (2), 9-18.
Chawla, N. V., Bowyer, K. W., Hall, L. O., &
Kegelmeyer, W. P. (2002). SMOTE: Synthetic
Minority Over-sampling Technique. Journal of
Artificial Intelligence Research, 16, 321-357.
Chawla, N. V., Japkowicz, N., & Kolcz, A. (2004).
Editorial: Special Issue on Learning from Imbalanced
Data Sets, ACM SIGKDD Explorations Newsletter,
6(1), 1-6.
Cios, K. J., & Moore, G. W. (2002). Uniqueness of
Medical Data Mining. Artificial Intelligence in
Medicine, 26(1-2), 1-24.
Diehr, P., Yanez, D., Ash, A., Hornbrook, M., & Lin, D.
Y. (1999). Methods For Analysing Health Care
Utilization and Costs. Ann Rev Public Health, 20, 125-
144.
Drummond, C., & Holte, R. C. (2003). C4.5, Class
Imbalance, and Cost Sensitivity: Why Under-
Sampling beats Over-Sampling. ICML Workshop
Learning From Imbalanced Datasets II, 2003.
Estabrooks, A., Jo, T., & Japkowicz, N. (2004). A
Multiple Resampling Method For Learning From
Imbalanced Data Sets. Computational Intelligence,
20(1), 18-36.
Farley, J. F., Harrdley, C. R., & Devine, J. W. (2006). A
Comparison of Comorbidity Measurements to Predict
Health care Expenditures. Am J Manag Care, 12, 110-
117.
Fleishman, J. A., Cohen, J. W., Manning, W.G., &
Kosinski, M. (2006). Using the SF-12 Health Status
Measure to Improve Predictions of Medical
Expenditures. Med Care, 44(5S), I-54-I-66.
Li, J., Fu, A. W., He, H., Chen, J., Jin, H., McAullay, D. et
al. (2005). Mining Risk Patterns in Medical Data. Proc
11
th
ACM SIGKDD Int’l Conf. Knowledge Discovery
in Data Mining (KDD’05), 770-775.
Maloof, M. (2003). Learning When Data Sets are
Imbalanced and When Costs are Unequal and
Unknown. ICML Workshop Learning From
Imbalanced Datasets II, 2003.
McCarthy, K., Zabar, B., & Weiss, G. Does cost-sensitive
learning beat sampling for classifying rare classes?
Proc 1
st
Int’l Workshop on Utility-based data mining
(UBDM ’05), 69-77.
Meenan, R. T., Goodman, M. J., Fishman, P. A.,
Hornbrook, M. C., O’Keeffe-Rosetti, M. C., &
Bachman, D. J. (2003). Using Risk-Adjustment
Models to Identify High-Cost Risks. Med Care,
41(11), 1301-1312.
Moturu, S.T., Johnson, W.G., & Liu, H. (2007). Predicting
Future High-Cost Patients: A Real-World Risk
Modeling Application. Proc IEEE International
Conference on Bioinformatics and Biomedicine 2007,
Accepted.
Perkins, A. J., Kroenke, K., Unutzer, J., Katon, W.,
Williams Jr., J. W., Hope, C. et al. (2004). Common
comorbidity scales were similar in their ability to
predict health care costs and mortality. J Clin
Epidemiology, 57, 1040-1048.
Scheffer, J. (2002). Data Mining in the Survey Setting:
Why do Children go off the Rails? Res. Lett. Inf.
Math. Sci., 3, 161-189.
Weiss, G.M., & Provost, F. (2001). The Effect of Class
Distribution on Classifier Learning: An Empirical
Study, (Dept. Computer Science, Rutgers University,
2001), tech report ML-TR-44.
Witten, I. H., & Frank, E. (2005). Data Mining: Practical
machine learning tools and techniques, 2nd Edition,
San Francisco: Morgan Kaufmann.
Zhang, D., & Zhou, L. (2004). Discovering Golden
Nuggets: Data Mining in Financial Application. IEEE
Trans. Sys. Man Cybernet., 34(4), 513-522.
Zhao, Y., Ash, A. S., Ellis, R. P., Ayanian, J. Z., Pope, G.
C., Bowen, B. et al. (2005). Predicting Pharmacy
Costs and Other Medical Costs Using Diagnoses and
Drug Claims. Med Care, 43(1), 34-43.
Zweifel, P., Felder, S., & Meiers, M. (1999). Ageing of
Population and Health Care Expenditure: A Red
Herring. Health Econ, 8, 485-496.
HEALTHCARE RISK MODELING FOR MEDICAID PATIENTS - The Impact of Sampling on the Prediction of
High-Cost Patients
133
