
MY-HEART PROJECT: ANALYSIS OF SLEEP AND STRESS
PROFILES FROM BIOMEDICAL SIGNAL
Sergio Cerutti, Anna M. Bianchi and Martin O. Mendez
Depertment of Bioingeneering, Polytechnic University of Milan, Piazza Leonardo da Vinci 32, Milan, Italy
Keywords: Wearable Device, Heart Rate Variability, Sleep, Autonomic Nervous System, Stress, Arousal,
Autoregressive Model, Hidden Markov Model.
Abstract: Advances in micro and nanotechnology, wireless technology, word-wide web networking, biomedical
digital signal processing, textile tissue and implantable devices, etc. have permitted the development of
alternative solutions for a better diagnosis of various pathologies, health care and prevention. These
advances allow the remote continuous monitoring of persons, whenever and wherever they are. My-Heart
FP6 EU Project integrates these components to develop a new concept of prevention and diagnosis for
cardiovascular diseases. The present paper will mainly focus on a Concept of the Project which is called
Take-Care and deals with the management, and integration of information for monitoring and personal
motivation in the health care environment & applications. In its main goal, Take-Care Concept allows the
learning in easy way about own self-body responses to different situations in the normal lifestyle: in
particular, it offers an evaluation of life quality from sleep performance and stress management based on an
integration of information between heart rate variability and respiration signals.
1 INTRODUCTION
My-Heart is a 6th Framework Programme EU
Integrated Project for fighting cardiovascular
diseases (CVD) by prevention and more objective
diagnosis based upon vital signs processing in
wearable devices. Cardiovascular diseases cause
50% of all deaths in the whole EU. It is well known
that a healthy and active life style can significantly
reduce the risk of cardiovascular diseases (primary
prevention) and limits the recurrence rate of acute
events (secondary prevention). Therefore, My-Heart
aims at creating smart electronic solutions and
appropriate services that empower users to take
more control of their own health. The project
addresses a spectrum of care, from prevention and
the adoption of a healthier lifestyle to chronic
disease management. The technological needs for
My-Heart applications range from vital sign
monitoring in daily life (ECG, respiration, skin
impedance, etc), to body-worn low-power devices
which run powerful and original detection
algorithms for health status and acute cardiac event
prediction, to low-power wireless links and server
architectures for data handling at professional sites.
Inside My-Heart project a Take-Care concept is
carried out that addresses people trying to find
support to develop a healthier lifestyle. Today more
and more people are facing problems: overweight,
inactivity, bad sleep and stress contribute to develop
cardiovascular diseases and are affecting millions of
European people.
Take-Care system provides people with a better
understanding of their overall health, motivating
them to become active in staying healthy and feeling
well. It is the ambition of Take Care to provide easy-
to-use technology and to develop solutions to
manage bad sleep, stress, inactivity and overweight.
For the sleep management solution the focus is
on analysing sleep stages and sleep fragmentation.
For stress solution the focus is on providing the user
a biofeedback tool to be used during relaxation
exercises to more objectively measure the effect of
the relaxation on the single subject.
In this context, the present paper describes the
procedures for the evaluation of sleep quality and for
stress management based on the analysis of the HRV
and respiration signals. The analysis is thought for a
device aimed to provide support to people who want
to develop a healthier lifestyle, with major focus on
cardiovascular disease prevention.
2 METHODOLOGY
Take-Care system (TCS) is integrated by different
modules. Each module is developed by taking into
account the analysis of a specific function. Sleep
273
Cerutti S., M. Bianchi A. and O. Mendez M. (2008).
MY-HEART PROJECT: ANALYSIS OF SLEEP AND STRESS PROFILES FROM BIOMEDICAL SIGNAL.
In Proceedings of the First International Conference on Health Informatics, pages 273-278
Copyright
c
SciTePress
fragmentation, sleep staging, obstructive sleep
apnoea and stress are the functions singled out inside
TCS. Firstly, a general scheme of TCS will be
presented. Then, in subsection 2.1, the basic
description of sleep fragmentation module is
presented. Sleep staging module will be the
argument of subsection 2.2. Sleep apnoea module is
presented in subsection 2.3 and finally subsection
2.4 concerns with relaxation and stress module.
The main goal of TCS project is to improve life
quality based on sleep performance. Sleep analysis
is carried out by assessing different
electrophysiological signals, which in general
require well trained and specialized personnel for the
signal interpretation and dedicated equipment. TCS
takes advantage from peripheral signals of easy
acquisition and sufficient signal to noise ratio. TCS
is concentrated in the analysis of surface electrical
activity of the heart (electrocardiogram, ECG), since
it exhibits high sensitivity to different
physiologic and pathologic behaviours, and
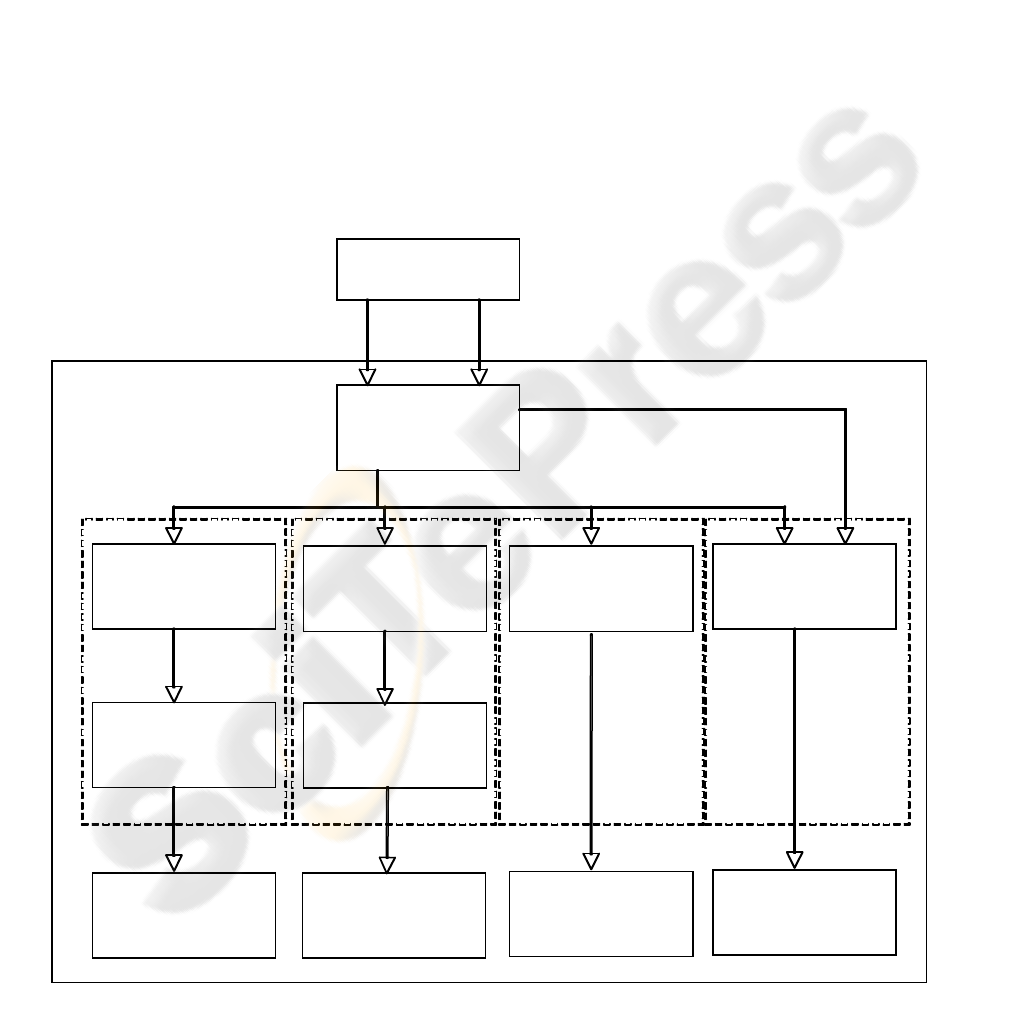
respiration. Figure 1 shows a TCS general scheme.
2.1 Sleep Fragmentation Module
Arousal from sleep (AS) has been one of the most
studied sleep phenomena related to sleep
fragmentation (SF). SF is associated with several
symptoms, ranging from somnolence, excessive
daytime sleepiness, impaired learning and memory
capabilities, up to much more severe consequences
such as cardiovascular diseases. When SF is
associated with sleep-disordered breathings, such as
obstructive sleep apnoea (OSA), there is high
likelihood to develop arterial hypertension and other
cardiovascular diseases.
AS is normally scored from either the central or
occipital leads of the electroencephalogram (EEG)
during standard polysomnographic studies. An AS
consists in “an abrupt shift in EEG frequency, which
may include theta, alpha and/or frequencies
Textile Technology
Pre-Processing
ECG
Respiration
Processing Processing
RR
Respirogram
Classification
Processing
Classification
Processing
Sleep Profile Apnea Profile
Index Sleep
Fragmentation
Stress Index
or
Relax level
Module
Sleep Staging
Module
Apnoea Detection
Module
Sleep
Fragmentation
Module
Stress
Figure 1: Take-Care System (TCS) scheme.
HEALTHINF 2008 - International Conference on Health Informatics
274
greater than 16 Hz but not spindles” (Atlas Task
Force, 1992). AS generates a typical waveform in
the heart rate (HR), which consists in an abrupt
increment of the HR, followed few seconds later by
a decrement in the HR (Sforza et al., 2000). Based
on this knowledge, a search algorithm was
implemented to identify the cortical arousal
projection into the heart rhythm. This algorithm
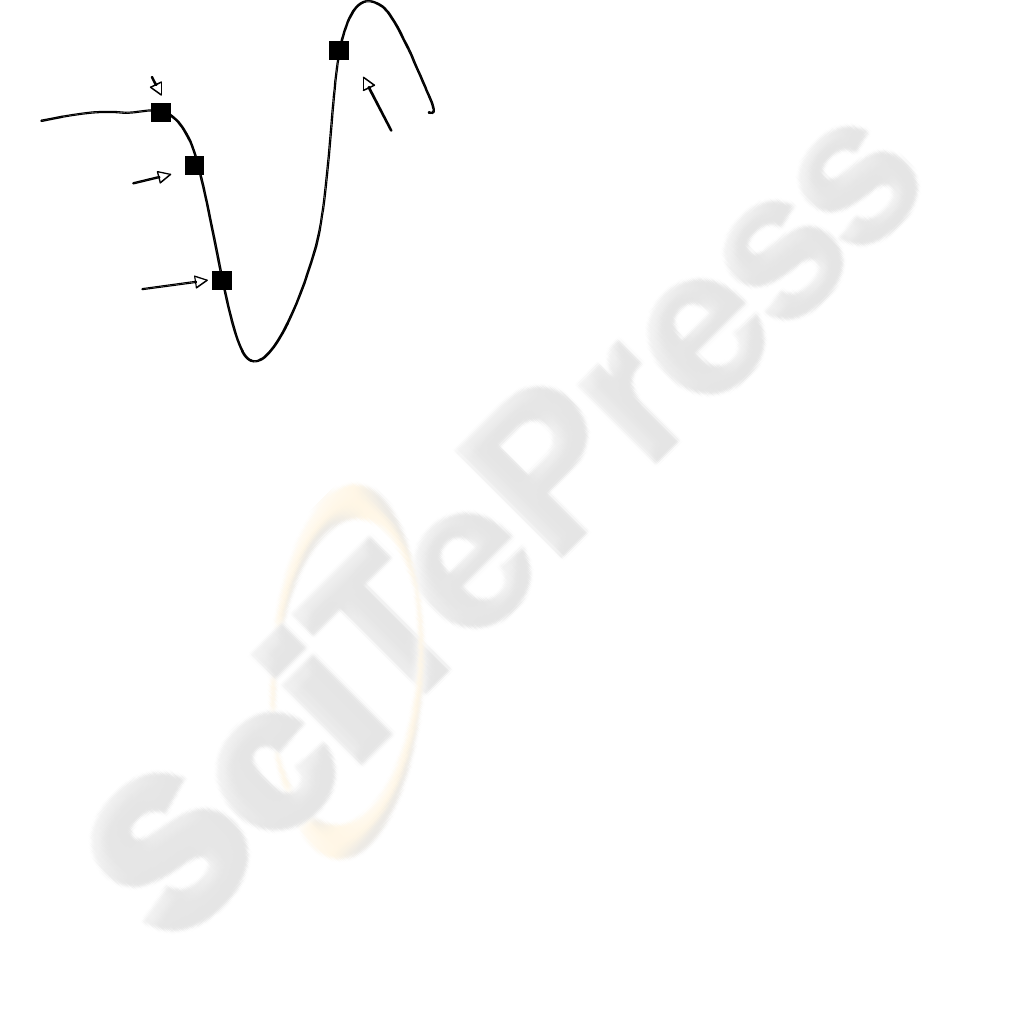
searches in the heart rate the pattern illustrated in
Figure 2.
Figure 2: Arousal detection from RR intervals.
At each beat, in this case called control value,
the algorithm observes if two and four beats later
there is a decrement in the HR, this decrement must
obey a predefined percentage. If this condition
exists, the algorithm moves ahead and tries to find a
HR value higher than the control one between the
beats 7 and 14. If this condition is present, then an
autonomic arousal is found and the process restart
20 beats later.
Sleep fragmentation is based on the number of
arousal episodes during the whole night. However,
the sleep process is affected in a different way if an
arousal episode occurs during the first or last
NREM-REM sleep cycle. A simple solution, that
respects the physiologic impact of an arousal during
the sleep process, is weighting differently arousal
events depending of the time in which these occur.
A proposed index (Sleep Fragmentation Index, SFI)
is considered by splitting the total sleep time into
three parts and is computed as follows:
SFI =3 * (#A’s in the first segment) + (#A’s in
the second segment) + 0.33 * (#A’s in the thir
d
segment)
(1)
Where #A is the number of arousals in a specific
time of the night. This equations gives high weight if
an arousal episode occurs during the first sleep hours
and less weight if it occurs during the last sleep
hours.
2.2 Sleep Staging Module
In the modern hospital Sleep Centers, the standard
sleep evaluation procedure consists in the
acquisition and analysis of three signals:
electroencephalogram, muscular activity and
electrooculogram. These signals present specific
changes in time that characterize six different stages:
wake, sleep stage 1, sleep stage 2, sleep stage 3,
sleep stage 4 and REM. However, sleep stages 1 to 4
present similar characteristics that allow to regroup
them all together in only one sleep stage, which is
labelled NREM. With standard leads, at peripheral
level, NREM and REM sleep present specific
patterns, that with some grade of confidence, are
significantly recognized. For instance, during
NREM, heart rate is stable, eyes do not present
movements, there is muscular tone and respiration is
regular and deep. In contrast, during REM sleep,
heart rate is instable, eyes present circular
movements, there is no muscular tone and
respiration exhibits instability (Guyton, 2000).
Therefore, appropriate mathematical tools of signal
processing and pattern recognition might possibly
identify NREM and REM sleep periods on the basis
of these characteristics.
2.2.1 Processing
This module is built up by two blocks. The first
block is processing, in which extraction of the
features that characterize REM and NREM sleep is
carried out. During sleep, HR presents different
behaviours as well as a series of non-stationarities.
These characteristics in HR during sleep require
necessarily the application of special mathematical
tools. Wavelets, time-frequency and time-varying
approaches have interesting properties to obtain the
spectral features of the HR in the most diverse
conditions. TCS uses a time-varying autoregressive
model to extract important spectral features of the
HR during sleep. The selection for this approach
resides in its characteristic of real-time processing,
high time and frequency resolution and very low
computational cost.
Figure 3 shows an example where sleep stage 2,
4 and REM are analysed in the frequency domain.
The power spectrum was obtained by a time varying
autoregressive filter, which evaluates beat by beat
the frequency content of a time series.
From a large amount of possible features to
classify REM and NREM sleep, TCS uses only four
features to discriminate between them:
Control
RR value
0.95 * RR
value 2
beats
later
0.9 * RR
value 4
beats
later
1.2 * RR
value
between
7 and 14
beats
later
MY-HEART PROJECT: ANALYSIS OF SLEEP AND STRESS PROFILES FROM BIOMEDICAL SIGNAL
275
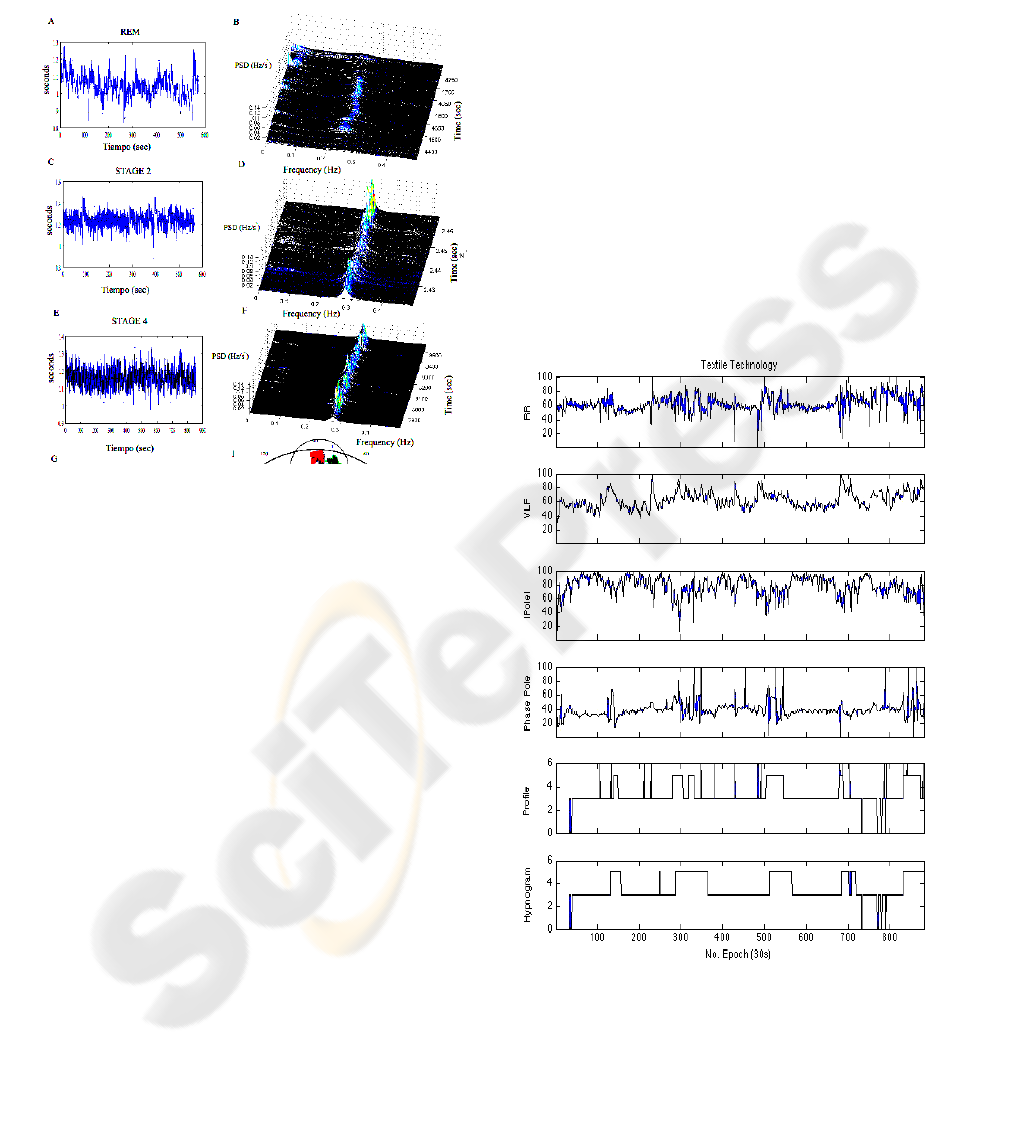
RR mean;
Very low frequency component in RR;
Modulus of the pole of the autoregressive
model in the high frequency component;
Phase of the pole of the autoregressive model
in the high frequency component.
Figure 3: Time-varying spectral analysis of RR series in
REM, stage 2 and stage 4 during sleep (A, C and E), with
the respective power spectral densities (B, D and F).
2.2.2 Classification
A Hidden Markov Model classifier (HMM)
integrates the second block, classification. HMM
was selected since this classifier takes into account
the temporal dynamic of a time series. This
characteristic is very important for this study, since
the length of the NREM-REM cycles varies in time.
Figure 4 present an example where the selected
features and the sleep profile are compared with the
clinical hypnogram. The sleep stages are defined as:
0 = wake, 3 = NREM and 5 = REM. The
classification was evaluated epoch by epoch of 30
sec according to the traditional clinical use.
2.3 Sleep Apnoea Module
Sleep apnoea is one the most common sleep
pathologies. Only in the USA, this pathology affects
sleep apnoea does not present evident symptoms,
most of the time, sleep apnoea is undiagnosed. Sleep
apnoea produces consequences that range from daily
somnolence to heart failure. Sleep apnoea is divided
into three different types: obstructive, central and
mixed. Obstructive apnoea is the most common
sleep pathology and with more severe consequences
and direct influences in the cardiovascular function.
Sleep apnoea is generated by an occlusion in the
upper airways, which does not permit the air to enter
to the lungs. Generally, this occlusion is produced
by an inadequate sympathetic activation, decrement
of the upper airways radio by obesity or exposition
to agents as smog. The duration of a single
obstructive apnoea episode is between 10 and 20
seconds. During this time, oxygen saturation
decreases and respiratory efforts begin to increase in
time in order to re-open the upper airways. If oxygen
level in the blood decreases in such a way that the
respiratory efforts are not enough to restore
respiration, the central nervous system produces an
arousal, which reactivates all the systems, and the
respiration is restored. This process could occur
hundreds of times during a single night: in this case
a bad sleep quality and cardiac consequences are
evidenced, giving as results social problems,
accidents and heart attacks (Young et al., 2002).
Figure 4: Example of NREM-REM classification by Take-
Care System. From the top to the bottom: RR intervals,
very low frequency power, module and phase of the pole
in high frequency, sleep profile evaluated by Take-Care
System and clinical hypnogram. The sleep stages are
defined as: 0 = wake, 3 = NREM and 5 = REM.
HEALTHINF 2008 - International Conference on Health Informatics
276
This process produces a defined brady-
tachycardia pattern in the heart rate. TCS explores
the feasibility for obtaining an alternative detector of
apnoeas using the same tools presented in the study
for sleep staging. As autoregressive models present
dedicated characteristic for evaluating features in
dynamic time series, it was implemented as feature
extractor. However, for a more correct detection of
apnoeas, some new features were explored: i.e., an
estimation of the respiratory effort was obtained
from the calculation of the area of the QRS
complexes. Correlation between both time series
was used in order to extract more robust features to
classify obstructive apnoea.
2.3.1 Processing
Also sleep apnoea module is built up from two
blocks. The processing bock helps to extract the
features that separate apnoea and non-apnoea
conditions. Again, an autoregressive model was used
to extract the features. However, each problem
requires the selection of its own features to solve it.
In this case, the set of features is formed by:
RR mean;
Very low frequency component in RR;
Very low frequency component in derived
respiratory signal from ECG;
Coherence between very low frequency
components of the two signals.
2.3.2 Classification
In this block a K-nearest neighbour classifier is used
to separate between apnoea and non-apnoea periods.
The classification is evaluated in a minute-by-
minute basis. From here it is possible to obtain an
estimate of the time that a person spends in apnoea
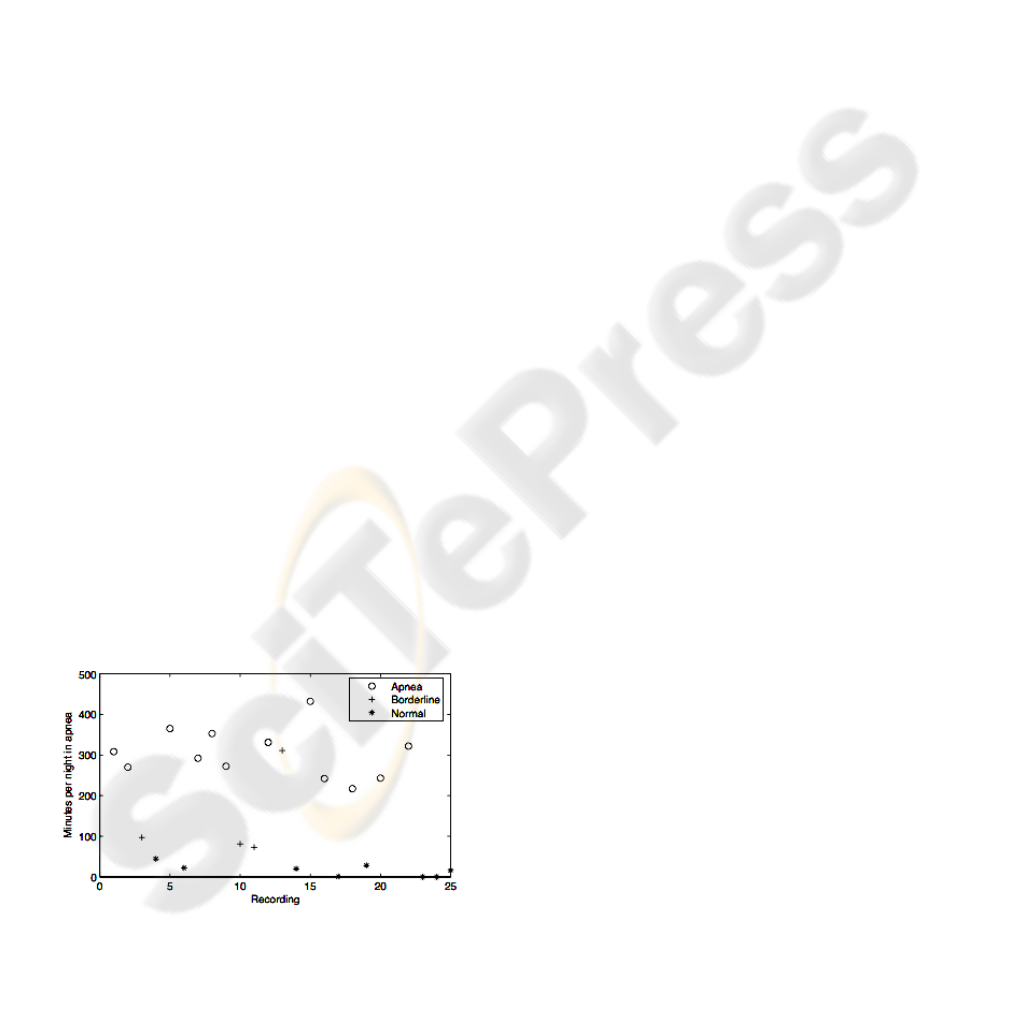
during the sleep time. Figure 5 shows an example of
sleep apnoea classification for 25 subjects.
Figure 5: Class separation based on minutes per night
calculated by the KNN classifier processing 4 features for
25 recordings of the testing group. Note that applying a
threshold of 50 minutes per night, apnoea and normal
classes are accordingly separated.
2.4 Stress Module
The stress concept employs a sensorised T-shirt
which allows the continuous recordings of ECG and
respiration. Previously, the subject is asked to fill in
a questionnaire which allows to detect his/her level
of stress, according to a clinical classification score
(APA, 1994). A kind of personalised initial level of
stress is hence obtained (IS). Then, according to the
instructions delivered from the computer, the subject
makes a rest-to-stand manoeuvre (from sitting to a
standing position) which indicates the degree of
responsiveness to a predominantly sympathetic
stimulation.
Then, according to the computer indications, the
subject makes some relaxation exercises, which
consist in deep regular respirations cycles, trying to
“synchronise” as much as possible cardiorespiratory
activity. On the basis of Heart Rate Variability
parameters (HRV) and respiration, as well as on
bivariate magnitudes calculated from the signals, it
is possible to measure the personalised physiological
effects of training sessions after days or weeks of
treatment and hence to re-position the subject
possibly in another location of the stress level plane
which started from IS.
It is advised that the subject could do this
exercise on a regular base (i.e. once per day) and
hence there is the possibility to monitor his/her level
of stress from the responses of his/her vital signs.
After a proper coaching it is believed that through
such exercises the subject could monitor his/her
level of stress and these objective measurements
could be important elements for helping physicians
in a better diagnosis and treatment follow-up of
stress related cardiac pathologies.
3 CONCLUSIONS
Take Care Concept has developed original
applicative tools, implemented through advanced
technological implementations (textiles,
microelectronics storing and controlling devices,
modern wireless communication protocols, etc) in
order to provide a precious instrument of prevention
of cardiovascular pathologies. The basic philosophy
is to detect from subject’s vital signs physiological
and clinical parameters even in continuous
recordings, by employing easy-to-use wearable
devices which allow comfortable home or
ambulatory applications.
MY-HEART PROJECT: ANALYSIS OF SLEEP AND STRESS PROFILES FROM BIOMEDICAL SIGNAL
277

REFERENCES
Atlas Task Force of American Sleep disorders Association
1992. EEG arousal: scoring rules and examples. Sleep
15: 174-184.
Sforza E., Jouny C., Ibanez V., 2000. Cardiac activation
during arousal in humans: further evidence for
hierarchy in the arousal response. Clin Neurophysiol
111:1611-1619.
Guyton AC., 2000. Textbook of medical physiology, W.B.
Saunder Company10
th
edition.
Young T., Peppard PE., Gottlieb DJ., 2002. Epidemiology
of obstructive sleep apnea. Am J REspir Crit Care
Med. 165:1217-1231.
American Psychiatric Society (APA) , 1994. Diagnostic
and Statistical Manual of Mental Disorders IV
(DSMIV). American Psychiatric Society. Washington,
DC, 4
th
edition.
HEALTHINF 2008 - International Conference on Health Informatics
278
