
PROBABILISTIC WORKPSACE SCAN MODES OF A ROBOT
MANIPULATOR COMMANDED BY EEG SIGNALS
Fernando Alfredo Auat Cheeín, Fernando di Sciascio, Ricardo Carelli
Institute of Automatic, National University of San Juan, Av. San Martin 1109-Oeste, San Juan, Argentina
Teodiano Freire Bastos Filho
Electrical Engineering Department, Federal University of Espírito Santo, Av. Fernando Ferrari 514, Vitória, ES, Brazil
Keywords: Brain Computer-Interface, Robot Manipulator, Probabilistic Scan Mode.
Abstract: In this paper, probabilistic-based workspace scan modes of a robot manipulator are presented. The scan
modes are governed by a Brain Computer Interface (BCI) based on Event Related Potentials
(Synchronization and Desynchronization events). The user is capable to select a specific position at the
robot’s workspace, which should be reached by the manipulator. The robot workspace is divided into cells.
Each cell has a probability value associated to it. Once the robot reaches a cell, its probability value is
updated. The mode the scans are made is determined by the probability of all cells at the workspace. The
updating process is governed by a recursive Bayes algorithm. A performance comparison between a
sequential scan mode and the ones proposed here is presented. Mathematical derivations and experimental
results are also shown in this paper.
1 INTRODUCTION
Brain Computer Interfaces have got a great impulse
during the last few years. The main reasons for this
growing are the availability of powerful low-cost
computers, advances in Neurosciences and the great
number of people devoted to provide better life
conditions to those with disabilities. These interfaces
are very important as an augmentative
communication and as a control channel to people
with disorders like amyotrophic lateral sclerosis
(ALS), brain stroke, cerebral palsy, and spinal cord
injury (Kubler et al.,2001, Wolpaw et al., 2002).
The main point of a BCI is that the operator is
capable to generate commands using his/her EEG
(electroencephalographic) signals in order to
accomplish some specific actions (Wolpaw et al.,
2002, Lehtonen, 2003, Felzel, 2001, Millán et al.,
2003). Thus, an operator using a BCI can control,
for example, a manipulator, a mobile robot or a
wheelchair (amongst other devices) without using
any muscle. The EEG frequency bands have enough
information to build an alphabet of commands in
order to control/command some kind of electronic
device (Ochoa, 2002). In this paper a BCI, which is
controlled through alpha waves from the human
brain, is used. Although the EEG signal
acquisition/conditioning, which is part of this BCI,
was developed in other work of the authors (Ferreira
et al., 2006), one of the objectives of this paper is to
illustrate its versatility, mainly in terms of the simple
algorithms used.
Event related potentials (ERP) in alpha
frequency band are used here. Such potentials are
ERD (Event Related Desynchronization) and ERS
(Event Related Synchronization), well described in
the following sections. This BCI has a Finite State
Machine (FSM) which was tested in a group of 25
people.
The main contributions of this paper are the scan
mode algorithms proposed to allow the user to
command a manipulator (Bosch SR-800), based on a
probabilistic scan of the robot’s workspace. The
workspace is divided into cells. Each cell contains
three values: its position
),( yx at the robot’s
workspace plane and a probability value. This value
indicates the accessibility of that element. Once a
particular cell is accessed, its probability is updated
based on Bayes’ rule.
3
Alfredo Auat Cheeín F., di Sciascio F., Carelli R. and Freire Bastos Filho T. (2008).
PROBABILISTIC WORKPSACE SCAN MODES OF A ROBOT MANIPULATOR COMMANDED BY EEG SIGNALS.
In Proceedings of the First International Conference on Biomedical Electronics and Devices, pages 3-8
DOI: 10.5220/0001048400030008
Copyright
c
SciTePress
This paper is organized as follows: a brief
description of the sequential scan mode of the
manipulator’s workspace is presented in section 2.
The probabilistic scan modes proposed are shown in
Section 3. Section 4 shows the results for a
Montecarlo experimentation, where the probabilistic
evolution of the whole workspace and of a specific
cell is presented. Section 5 shows the conclusions of
this work.
2 SEQUENTIAL SCAN MODE
As a brief introduction, the sequential scan mode of
the robot workspace developed in Ferreira et al.
(2006) is presented here.
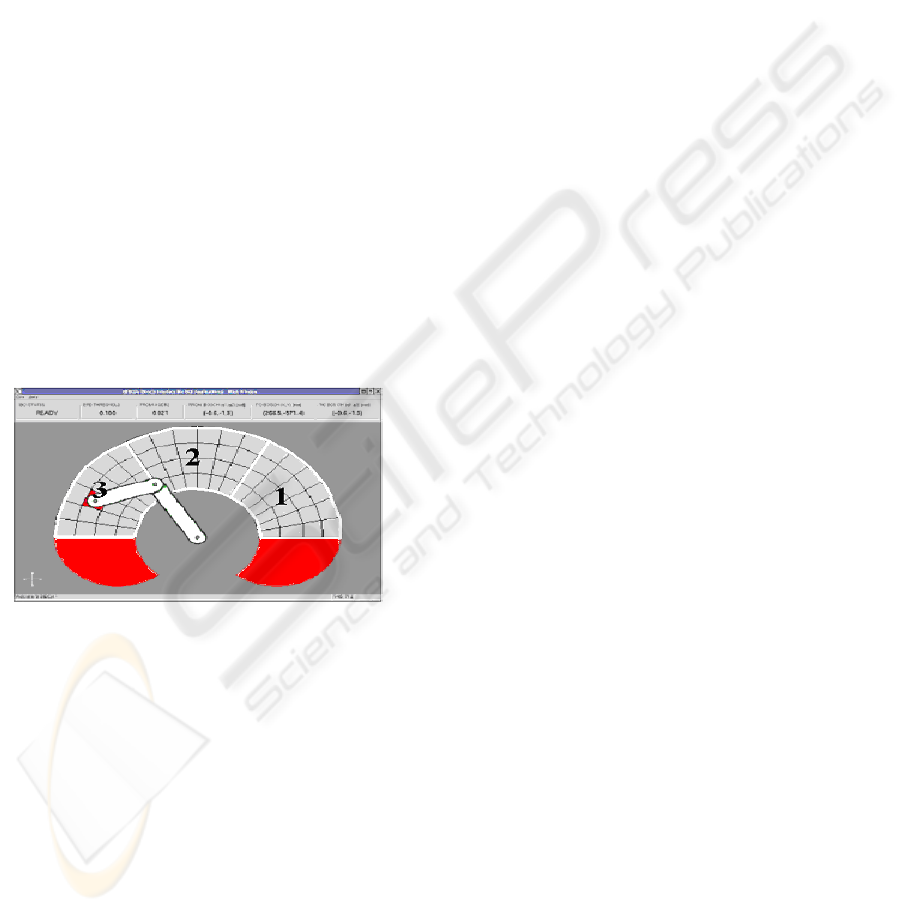
The workspace is previously divided into three
main zones as it can be seen in Fig. 1. The system
iteratively scans from zone 1 to zone 3 until one of
them is selected by the user (using EEG signals).
Once it is so, the selected zone is scanned row by
row until one is selected. Once a row is selected, the
system scans cell by cell (switching columns)
iteratively inside the selected row. After a cell is
selected by the user, the robot reaches the position
given by that cell.
Figure 1: Main zone division at robot’s workspace.
3 PROBABILISTIC SCAN
MODES
The two probabilistic scan modes shown in this
paper are based on Bayes rule for updating
probability values of the cells at the manipulator’s
workspace. The scan modes are shown in the
following sections.
3.1 First Approach of a Probabilistic
Scan Mode
The first approach of a probabilistic scan mode
works as follows:
1. The workspace’s resolution is set to 72 cells and
can be easily changed, decreasing or increasing
this number. The workspace behaves as a pmd
(probabilistic mass distribution).
2. Each cell has its own initial probability. This
value can be previously determined by some
heuristic method (for example: if the BCI
operator is right-handed, then cells to the right of
the workspace will have higher accessing
probability than the ones to the left). However, it
is also possible to set all cells to a probability
near zero, in order to increase or decrease them
depending on the times they are accessed by the
user. In this work, the first case was adopted.
3. Let a and b be the higher and lower probabilities
cells respectively. Then, the workspace is divided
into three zones according to these values. Table
1 shows how division is made. Let
)|( GCP
i
be
the probability of cell
i
C given a group G to
which it belongs.
4. Every zone at the workspace is divided in three
sub-zones under the same philosophy presented
before. Each one of these sub-zones contains a set
of probabilistic weighted cells.
5. The scan mode proceeds as follows:
I. First, the zone with the highest probability
value at the workspace is highlighted. If that
zone is not selected by the operator, the
second highest probabilistic zone is
highlighted. If it is not selected, the highlight
passes to the third and last zone. The scan
keeps this routine until a zone is selected.
II. When a zone is selected, the highlight shows
first the sub-zone with the highest probability
inside the zone previously selected. The scan,
in this case, is exactly the same used in the
last step.
III. When a sub-zone is selected, then the scan
highlights first the cell with the highest
probability of occupancy. If it is not selected,
the scan passes to the next cell value. This
routine keeps going on until a cell is selected.
Once a position is selected, the probability
value of the cell, sub-zone, zone and complete
workspace is updated. The update of the
probabilities values is made by the Bayes’
rule.
As it can be seen, the number of cells that belong to
a sub-zone or a zone is variable. Then, the
organization of the zones at robot’s workspace is
dynamic. This allows improving the scan mode in
BIODEVICES 2008 - International Conference on Biomedical Electronics and Devices
4
order to access in a priority way to the most
frequently used cells.
The probability update of each cell at the
workspace is based on the recursive Bayes’ rule.
Once a cell is reached by the user, its probability
value changes according to (1).
Table 1: Workspace’s Zones Definitions.
a
highest probability cell
value
b
lowest probability cell
value
⎭
⎬
⎫
⎩
⎨
⎧
≤<−+ aGCPbabc
ii
)|()(
3
2
:
zone 1: the set of all
cells which
probabilities are the
highest of the
workspace
⎪
⎪
⎭
⎪
⎪
⎬
⎫
⎪
⎪
⎩
⎪
⎪
⎨
⎧
−+≤
≤<
−
+
))(
3
2
(
)|()
3
)(
(:
bab
GCP
ba
bc
ii
zone 2: the set of all
cells which
probabilities are of
middle range
⎭
⎬
⎫
⎩
⎨
⎧
−
+≤≤ )
3
)(
()|(:
ba
bGCPbc
ii
zone 3: the set of all
cells with the lower
probability of the
workspace.
Let C be any cell at robot’s workspace and G a set
to which that cell belongs. Thus, the updating
algorithm is given by,
)|()|()|()|(
)|()|(
)|(
11
1
GCPCGPGCPCGP
GCPCGP
GCP
kkkk
kk
k
−−
−
+
=
(1)
Though (1) is mainly used in very simple
applications (Thrun et al., 2005), it fits as an
updating rule for the purpose of this work.
Equation (3) can be re-written in (4), where a
scale factor was used.
)|()|()|(
1
GCPCGPGCP
kkk −
=
η
(2)
According to the Total Probability Theorem (Thrun
et al., 2005),
η
is the scale factor, which represents
the total probability of
)(GP . In (1),
)|(
1
GCP
k −
is the
prior probability of a cell given the primary set to
which it belongs at time
1−k .
)|( CGP
k
is the
transition probability which represents the
probability that a given cell C belong to a set G.
Finally,
)|( GCP
k
is the posterior probability -at
instant k- of the cell used given the zone to which it
belongs.
In order to make sense to the use of the recursive
Bayes algorithm, an initial probability value must be
given to all cells at the workspace.
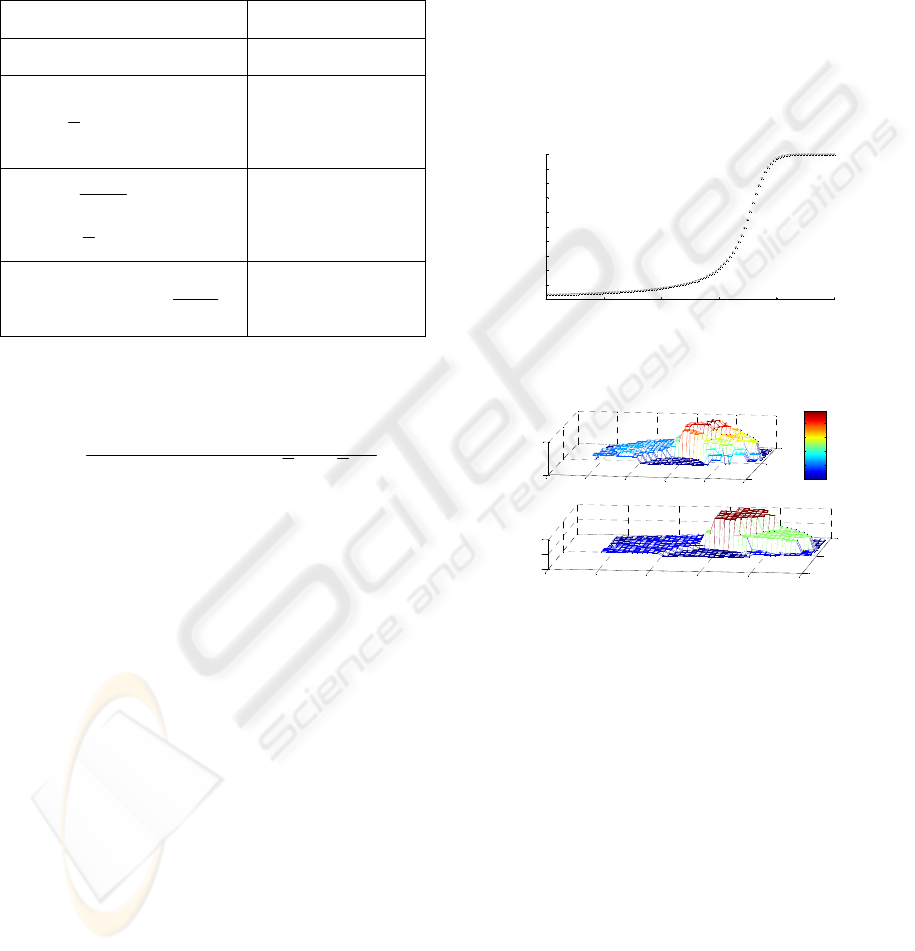
Figure 2 shows the evolution of a cell’s
probability when it is accessed successively by the
user.
The cell used in Fig. 2, for example, has an
initial value of 0.05 but it is increased each time the
cell is accessed by the user. As was expected, the
maximum value a cell can reach is one. When this
situation occurs, the whole workspace is scaled. This
scaling does not change the scan mode because the
relative probability information remains without
changes, i.e., if a cell p has the maximum probability
over all cells, after scaling, p will continue being the
cell with the highest weight. A more extended
development of this algorithm can be seen at
Papoulis (1980). Once the updating algorithm is
complete, the scan algorithm is released as described
in Section 3.
0 20 40 60 80 100
0
0.1
0.2
0.3
0.4
0.5
0.6
0.7
0.8
0.9
1
Probability Cell evolution
Numbers of iterations
Cell Probability Value
Figure 2: Evolution of Cell’s probability when
successively accessed.
0
10
20
30
40
50
0
20
40
0
0.5
Probability values of the workspace's cells
Prob abi li t y
0
10
20
30
40
50
0
20
40
0
0.5
1
Workspace primary zones
0
0.1
0.2
0.3
0.4
a)
b)
Figure 3: Probabilistic distribution of a workspace for a
right-handed user.
Figure 3 shows the workspace’s pmd for a right-
handed user. Fig. 3.a shows the cells probability’s
value and Fig. 3.b shows the different zones of the
manipulator’s workspace.
3.2 Second Approach
This second approach investigated in this work is
based on the sequential scan mode algorithm. Each
zone or sub-zone -as those shown in Fig. 1- has a
probability value associated with it. As the
workspace is considered as pmd then each zone or
sub-zone’s probability value is calculated as the sum
of all probability values of the cells that belong to
that group. The scan mode proceeds as follows:
1.
The zone with the highest probability is
highlighted first; then, the second higher
PROBABILISTIC WORKPSACE SCAN MODES OF A ROBOT MANIPULATOR COMMANDED BY EEG SIGNALS
5

probability zone is highlighted and then the last
zone (see Fig. 1). The highlighting process
repeats until the user chooses a zone.
2.
Once a zone is chosen, the row with the highest
probability -inside that zone- is highlighted. A
row of a zone is known as sub-zone. If this sub-
zone is not selected by the user after a period of
time, the highlight passes to the next higher
probability value row. This process is repeated
iteratively until a row is selected by the user.
3.
Once a sub-zone is chosen, the cell with the
highest probability of that sub-zone is
highlighted. If it is not chosen after a period of
time, the highlight passes to the next higher
probability cell. The process continues and if no
cell is chosen, it starts from the beginning cell.
4.
If a cell is chosen, then its probability is updated
according to the Bayes rule (Eq. 3). Then,
workspace pmf, sub-zone’s probabilities and all
zone’s probabilities are also updated.
The sampling time used in all scan modes is the
same one used in Ferreira et al. (2006).
4 EXPERIMENTAL RESULTS
This section is entirely dedicated to compare the
three scan types: sequential and probabilistic ones.
For this purpose, a Montecarlo experiment was
designed (Ljung, 1987). This experiment shows the
performance of the three methods by measuring the
time needed to reach different cells at the robot’s
workspace.
4.1 Montecarlo Experiment
The robot’s workspace consists of 72 cells. It also
can be considered as a
184
×
matrix. According to
this, a cell’s position is defined by a number of row
and a number of column at that matrix. The number
of a row and a column can be considered as a
random variable. To generate a random position of a
cell destination, the following algorithm was
implemented.
i.
An uniform random source generates two
random variables:
x
and y .
ii.
The random variable
x
is mapped into the
rows of the
184×
matrix workspace.
iii.
The random variable y is mapped into the
columns of the
184×
matrix workspace.
iv.
When a position is generated, both scan
types begin. The time needed to reach the
cell is recorded.
v.
After the system reaches the position
proposed, a next process point generation is
settled -the algorithm returns to point i-.
4.2 Mapping Functions
Let
x
f be a mapping function such as:
mx
BAf
x
→
→
:
where,
[
)
{
}
{}{}
⎩
⎨
⎧
ℵ⊂∈=
ℜ⊂∈=
4,3,2,1:
1,0:
mmB
xxA
(3)
and let
y
f
be another mapping function such as:
ny
CAf
y
→
→
:
where,
[
)
{
}
{}{}
⎩
⎨
⎧
ℵ⊂∈=
ℜ⊂∈=
18,...,3,2,1:
1,0:
nnB
yyA
(4)
Equations (3) and (4) show the domain and range of
the mapping functions. Finally, the mapping is made
according to the following statements.
i.
Let
δ
be the sum of all weights at robot’s
workspace, that is,
∑∑
∈∈
=
BiCj
ij
P
δ
, where
ij
P
is
the probability value of a cell located at the
rowi
−
and columnj
−
.
ii.
Let Ax
∈
be an outcome of the uniform
random source for
x
f .
If
δ
∑
∈=
<≤
Cji
ij
P
x
,1
0
then
1)( == ixf
x
. This
means that the value of
Ax ∈ should be
lower than the sum of all cell’s values in row
one -over
δ
- to )(xf
x
be equal to one.
If
δδ
∑
∑
∈=∈=
<≤
Cji
ij
Cji
ij
P
x
P
,2,1
then
2)( == ixf
x
.
This means that
Ax
∈
should be greater or
equal to the sum of all cell’s values in row
one and lower than the sum of all cell’s
values in row 2.
The same process continues up to the last
row, whose expression is: if
δδ
∑
∑
∈=∈=
<≤
Cji
ij
Cji
ij
P
x
P
,4,3
then
4)( == ixf
x
.
Each time a cell is selected, the mapping
functions vary. It is so because they are
BIODEVICES 2008 - International Conference on Biomedical Electronics and Devices
6
dependent with the probability value of the
cells.
For the mapping over the columns, the
procedure is the same, however in this case,
the sum is made over the set B (four rows).
Concluding, the mapping presented here is dynamic
because it is updated each time a cell varies its
probability value. For the case implemented in this
work (a right-handed user) the initial mapping
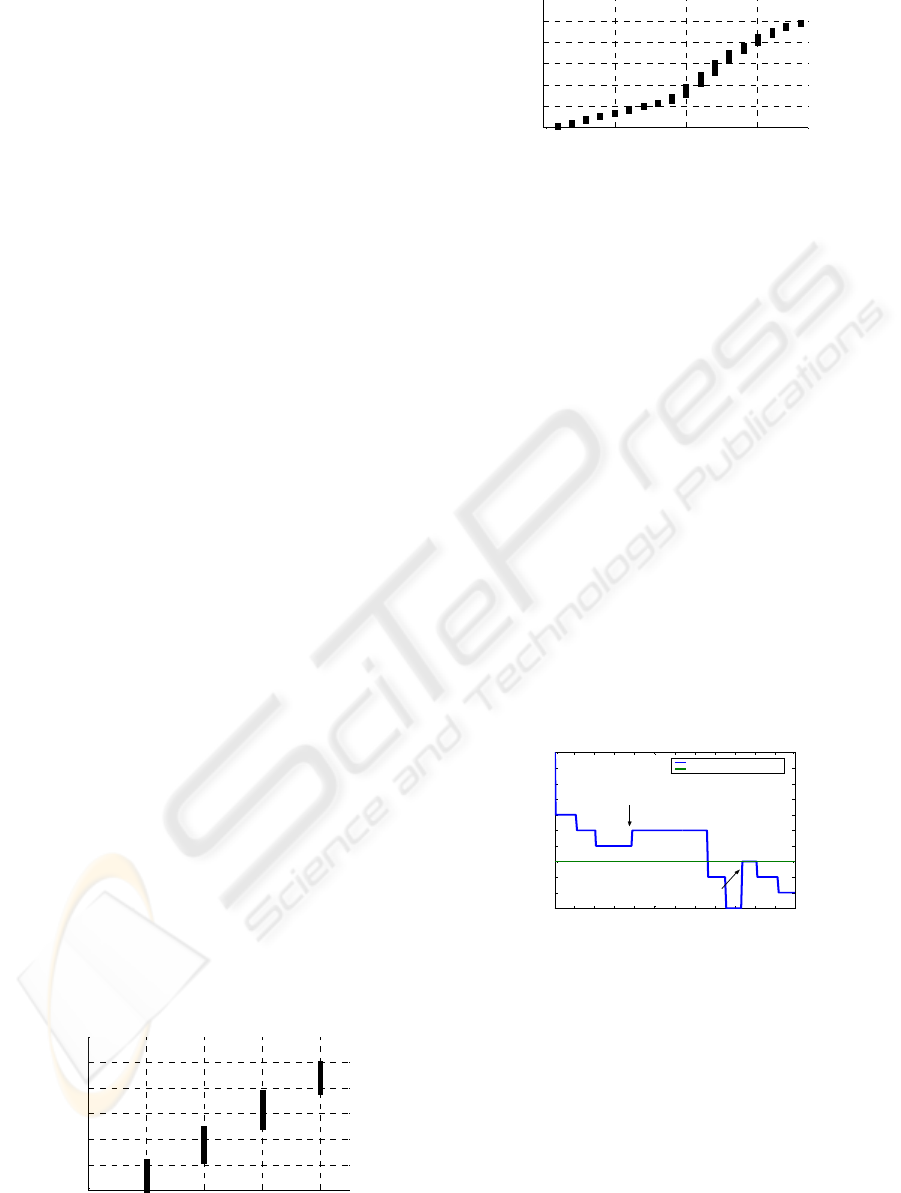
functions are represented in Figs. 4.a and 4.b. In Fig.
4.b is also possible to see that column 10 has higher
probability than column 1. It is also important to see
that, if all cells at robot’s workspace have the same
probability weight, then the mapping functions
would be uniform. Thus, each row or column would
have the same probability to be generated.
4.3 Montecarlo Simulation Results
The objective of Montecarlo experiments was to test
the performance of both scanning methods:
probabilistic and sequential ones. The performance
is measured in function of the time needed to access
a given position. This position is generated by the
uniform random source. After 500 trials the mean
time needed to access a random position by the first
approach of the probabilistic scan was of 20.4
seconds. For the second approach of the
probabilistic scan the mean time needed was of 16.8
and for the sequential scan was of 19.8 seconds. The
three results are in the same order but the
probabilistic second approach of the scan mode
requires less time. Consider now only the right side
of the workspace, which is, according to Fig. 3, the
most accessed side. The mean time of access for all
points belonging to the workspace right side is of 8.4
seconds under the first approach of the probabilistic
scan instead of 11.3 seconds corresponding to the
second approach of the probabilistic scan mode.
Under sequential scan, the mean time is of 14.8
seconds. The probabilistic scan mode first approach
is 43% faster than the sequential scan for cells over
the right side of the workspace while the second
approach is 23.7% faster.
0 1 2 3 4
0
0.2
0.4
0.6
0.8
1
M
app
i
ng
f
unc
ti
on
f
or
R
ow
V
a
l
ues
Row value
Uniform Random Source
Figure 4.a: Mapping function for the four values of rows.
0 5 10 15
0
0.2
0.4
0.6
0.8
1
M
app
i
ng
f
unc
ti
on
f
or
C
o
l
umn
V
a
l
ues
Column value
Uni f or m Random Sour ce
Figure 4.b: Mapping function for the 18 values of
columns.
Figure 5 shows how a low probability valued cell in
the probability scan first approach evolves after
successive callings. The cell passes through the
different zones of cells according to its actual
probability value. After 240 iterations -or callings-,
the cell has passed through three zones and its
performance has also been improved as long as its
weight. In Fig. 5, one can see that at the beginning,
32 seconds were needed to access that cell.After 240
iterations, only 14 seconds were needed. This time is
smaller than the one needed on the sequential scan
mode which is of 18 seconds. Fig. 5 also shows
when the cell changes zones. Thus, if its probability
increases, the cell passes from, for example, primary
zone 2 to primary zone 1. Though a cell could be the
first in being scanned in the primary zone 2, if it
increases its value and passes to primary zone 1, it
could be the last scanned element in this zone. That
is the reason of the two time increments in Fig. 5. A
cell under the second approach of the probabilistic
scan shows similar behavior to the one showed in
Fig. 5.
20 40 60 80 100 120 140 160 180 200 220
12
14
16
18
20
22
24
26
28
30
32
Scan Mode Time evolution of a low Probability Cell after 240 iterations
Iterations
Time needed to reach the cell in secs
Cell under Probabilistic Scan
Cell under Sequential Scan
First Change of Zone
Second Change of Zone
Figure 5: Evolution of a cell access time.
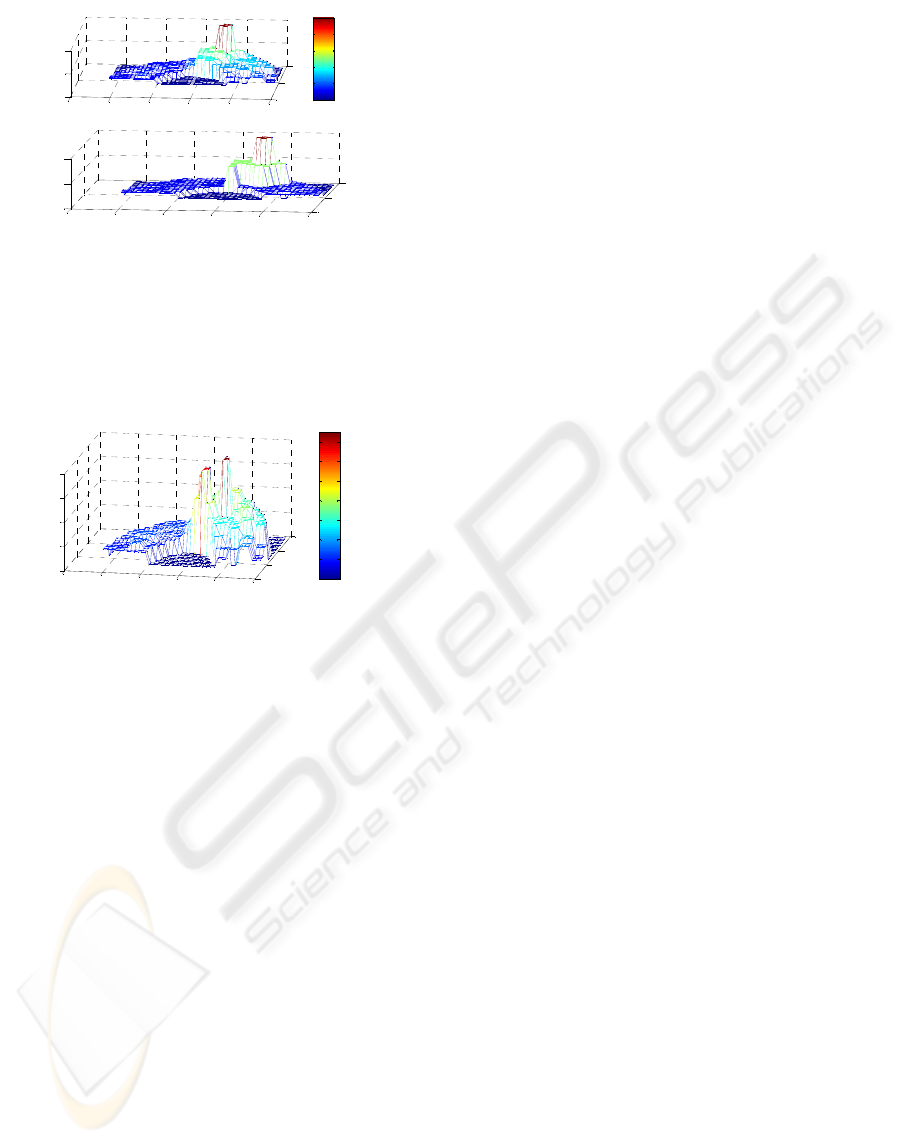
Figure 6 shows the workspace state after 500
iterations generated by the Montecarlo experiment
using the first approach of the probabilistic scan.
Fig. 6.a shows the probability state of each cell at
the workspace while Fig. 6.b shows the new three
zones of the scan mode algorithm. One can see that
the non-connectivity tends to disappear.
PROBABILISTIC WORKPSACE SCAN MODES OF A ROBOT MANIPULATOR COMMANDED BY EEG SIGNALS
7
0
10
20
30
40
50
0
20
40
0
0.5
1
Probability values of the workspace's cells
Probability
0
10
20
30
40
50
0
20
40
0
0.5
1
Workspace primary zones
0
0.2
0.4
0.6
0.8
1
a)
b)
Figure 6: Workspace state after 500 iterations.
On the other hand, Fig. 7 shows the workspace state
after the same iterations of Fig. 6 under the second
approach of the probabilistic scan, though this scan
do not imply a dynamic behavior of the number of
cells of the different zones.
0
10
20
30
40
50
0
10
20
30
0
0.2
0.4
0.6
0.8
Probability values of the workspace's cells
Probability
0
0.1
0.2
0.3
0.4
0.5
0.6
0.7
Figure 7: Workspace state after 500 iterations under the
second approach of the probabilistic scan mode.
As it can be seen from Figs. 6 and 7, probabilistic
distribution of the workspace depends on the type of
scan mode used. Both probabilistic scan modes
presented in this work show a better performance
respect to the sequential scan mode.
5 CONCLUSIONS
The work presented here showed the implementation
of two probabilistic scan modes, based on a
recursive Bayes algorithm, of a robot manipulator’s
workspace. A comparison between these methods
and a sequential scan mode showed that the
probabilistic scan improves the access time of the
most frequently accessed cells. Although this system
could be implemented in several Human-Machine
Interfaces, it was primary designed for a Brain-
Computer Interface.
Experimental results show that the time needed
to access a specific position at the workspace is
decreased each time the position is reached. This is
so because the recursive Bayes algorithm
implemented updates the probability value of that
position once it is reached. A decrement of the
access time means that the user of the Interface
needs less effort to reach the objective.
In this work, a right-handed workspace
distribution case was presented. This case showed
that all cells to the right of the middle point -half of
the main workspace- have the higher probability and
the lower time needed to be accessed.
Finally, it is possible to say that the system learns
the user’s workspace configuration. It pays special
attention to those cells with the highest probability
minimizing the time needed to access them.
ACKNOWLEDGEMENTS
The authors thank CAPES (Brazil), SPU and
CONICET (Argentina) and FAPES (Brazil), for
their financial support to this research.
REFERENCES
Felzel, T., 2001. On the possibility of developing a brain-
computer interface (BCI). Technical University of
Darmstadt, Darmstadt, Germany, Tech. Rep., (2001).
Ferreira, A., T. F. Bastos Filho, M. Sarcinelli Filho, F. A.
Auat Cheeín, J. Postigo, R. Carelli, 2006.
Teleoperation of an Industrial Manipulator Through a
TCP/IP Channel Using EEG Signals, In International
Symposium on Industrial Electronics
, Montreal.
Proceedings of ISIE2006, v. 1, p. 3066-3071.
Kubler, A., B. Kotchoubey, J. Kaiser, J. R. Wolpaw, and
N. Birbaumer, 2001. Brain-computer communication:
unlocking the locked, In. Psychol Bull, vol. 127, no. 3,
pp. 358.75, (2001).
Lehtonen, L., 2003.
EEG-based brain computer
interfaces
,. Master's thesis, Helsinky University of
Technology, Helsinky, Finl.andia, (2003).
Ljung, L., 1987. System Identification, New Jersey:
Prentice Hall.
Millán, J., F. Renkens, J. Mouri.ño, and W. Gerstne, 2003.
Non-invasive brain-actuated control of a mobile robot,
in Proceedings of the 18
th
International Joint
Conference on Artificial Intelligence
, Acapulco,
Mexico.
Ochoa, J. B., 2002.
EEG brain classification or brain
computer interface
, Master's thesis, Ecole
Polytechnique Federale de Lusanne, Lusanne.
Papoulis, A., Probabilidad, variables alatorias y procesos
estocásticos, Barcelona: Eunibar, 1980.
Thrun, S., W. Burgard, D. Fox, Probabilistic Robotics,
Massachusetts: The MIT Press, 2005.
Wolpaw, J. R., N. Birbaumer, D. J. McFarland, G.
Pfurtscheller, and T. M. Vaughan, 2002. Brain-
computer interfaces for communication and control.
Clin Neurophysiol,6, no. 6, pp. 767.791.
BIODEVICES 2008 - International Conference on Biomedical Electronics and Devices
8
