
YEAST ON A CHIP
Single-cell Analyses of MAPK Signaling Pathways in Saccharomyces Cerevisiae
using Cell Chips
Min Cheol Park, Moon Kyu Kwak, Hye Sung Cho, Kahp Y. Suh
School of Mechanical and Aerospace Engineering, Seoul National University, Seoul 151-742, Korea
Jae Young Hur, Sang-Hyun Park
Department of Biological Sciences, Seoul National University, Seoul 151-742, Korea
Keywords: Cell chip, single-cell, MAPK signaling pathway, stochastic kinetics, receding meniscus, florescent protein.
Abstract: The mitogen-activated protein kinase (MAPK) signaling pathways are essential for cell growth, cell
differentiation and survival in eukaryotes. The MAPK signaling pathways transmit signals from the cell
surface to nucleus. The mating and high osmolarity responses in the budding yeast, Saccharomyces
cerevisiae, depend on the MAPK signaling pathways. Here we analyzed the mating and high osmolarity
responses in the budding yeast, S. cerevisiae at single-cell level using cell chips. The cell chip analyses of
the mating and high osmolarity responses were performed using fluorescent proteins fused to genes whose
transcription is specifically upregulated by each signaling. Using the technique, we have determined the
real-time gene expression patterns of the mating and high osmolarity responses at single-cell level. In this
study, we observed that the mating and high osmolarity MAPK signaling showed a non-uniform, fluctuating
flux in the population of yeast cells analyzed.
1 INTRODUCTION
Cellular behavior has been typically investigated by
utilizing bulk-scale methods that measure average
values for a population of cells. For example,
commonly used methods for high-throughput, cell-
based assays are adapted to 96- and 384-well plate
(recently 1536-well plates) formats (Hertzberg &
Pope, 2000). Despite the success of these assays,
such population-wide studies mask the behavior of
individual cells and are often insufficient for
characterizing biological processes in which cellular
heterogeneity plays a key role (i.e., ensemble
averaging problem).
Single-cell measurements are necessary for
investigating the stochasticity of gene expression
because cell-to-cell variation cannot be quantified
using population measurements. Flow cytometry and
automated microscopy are some of the most widely
used techniques for single-cell measurements.
Owing to the stochastic nature of gene expression,
the optimal experimental setup for analyzing gene
expression dynamics will be capable of both
monitoring the behavior of a large population of
cells and of tracking individual cells. Flow
cytometry can be used to obtain gene expression
data for thousands of cells, but only provides a
snapshot of gene expression at single time points.
Traditional microscopy experiments can track gene
expression dynamics in individual cells, but can only
monitor a ralatively small population of cells.
Microfluidics or “lab-on-a-chip” technologies can be
used to track gene expression changes in individual
cells, enable large populations of cells to be
monitored, and allow the precise control of the
cellular microenvironment.
These microfluidic “lab-on-a-chip” technologies
offer the ability to work with smaller reagent
volumes, shorter reaction times, and the possibility
of high-throughput analysis (Figeys & Pinto, 2000;
Reyes, Iossifidis, Auroux, & Manz, 2002). Utilizing
these technologies, one possible approach to analyze
individual cells is based on cell-trapping including
hydrodynamic confinement (Wheeler et al., 2003),
negative dielectrophoresis (Voldman, Gray, Toner,
268
Cheol Park M., Kyu Kwak M., Sung Cho H., Y. Suh K., Young Hur J. and Park S. (2008).
YEAST ON A CHIP - Single-cell Analyses of MAPK Signaling Pathways in Saccharomyces Cerevisiae using Cell Chips.
In Proceedings of the First International Conference on Biomedical Electronics and Devices, pages 268-271
DOI: 10.5220/0001050602680271
Copyright
c
SciTePress
& Schmidt, 2002), optical tweezers (Ashkin, 1997),
and microwells etched at the tip of a fiber-optic
bundle (Biran & Walt, 2002). These methods,
however, would have some limitations for easy,
cheap, high-throughput microscopic studies of single
cells.
Recently, we reported highly improved version
of the soft lithographic approach using surface
tension driven cell seeding and subsequent cell
docking induced by receding meniscus (Park, Hur,
Kwon, Park, & Suh, 2006). Using this method,
single to multiple yeast cells can be accurately
deposited onto microwells depending on the size of
the microwell with a cheap, easy and high
throughput manner. Here, we incorporated the
receding meniscus induced docking method into
high-throughput automated fluorescent microscopy
for analyzing stochastic nature of the MAPK
signaling pathways in the budding yeast, S.
cerevisiae. Using the technique, we have determined
the real-time gene expression patterns of the mating
and high osmolarity responses at single-cell level. In
this study, we observed that the mating and high
osmolarity MAPK signaling showed a non-uniform,
fluctuating flux in the population of yeast cells
analyzed.
2 RESULTS AND DISCUSSION
2.1 Receding Meniscus Induced
Docking
Inside a microfluidic channel, receding meniscus can
be a powerful tool for arraying yeast cells at single-
cell level in a high-throughput manner. To utilize the
receding meniscus induced docking method, we
fabricated PUA microwells onto glass substrate
using capillary molding (Suh, Kim, & Lee, 2001),
and the patterned glass substrate was bonded to a
PDMS microfluidic mold (Khademhosseini et al.,
2004) (Fig. 1).
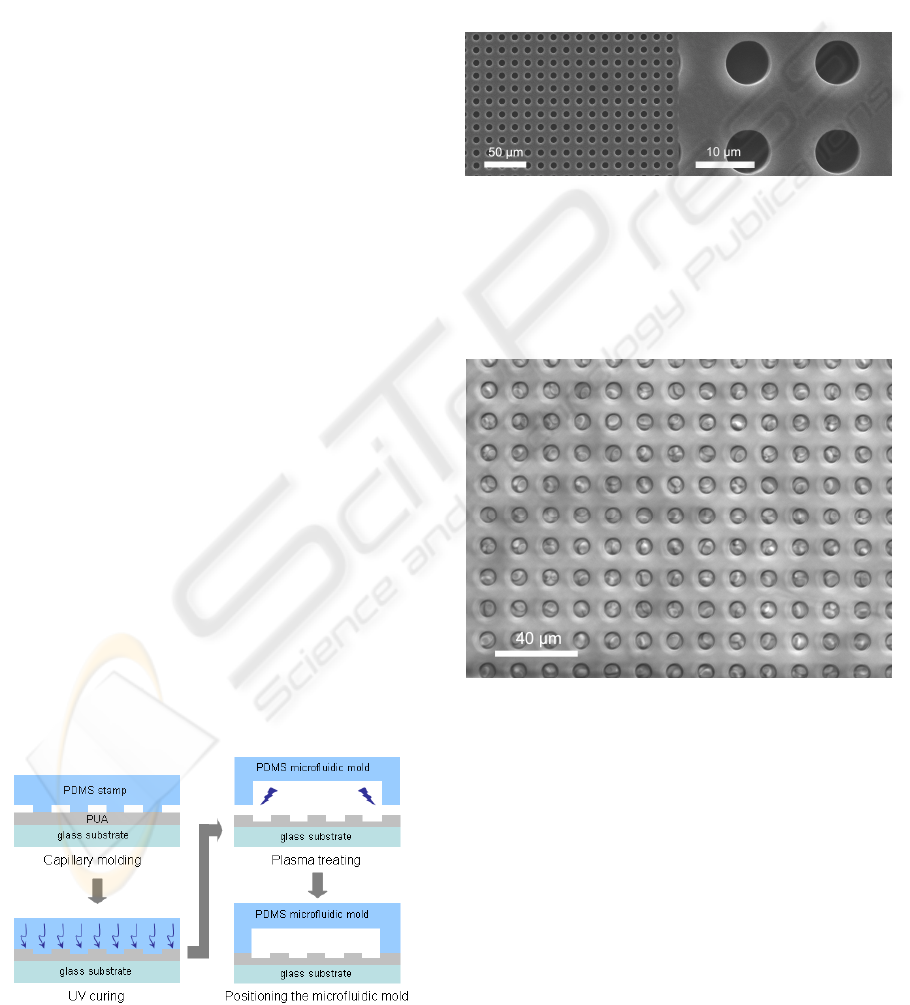
Figure 1: Fabrication of a patterned microfluidic channel.
Some representative SEM images of the
fabricated PUA microwells are shown in Fig. 2. The
pattern dimension of circular wells was 8 μm in
diameter, allowing for a feature density of 3906
wells/mm
2
which is similar to Affymetrix
GeneChip
TM
. A higher-magnification (×3500) right
column SEM images shows the well-defined PUA
structures with good edge definition. The depth of
each PUA microstructure was measured to be 8 µm
corresponding to the original height of the silicon
master (not shown).
Figure 2: SEM images of PUA microwells.
As previously described (Park et al., 2006), yeast
cells were docked into the microwells at single-cell
level. As shown in Fig. 3, the docking efficiency is
more than 90 % that allows high-throughput and
high-content single-cell analysis.
Figure 3: Single-cell docking of yeast cells in large-area.
2.2 Monitoring Gene Expression
Using this cell chip platform, we monitored the
mating (α-factor) and high osmolarity (KCl)
responses in the budding yeast, S. cerevisiae at
single-cell level over time. The cell chip analyses of
the mating and high osmolarity responses were
performed using fluorescent proteins fused to genes
whose transcription is specifically upregulated by
each signaling. To do this, we constructed three
kinds of yeast strain such as SH129 (MATa, leu2,
trp1, met15, P
Fus1
-EGFP, P
Gpd1
-Tdimer2), SH133
(MATa, leu2, trp1, met15, P
Fus1
-EGFP-Cln2(PEST),
YEAST ON A CHIP - Single-cell Analyses of MAPK Signaling Pathways in Saccharomyces Cerevisiae using Cell Chips
269
P
Gpd1
-Tdimer2) and SH135 (MATa, leu2, trp1, met15,
Kar4_EGFP, P
Gpd1
-Tdimer2) using homologous
recombination.
For microscopic monitoring, we used
DeltaVision
TM
system (Applied Precision, LLC.)
which provide real-time live cell imaging. In order
to image multiple fields of cells automatically and
repeatedly over time, we controlled the microscope
and camera with commercially available software,
softWorx
TM
suite (Applied Precision, LLC.). We
monitored 20 image fields which contain 42 ~ 49
well so that the total number of monitored cells were
about one thousand. Some representative merged
fluorescent images of each yeast strain are shown in
Fig. 4 (scale bars are not shown).
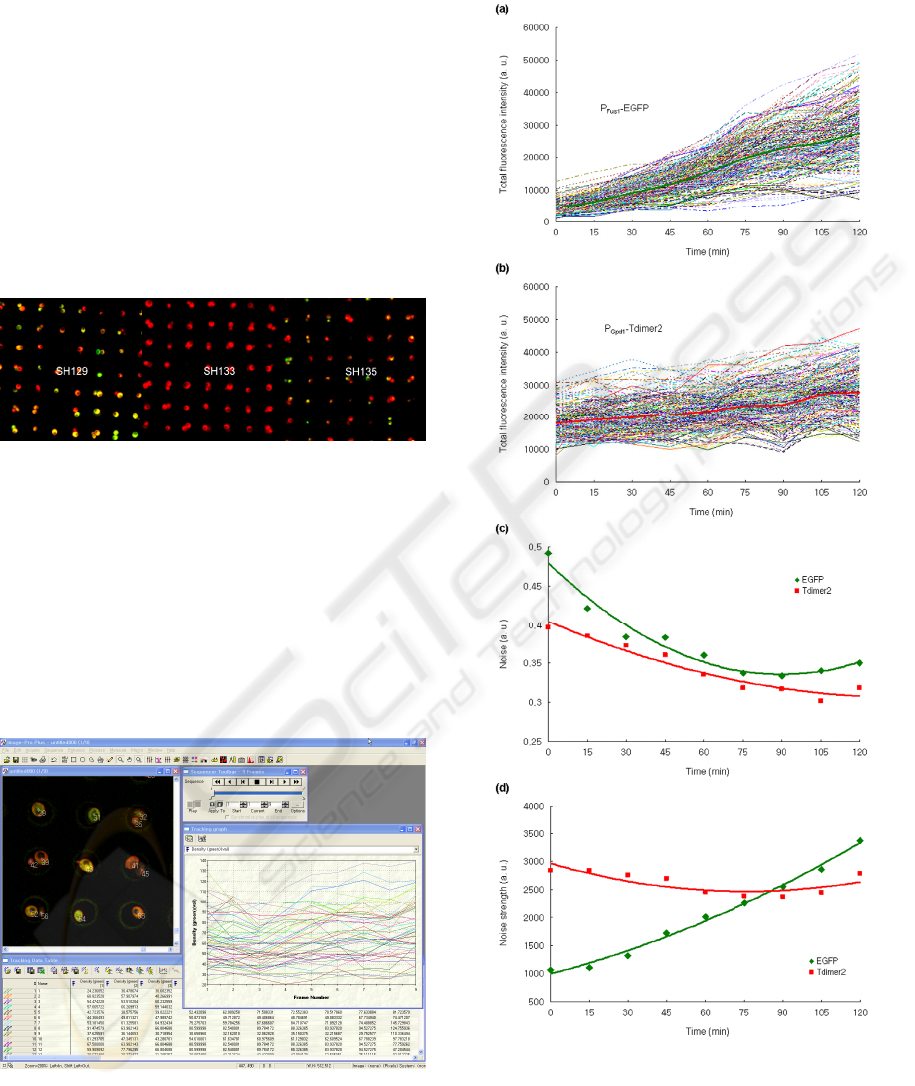
Figure 4: Merged fluorescent images of yeast strains.
2.3 Analyses of Stochastic Gene Expression
The acquired time-course merged fluorescent images
were pre-processed for more accurate extraction of
single-cell expression level. The pre-processing
includes background subtraction, HiGauss filtering,
Sharpen filtering and Flatten filtering. After image
pre-processing, we extracted quantitative gene
expression information with ImagePro
TM
software
(Media Cybernetics, Inc.) (Fig. 5).
Figure 5: Extraction of quantitative information.
Genetically identical cells exhibit remarkable
diversity even when they have identical histories of
environmental exposure (Elowitz, Levine, Siggia, &
Swain, 2002; Raser & O'Shea, 2004).
Figure 6: Analysis of stochastic gene expression in
SH129.
As expected, we observed that the mating and
high osmolarity MAPK signaling showed a non-
uniform, fluctuating flux in the population of yeast
cells analyzed. For example, when we used strain
BIODEVICES 2008 - International Conference on Biomedical Electronics and Devices
270

with EGFP and Tdimer2 reporters driven by the α-
factor-responsive P
Fus1
promoter or by the α-factor-
independent P
Gpd1
promoter (i.e., SH129), the total
fluorescence intensity, noise and noise strength upon
stimulation of 10 µM α-factor are characterized as
shown in Figure 6.
Figure 7 shows the stochastic gene expression in
SH133 strain which contain C-terminal residues
Cln2 (yeast G1 cyclin) PEST motifs. The Cln2
(PEST) destabilized EGFP so that it allows dynamic
monitoring of transcription over time. Figure 7a
shows dose-dependent gene expression of P
Fus1
-
EGFP upon stimulation of α-factor. Interestingly, the
mating MAPK signaling has different kinetic gene
expressions as increasing cellular area (Fig. 7b).
Figure 7: Analysis of stochastic gene expression in
SH133.
Similarly, the SH135 strain whose character is
protein localization exhibits the stochastic gene
expression (not shown).
3 CONCLUSIONS
We have presented an optimal experimental setup
for analyzing gene expression dynamics which
would be capable of both monitoring the behavior of
a large population of cells and of tracking individual
cells. It was composed of yeast strain construction,
single-cell docking, automated image acquisition,
extraction of quantitative information, analyzing and
modelling of the stochastic gene expression. Using
this cell chip platform, we could successfully have
an insight into the stochastic nature of gene
expression, so we hope that many other investigators
also will have such insight more easily aided this
high-throughput and high-content single-cell
analysis method.
REFERENCES
Ashkin, A. (1997). Optical trapping and manipulation of
neutral particles using lasers. Proceedings of the
National Academy of Sciences of the United States of
America, 94(10), 4853-4860.
Biran, I., & Walt, D. R. (2002). Optical Imaging fiber-
based single live cell arrays: A high-density cell assay
platform. Analytical Chemistry, 74(13), 3046-3054.
Elowitz, M. B., Levine, A. J., Siggia, E. D., & Swain, P. S.
(2002). Stochastic gene expression in a single cell.
Science, 297(5584), 1183-1186.
Figeys, D., & Pinto, D. (2000). Lab-on-a-chip: A
revolution in biological and medical sciences.
Analytical Chemistry, 72(9), 330a-335a.
Hertzberg, R. P., & Pope, A. J. (2000). High-throughput
screening: new technology for the 21st century.
Current Opinion in Chemical Biology, 4(4), 445-451.
Khademhosseini, A., Suh, K. Y., Jon, S., Eng, G., Yeh, J.,
Chen, G. J., et al. (2004). A soft lithographic approach
to fabricate patterned microfluidic channels.
Analytical Chemistry, 76(13), 3675-3681.
Park, M. C., Hur, J. Y., Kwon, K. W., Park, S. H., & Suh,
K. Y. (2006). Pumpless, selective docking of yeast
cells inside a microfluidic channel induced by
receding meniscus. Lab on a Chip, 6(8), 988-994.
Raser, J. M., & O'Shea, E. K. (2004). Control of
stochasticity in eukaryotic gene expression. Science,
304(5678), 1811-1814.
Reyes, D. R., Iossifidis, D., Auroux, P. A., & Manz, A.
(2002). Micro total analysis systems. 1. Introduction,
theory, and technology. Analytical Chemistry, 74(12),
2623-2636.
Suh, K. Y., Kim, Y. S., & Lee, H. H. (2001). Capillary
force lithography. Advanced Materials, 13(18), 1386-
1389.
Voldman, J., Gray, M. L., Toner, M., & Schmidt, M. A.
(2002). A microfabrication-based dynamic array
cytometer. Analytical Chemistry, 74(16), 3984-3990.
Wheeler, A. R., Throndset, W. R., Whelan, R. J., Leach,
A. M., Zare, R. N., Liao, Y. H., et al. (2003).
Microfluidic device for single-cell analysis. Analytical
Chemistry, 75(14), 3581-3586.
YEAST ON A CHIP - Single-cell Analyses of MAPK Signaling Pathways in Saccharomyces Cerevisiae using Cell Chips
271
