
A NEW METABOLISM MODEL FOR HUMAN SKELETAL MUSCLE
Dayu Lv and Bill Goodwine
Department of Aerospace and Mechanical Engineering, University of Notre Dame, Notre Dame, IN 46556, USA
Keywords:
Glucose, Insulin, Skeletal Muscle, Metabolism.
Abstract:
The human body metabolic regulatory system is very complex, containing thousands of metabolites involved
in biochemical reactions. Glucose metabolism is one of the key procedures maintaining daily energy balance.
Mobility of glucose is implemented by glucose transporters with different transporting characteristics locally,
which are distributed in cells of brain, liver, pancreas, kidney and skeletal muscle, etc. This paper presents a
component of a new model that is focused on skeletal muscle which consume energy consistently due to either
slight movement or high-energy demanded activities, such as running or swimming. This paper presents a
mathematical model where glucose, insulin, glucose-6-phosphate (G6P), etc. are introduced and connected by
ordinary differential equations.
1 INTRODUCTION
This paper presents a new model for the metabolic
regulation of glucose in skeletal muscle in humans. It
is part of a larger effort to develop a detailed whole-
body human metabolic regulation model. Modeling
of such systems is useful for several reasons. First, the
mathematical structure of an accurate model will pro-
vide concise insight into the relevant physiology and
also the pathophysiology of disease. Second, it will
allow for inexpensive “experimentation” or biosimu-
lation, which if predictive, can serve as a supplement
to, and perhaps provide guidance to, in vivo and in
vitro experimentation.
Of course this work is motivated by the epidemic
of diabetes, which is a disease characterized by a fail-
ure to regulate blood glucose level. Many models
have been constructed to describe glucose mobility in
humans. What distinguishes this work from others is
the scope, or dimension, of the model.
For many years, people have been investigating
pathways of carbohydrates metabolism in order to es-
tablish mathematical models to reflect biology and
control mechanisms. In (Srinivasan et al., 1970), a
model composed of glucose, insulin and fatty acids
was proposed to explain a two-hour metabolism re-
sponding to IV infusions of glucose, insulin, etc.
Later, another hormone, glucagon, was added to a
glucose-insulin system, (Cobelli et al., 1982). A few
years ago, the mass of β-cells was connected to the
system of glucose and insulin (Topp et al., 2000).
Others were interested at kinetic properties of hor-
mones, particularly insulin. A three-compartment in-
sulin model was introduced in (Sherwin et al., 1974).
It was composed of a plasma compartment, a quick
compartment equilibrating with plasma and a slower
one. Also the pulsative characteristic of insulin was
well simulated (Toli´c et al., 2000).
Although many models have been proposed, they
are mainly restricted to metabolites without reflect-
ing transporters’ activities. In contrast, the model
presented in this paper includes details regarding ef-
fects of, for example, various glucose transporters
(GLUTs) in different organs, as well as G6P, which
plays a key role in metabolism participating glycoge-
nesis, glycogenolysis and glycolysis.
2 MODEL CONSTRUCTION
Skeletal muscle is actively involved in daily life. So
the initial focus of our investigation into modeling
whole-body glucose metabolism will be skeletal mus-
cle. This model is constituted of two main parts: the
interstitial fluid space (IFS) and the intracellular space
(ICS). In the IFS, cells are surrounded by a liquid en-
vironment for nutrition exchange. Via diffusion, glu-
238
Lv D. and Goodwine B. (2008).
A NEW METABOLISM MODEL FOR HUMAN SKELETAL MUSCLE.
In Proceedings of the First International Conference on Biomedical Electronics and Devices, pages 238-243
DOI: 10.5220/0001051202380243
Copyright
c
SciTePress
cose passes through capillaries to the IFS, then enter
the ICS mediated by GLUT4. In the ICS, glucose is
converted to G6P for storage and utilization. Glyco-
gen can also break down to form G6P.
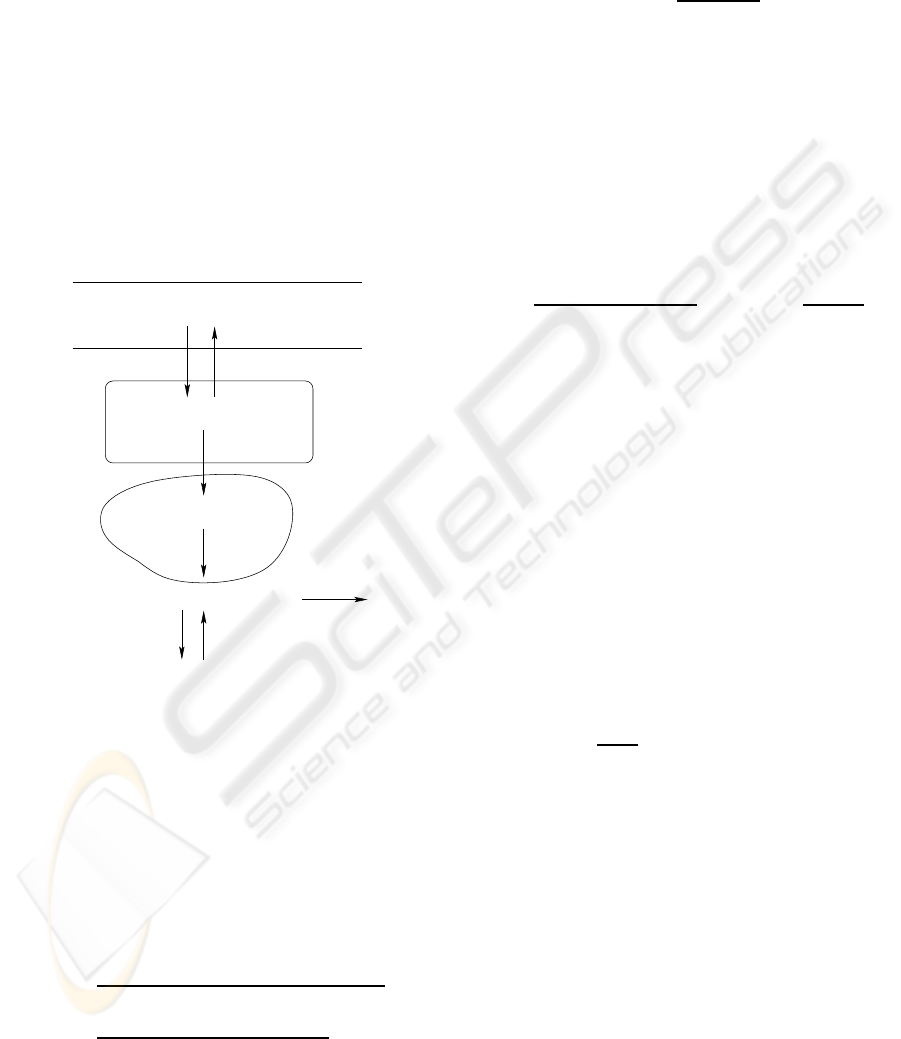
2.1 Intercellular Transport
The mechanism for glucose transport in the IFS is il-
lustrated in Figure 1. It is assumed to diffuse through
capillaries into the IFS and the direction is determined
by the difference of glucose concentration between
them, given by
f
gs
= K
01
× ([G] − [G]
si
), (1)
where f
gs
is positive for glucose out of plasma.
Muscle
GLUT4
Glycogen
Plasma
IFS
ICS
[G]
Diffusion
f
gs
[G]
si
[G]
sc
f
gsi
G
store
G
use
G
break
Glucose− 6− P
Figure 1: Three compartments of skeletal muscle.
Mediated by GLUT4, glucose is carried into the
ICS described by Michaelis-Menton kinetics with
V
max
= 1.0 mmol/kg-muscle/min and K
m
= 5.7 mM
in the basal state (Perriott et al., 2001). Insulin and ex-
ercise may stimulate more GLUT4 activity. The rates
of insulin stimulation can be determined from (Sara-
bia et al., 1992), and exercise from (Fujimoto et al.,
2003) and are given by
In
V
=
1.4331
1+ e
−0.2473×lg([In]/(16.7×10
−10
))−3.271
,(2)
Ex
V
=
4.4531
1+ e
−198.5×(
˙
V
O
2
/
˙
V
O
2
max
)+60.95
+ 1, (3)
V
max
= 1.0× Mass× In
V
× Ex
V
, (4)
where [In] represents insulin concentration in plasma,
In
V
represents the insulin effect on V
max
and Ex
V
rep-
resents the exercise effect on V
max
. Consequently, the
glucose exchange rate between the IFS and the ICS is
f
gsi
= −V
max
[G]
si
K
m
+ [G]
si
, (5)
where [G]
sc
and [G]
si
represents the glucose concen-
tration in the ICS and the IFS respectively, f
gsi
repre-
sents the rate which is positive for glucose transported
out of the ICS.
In the model, insulin concentration is only consid-
ered in plasma, which is stimulated by increasing glu-
cose concentration determined by dose-response on
the secretion of insulin from isolated human islets of
Langerhans (Frayn, 2003) and the data are fitted as
In
g
=
79.21
1+ e
−1.934×[G]+10.52
+ 29.84
×
n× 0.7
V
p
× 60
,
(6)
where In
g
represents the glucose stimulation on in-
sulin secretion (mU/l/min), n represents the number
of Langerhans, approximately one million (Frayn,
2003) assuming 70% of which are β-cells and V
p
rep-
resents the plasma volume.
The degradation of insulin (In
d
, mU/l/min), is
modeled by a half-life given by
In
d
= [In] × e
−K
02
×t
, (7)
where [In] represents insulin concentration in plasma
and K
02
represents the half-life coefficient (assuming
K
02
= 20). Therefore the dynamics of insulin concen-
tration is
d[In]
dt
= In
d
+ In
g
. (8)
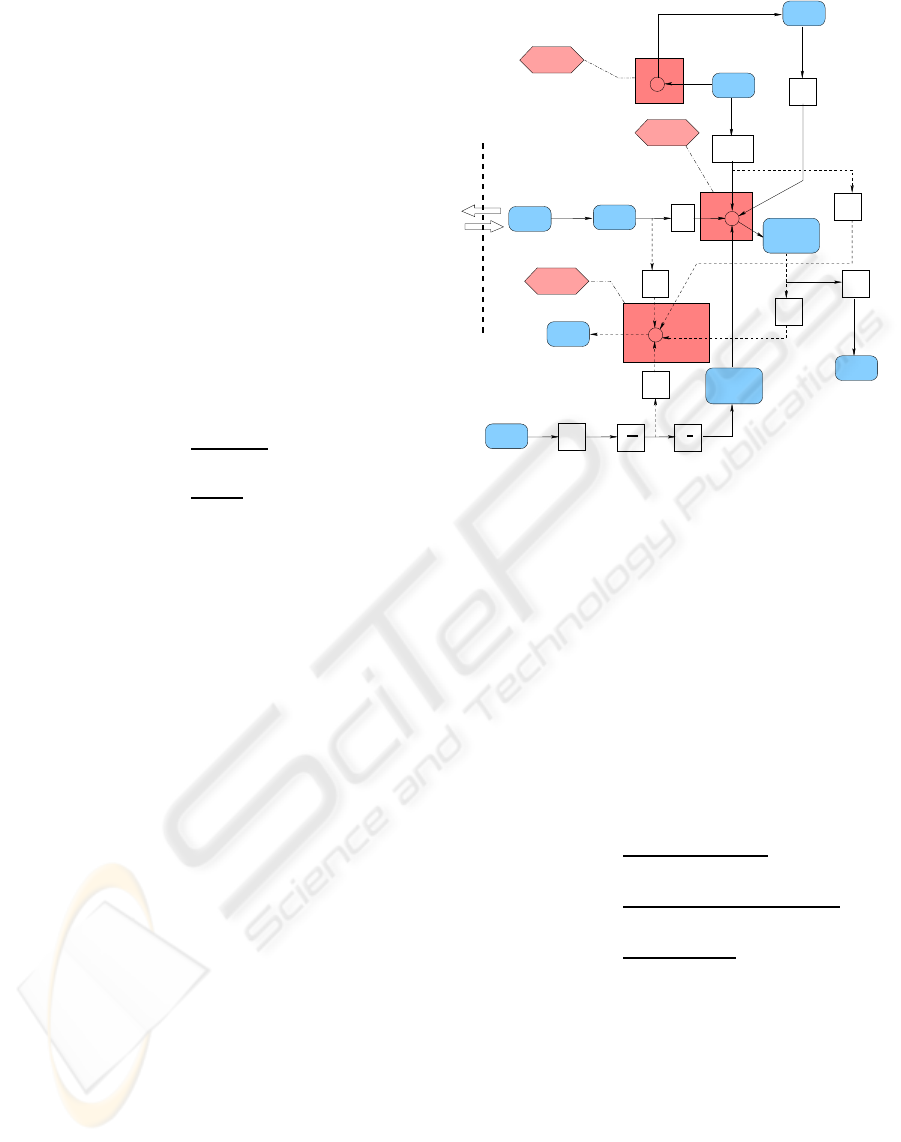
2.2 Intracellular Space
After glucose uptake, it enters the intracellular
metabolic process illustrated in Figure 2. The con-
struction is based on an energy balance where the
concentration of ATP remains almost constant (Frayn,
2003). G6P is generated from glucose and glycogen,
and utilized through aerobic and anaerobic processes.
2.2.1 ATP Conservation
To meet the energy need of Work (mol/min), ATP is
generated from aerobic and anaerobic glycolysis, the
difference between which is the amount of ATP pro-
duced. Assuming oxygen is fully utilized by muscle,
about 30 mol ATP is generated from 1 mol G6P and
A NEW METABOLISM MODEL FOR HUMAN SKELETAL MUSCLE
239
6 mol oxygen (Aerobic - mol/min, G6P consumed)
while in anaerobic glycolysis (Anaerobic, mol/min,
G6P consumed), only 2 mol ATP is produced from
1 mol G6P. Also, converting glucose to G6P (Rate
1
,
mol/min, G6P produced) and synthesis of G6P to
glycogen (Syn - mol/min, glycogen produced) are
consuming energy. The energy of Work can be ex-
pressed as metabolic rate (Frayn, 2003). While this
paper focuses on glucose metabolism, it is important
to note that in the Randle-cycle, with competition be-
tween glucose and fatty acids, under different inten-
sities of exercises, the proportion of fuels utilization
between glucose and FFA will change. For example,
under rest or light housework, the proportion of glu-
cose as a fuel is providing about 10% of required en-
ergy while during swimming it will increase to about
70%. This is expressed by
ATP
O
2
=
1.429× 5
32
×
˙
V
O
2
, (9)
Aerobic =
1.429
32× 6
×
˙
V
O
2
, (10)
where the oxygen has the density of 1.429 g/l and
mole mass of 32 g/mol, ATP
O
2
represents the ATP
generated by aerobic respiration and Aerobic repre-
sents the G6P consumed during aerobic respiration.
Then Anaerobic, the needed rate of G6P for anaero-
bic glycolysis can be calculated from
ATP
O
2
− Rate
1
+ Anaerobic× 3 − Syn× 20= Work,
(11)
where Rate
1
represents the rate from glucose to G6P
and Syn represents the synthesis rate of glycogen.
2.2.2 Glycogen Conservation
Glycogen conservation is simply determined by the
synthesis and breakdown rates, given by
Syn − Dwn = ∆(GLY). (12)
2.2.3 G6P Conservation
Glycogen is a highly branched polymer that can be
looked on as a set of multi-G6Ps. In this model, the
proportion of glycogen to G6P is assumed to be 1:10
and the change of G6P is given by
∆G6P = Rate
1
+ 10Dwn − 10Syn
−Aerobic− Anaerobic. (13)
−
−
−
−
Interstitial
Fluid
Intracellular
G
sc
Rate
1
ATP
1
1
GLY
G6P
Lactate
Work
˙
V
O
2
1.429
1
32
5
2
Insulin
Insulin
Insulin
1
6
Aerobic
Anaerobic
3
2
Dwn
Syn
10
10
Figure 2: ATP Metabolism in Muscle.
2.2.4 Variables
• Rate
1
is the hexokinase (HK) rate on converting
glucose to G6P. Under 456 pM of insulin, Rate
1
was determined as 0.0048 mmol/kg-muscle/min
(Rothman et al., 1992). Assuming
1. Rate
1
is a sigmoidal function of insulin concen-
tration;
2. Rate
1
is a sigmoidal function of [G6P]; and
3. Rate
1
is a sigmoidal function of [G]
sc
,
R
0
= 1.5 × Mass, (14)
In
R
=
2
1+ e
(−[In]+40.0)/20
, (15)
G6P
R
=
2
1+ e
([G6P]−0.12×Mass/V
sc
)/10
,(16)
Gsc
R
=
2
1+ e
−[G]
sc
+3.0
, (17)
Rate
1
= R
0
× In
R
× G6P
R
× Gsc
R
, (18)
where R
0
is the basal value, Mass represents mus-
cle weight, In
R
, G6P
R
and Gsc
R
represents their
effects on Rate
1
respectively, [In], [G6P] and [G]
sc
represents concentrations respectively, V
sc
repre-
sents the volume of the ICS.
• The synthesis rate of glycogen, Syn, is determined
by the concentration of glycogen and G6P, in-
sulin fitted from the data (Kelley and Mandarino,
1990), presented in Table 1 giving
BIODEVICES 2008 - International Conference on Biomedical Electronics and Devices
240

GLY
syn
=
1
1+ e
[GLY]−0.95×[GLY]
max
, (19)
In
syn
=
2
1+ e
−2.2765×lg
[In]
[In]
0
× (20)
2
1+ e
0.3517×lg
[G6P]
[G6P]
0
,
(21)
G6P
syn
= 0.15× e
lg
[G6P]
[G6P]
0
, (22)
where [GLY] and [GLY]
max
represents current
and maximum glycogen concentration, In
syn
and
G6P
syn
represents their effects on Syn respec-
tively. Referring to the data, [In] = 28.2± 4.2 pM,
[G6P] = 0.133 ± 0.014 mM, glycogen synthesis
rate (mM/hr) was
Syn
1
=
15.8± 1.7, [GLY]< 35 mM
2.9± 0.2, [GLY]> 35 mM
(23)
(Price et al., 1996). In the model, we assume
Syn
0
= Syn
1
× 8 for reasonable simulation results,
and thus
Syn = Syn
0
× In
syn
× G6P
syn
× GLY
syn
. (24)
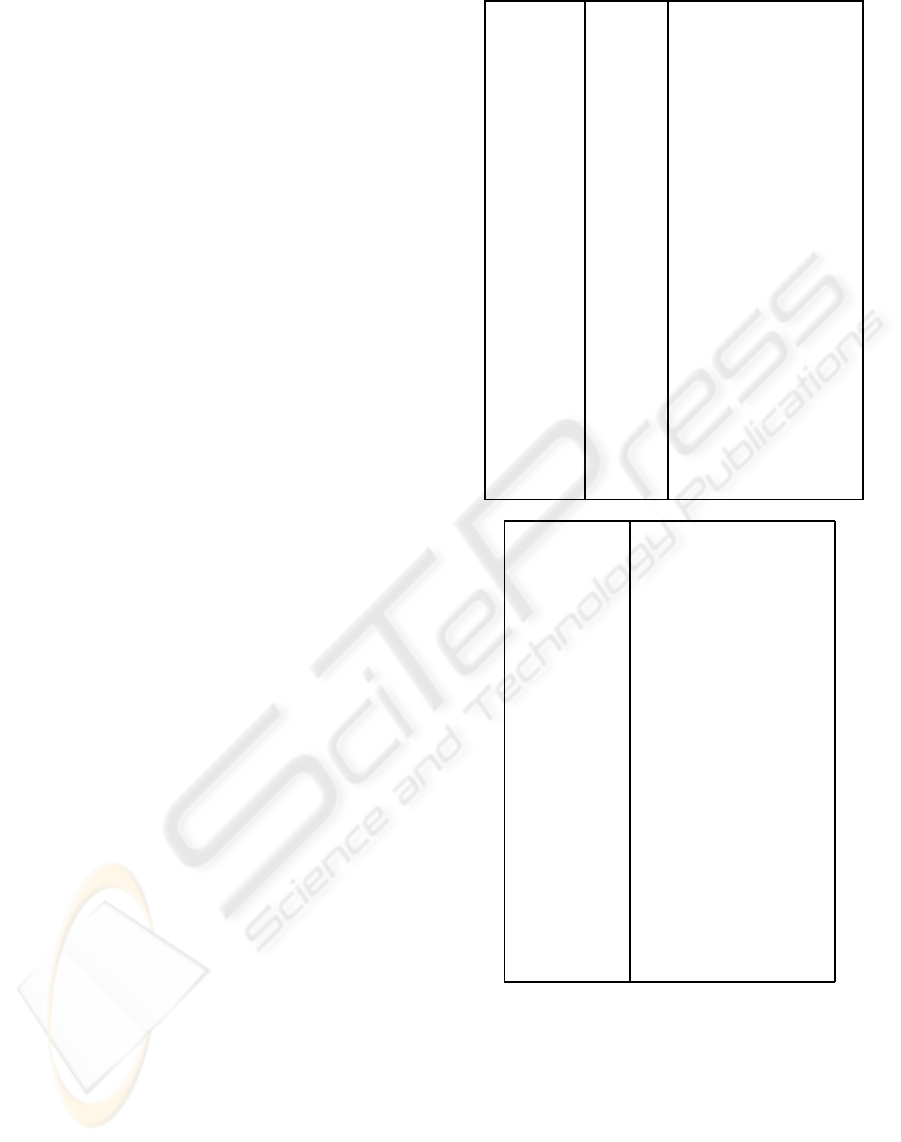
Table 1: Insulin(Basal: 9.6 mU/l; Clamp 77± 3mU/l) and
G6P (0.1mM; 10mM) effects on Syn.
Activity Basal Clamp
0.1 mM 1.59± 0.29 2.82± 0.43
10 mM 6.14± 0.62 7.21 ± 0.67
• The breakdown rate of glycogen, Dwn, is deter-
mined by G6P, glycogen and insulin concentra-
tions as follows
In
dwn
=
2
1+ e
[In]−20.0
, (25)
G6P
dwn
=
2
1+ e
[G6P]−1.8
, (26)
GLY
dwn
=
1
1+ e
−[GLY]+0.1×[GLY]
max
, (27)
where [In],[G6P], [GLY] and [GLY]
max
repre-
sents the concentrations of insulin, G6P, glycogen
and maximum glycogen. Assuming variables of
needed G6P (G6P
1
) and of test (test
1
):
G6P
1
= Anaerobic+ Aerobic+ 10Syn,(28)
test
1
= G6P
1
− 0.5× current G6P. (29)
If test
1
is near or less than zero, which means cur-
rent G6P is enough for consumption, we set the
rate (mol/min) as Equation 30 and otherwise as
Equation 31,
Dwn
0
= 0.02, (30)
Dwn
0
= test
1
× 30× 10
−3
/dt, (31)
Dwn = Dwn
0
× In
dwn
× G6P
dwn
× GLY
dwn
.
(32)
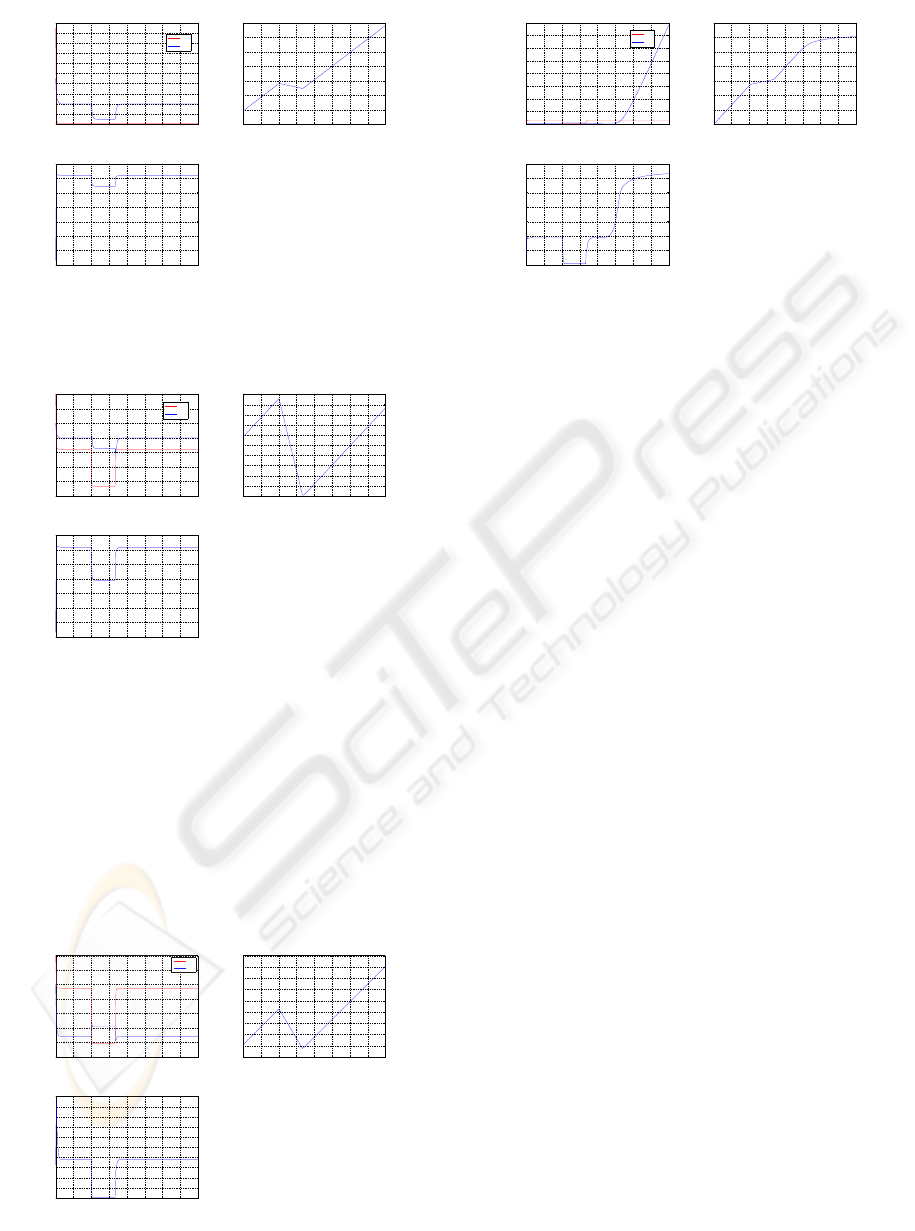
3 SIMULATION RESULTS
Assuming glucose clamp [G] = 5 mM, the simulations
assume the following activity plans
• 4 hours rest;
• 1hr rest + 40min light housework + 2hr20min rest;
• 1hr rest + 40min swimming + 2hr20min rest.
and shown in Figures 3 through 7.
0 0.5 1 1.5 2 2.5 3 3.5 4
1.6
1.8
2
2.2
2.4
2.6
2.8
3
3.2
3.4
3.6
Time (hr)
mM
[G] in Muscle
[G]
si
[G]
sc
0 0.5 1 1.5 2 2.5 3 3.5 4
48
50
52
54
56
58
60
62
64
66
Timie (hr)
mM
[Glycogen] in Muscle
0 0.5 1 1.5 2 2.5 3 3.5 4
0.5
1
1.5
2
2.5
3
3.5
4
Timie (hr)
mM
[G6P] in Muscle
Figure 3: 4hr rest.
For the plan of swimming, we also simulate it with
higher glucose levels [G] = 7 mM and [G] = 14 mM,
and the results are illustrated in Figures 6 and 7. Note
that in Figure 7, intracellular glucose concentration
increase rapidly in the last part of simulation, which
is due to the saturation of muscle glycogen and G6P,
and it may bring about critical health problems.
A NEW METABOLISM MODEL FOR HUMAN SKELETAL MUSCLE
241
0 0.5 1 1.5 2 2.5 3 3.5 4
1.6
1.8
2
2.2
2.4
2.6
2.8
3
3.2
3.4
3.6
Time (hr)
mM
[G] in Muscle
[G]
si
[G]
sc
0 0.5 1 1.5 2 2.5 3 3.5 4
48
50
52
54
56
58
60
62
Timie (hr)
mM
[Glycogen] in Muscle
0 0.5 1 1.5 2 2.5 3 3.5 4
0.5
1
1.5
2
2.5
3
3.5
4
Timie (hr)
mM
[G6P] in Muscle
Figure 4: 1hr rest + 40min light housework + 2hr20min rest.
0 0.5 1 1.5 2 2.5 3 3.5 4
0
0.5
1
1.5
2
2.5
3
3.5
Time (hr)
mM
[G] in Muscle
[G]
si
[G]
sc
0 0.5 1 1.5 2 2.5 3 3.5 4
44
45
46
47
48
49
50
51
52
53
54
Timie (hr)
mM
[Glycogen] in Muscle
0 0.5 1 1.5 2 2.5 3 3.5 4
0.5
1
1.5
2
2.5
3
3.5
4
Timie (hr)
mM
[G6P] in Muscle
Figure 5: 1hr rest + 40min swimming + 2hr20min rest.
4 CONCLUSIONS AND
PERSPECTIVES
In this paper, we have presented a mathematical
metabolism model in human muscle. It is based on
0 0.5 1 1.5 2 2.5 3 3.5 4
0
0.5
1
1.5
2
2.5
3
3.5
Time (hr)
mM
[G] in Muscle
[G]
si
[G]
sc
0 0.5 1 1.5 2 2.5 3 3.5 4
48
50
52
54
56
58
60
62
64
66
Timie (hr)
mM
[Glycogen] in Muscle
0 0.5 1 1.5 2 2.5 3 3.5 4
0
0.2
0.4
0.6
0.8
1
1.2
1.4
1.6
1.8
2
Timie (hr)
mM
[G6P] in Muscle
Figure 6: [G] = 7 mM, swimming.
0 0.5 1 1.5 2 2.5 3 3.5 4
0
20
40
60
80
100
120
140
160
Time (hr)
mM
[G] in Muscle
[G]
si
[G]
sc
0 0.5 1 1.5 2 2.5 3 3.5 4
50
55
60
65
70
75
80
85
Timie (hr)
mM
[Glycogen] in Muscle
0 0.5 1 1.5 2 2.5 3 3.5 4
0
1
2
3
4
5
6
7
Timie (hr)
mM
[G6P] in Muscle
Figure 7: [G] = 14 mM, swimming.
the kinetics of glucose transporters, GLUT4 and also
considers the key role of G6P, whose regulation will
determine the flow between storage and utilization.
It works well in simulations. Under different activi-
ties, it reflects the interrelationships among glucose,
insulin, G6P and glycogen.
The model has some limitations which we are cur-
rently addressing. First, the role of the glucose trans-
porter GLUT1, with different kinetics is not yet con-
sidered. This transporter clearly plays a role in the
basal state. Second, insulin concentration is consid-
ered only in plasma for simplification. And third, ex-
periment data are still needed for a few of the equa-
tions. We indicated throughout the paper where a nu-
merical value had to be assumed. Subsequent work
will include a series of numerical experiments to bet-
ter define the value, or range of values, that are feasi-
ble for such parameters.
In future work, the dynamics of insulin will be in-
vestigated and improved. Its resistance due to last-
ing high glucose level may be considered. Also, dur-
ing exercises, increased level of lactate may be con-
nected to other organs, such as liver. The overall goal,
as mentioned previously, is a whole-body model ex-
pressed at a level of detail and fidelity similar to that
for the muscle presented in this paper.
ACKNOWLEDGEMENTS
Partial support from the Center for Applied Mathe-
matics of University of Notre Dame and the Notre
Dame Faculty Research Program are gratefully ac-
knowledged.
BIODEVICES 2008 - International Conference on Biomedical Electronics and Devices
242
REFERENCES
Cobelli, C. et al. (1982). An integrated mathematical model
of the dynamics of blood glucose and its hormonal
control. Mathematical Biosciences, 58:27–60.
Frayn, K. N. (2003). Metabolic Regulation: A Human Per-
spective. Blackwell Science Ltd, Oxford, 2nd edition.
Fujimoto, T. et al. (2003). Skeletal muscle glucose up-
take response toexercise in trained and untrained men.
Med. Sci. Sports Exerc., 35:777–783.
Kelley, D. E. and Mandarino, L. J. (1990). Hyperglycemia
normalizes insulin-stimulated skeletal muscle glucose
oxidation and storage in noninsulin-dependent dia-
betes mellitus. J. Clin. Invest., 86:1999–2007.
Perriott, L. M. et al. (2001). Glucose uptake and metabolism
by cultured human skeletal muscle cells: rate-limiting
steps. Am. J. Physiol. Endocrinol Metab., 281:72–80.
Price, T. B. et al. (1996). Nmr studies of muscle glyco-
gen synthesis in insulin-resistant offsprings of parents
with non-insulin-dependent diabetes mellitus immedi-
ately after glycogen-depleting exercise. Proc. Natl.
Acad. Sci. USA, 93:5329–5334.
Rothman, D. L. et al. (1992).
31
p nuclear magnetic reso-
nance measurements of muscle glucose-6-phosphate.
J. Clin. Invest., 89:1069–1075.
Sarabia, V. et al. (1992). Glucose transport in human skele-
tal muscle cells in culture. J. Clin. Invest., 90:1386–
1395.
Sherwin, R. S. et al. (1974). A model of the kinetics of
insulin in man. J. Clin. Invest., 53:1481–1492.
Srinivasan, R. et al. (1970). A mathematical model
for the control mechanism of free fatty acid-glucose
metabolism in normal humans. Computers and
Biomedical Research, 3:146–166.
Toli´c, I. M. et al. (2000). Modeling the insulin-glucose feed-
back system: the significance of pulsatile insulin se-
cretion. J. Theor. Biol., 207:361–375.
Topp, B. et al. (2000). A model of β-cell mass, insulin, and
glucose kinetics: pathways to diabetes. J. Theor. Biol.,
206:605–619.
APPENDIX
The variables, parameters and initial values are shown
in this appendix.
G/[G] mmol/mM Glucose amount/concentration
in plasma.
G
si
/[G]
si
mmol/mM Glucose amount/concentration
in interstitial space.
G
sc
/[G]
sc
mmol/mM Glucose amount/concentration
in intracellular space.
G6P/[G6P] mmol/mM G6P amount/concentration
[In] mU/l Insulin concentration.
˙
V
O
2
/
˙
V
O
2
max
l/min Oxygen consumption
rate/Maximum.
Mass kg Skeletal muscle weight,
n N/A Number of Langerhans
V
si
/V
sc
l Volume of interstitial space
/intracellular space.
V
b
/V
p
l Blood/Plasma Volume.
GLY/GLY
max
mM Glycogen concentration
/Maximum concentration.
V
max
mmol/min Maximum reaction rate.
K
m
mM Michaelis constant.
K
01
l/min Diffusion coefficient.
K
02
N/A Insulin half-life coefficient.
Aerobic mol/min aerobic glycolysis rate.
Anaerobic mol/min anaerobic glycolysis rate.
Syn mol/min Glycogen synthesis rate.
Dwn mol/min Glycogen breakdown rate.
[G] 5
[G]
si
3.5
[G]
sc
2.5
G6P 0.12×Mass
Body weight 70
Mass 45% of Body weight
n 10
6
[In] 10
˙
V
O
2
Percentage of
˙
V
O
2
max
:
rest - 10%
light housework - 25%
swimming - 75%
V
si
10% of Mass
V
sc
0.1852 × Mass
V
b
5
V
p
55% of V
b
GLY
max
1% of Mass
K
m
5.7
K
01
2
K
02
20
A NEW METABOLISM MODEL FOR HUMAN SKELETAL MUSCLE
243
