
HIGH RESOLUTION ECG AND DEPTH DATA LOGGER
A Novel Device to Study Breath Hold Diving Induced Variations of the PQ Interval
A. Sieber
1, 2
, R. Bedini
3
, X. Yong
4
, A. Navarri
3
, M. Dalle Luche
3
, A. L’Abbate
2
and P. Dario
2
1
Profactor Research and Solutions GmbH, Seibersdorf, Austria
2
Scuola Superiore Sant’ Anna, Pisa, Italy
3
CNR, Istituto di Fisiologia Clinica, Pisa, Italy
4
MEMS Center of Chongqing University, China
Keywords: ECG, breath-hold, apnoe, diving, PQ interval.
Abstract: Breath hold diving induces several physiological effects. The authors speculate that next to bradycardia,
vasoconstriction, splenic contraction and blood shift, the form of the ECG and especially the PQ interval are
also affected. Investigations of this effect requires a high resolution ECG monitor which is also capable of
recording depth. This paper describes our data logger prototype. It samples ECG data at 1200 Hz, is
equipped with three temperature and a pressure sensor that allows depth measurement up to 140 m and
stores all the data in an ASCII text file on a SD flash card in FAT 16 or FAT32 file format. The prototype is
then encapsulated in a Lexan tube with an outer diameter of 42 mm and an overall length of 18cm that
should withstand 20 bar pressure equal to 200 m depth.
1 INTRODUCTION
Freediving or breath hold diving history dates back
at least 4500 years ago to pearl divers of the south
pacific. In 1911, one of the first freediving
competitions was held when a Greek fisherman,
Yorgos Haggi Statti, sometimes called “the father of
freediving”, successfully reached more than 60m
depth with a total apnoe close to seven minutes.
Today breath hold diving enjoys a wide popularity,
both recreationally and competitively. Actual depth
record in the breath hold diving discipline No-Limits
is already beyond 200m (Nitsch, H., 11.07.2007,
214m No-Limit, Greece). A big stimulus for this
sport was and still is Luc Besson’s cult film “Le
Grand Bleu” or “The Big Blue”, which depicts the
life of the elite apnoe divers Jacques Mayol and
Enzo Maiorca and their life-long competition in
freediving. However research on breath hold diving
is also shown, where experiments in a mountain lake
in gorgeous scenery in Peru are carried out (Mayol,
J., 2000) to demonstrate bradycardia during breath
hold diving. Other adaptations made by the human
body while underwater and at high pressure include
(Gooden, B.A., 1994), (Andersson, J.P.A., Line,
M.H., Ruenow, E., Schagatay, E.K.A.,2002):
• Vasoconstriction: Blood vessels shrink. Blood
stream is directed away from limbs for the
benefit of heart, lungs and brain.
• Splenic contraction: Releasing red blood cells
carrying oxygen.
• Blood shift: Blood plasma fills up blood vessels
in the lungs and reduces residual volume.
Without this adaptation, the human lung would
shrink and wrap into its walls, causing
permanent damage at depths greater than 30
meters.
Recent experiments with a novel underwater
Doppler-Echography system also demonstrate
cardiovascular changes during breath hold dives at 3
and 10m (Marabotti, C., Scalzini, A., Chiesa, F.
Bedini, R., Reale, L., Passera, M. Belardinelli, A.
Pingitore, A., Cialoni, D., Data P.G,2005). We
speculate that these cardiovascular changes also
affect the timing of the ECG. To investigate possible
variances of the PQ or the PR interval dependent on
the depth, a novel data logger was developed that
combines a high resolution ECG (16 bit, 1200 Hz
sampling rate) and depth recorder in a small,
watertight housing.
269
Sieber A., Bedini R., Yong X., Navarri A., Dalle Luche M., L’Abbate A. and Dario P. (2008).
HIGH RESOLUTION ECG AND DEPTH DATA LOGGER - A Novel Device to Study Breath Hold Diving Induced Variations of the PQ Interval.
In Proceedings of the First International Conference on Biomedical Electronics and Devices, pages 269-275
DOI: 10.5220/0001052102690275
Copyright
c
SciTePress
2 METHODS
2.1 Introduction to ECG
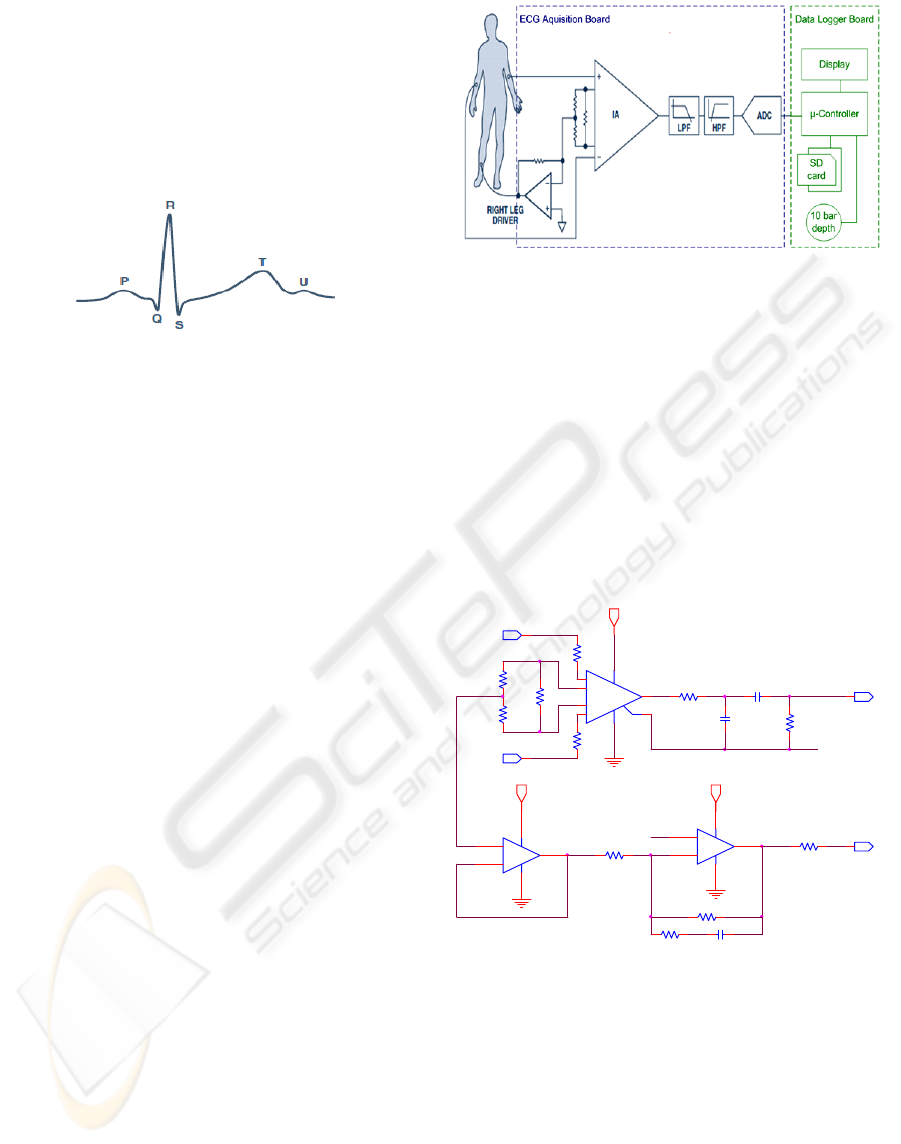
The typical ECG signal (Figure 1) is characterized
by six peaks and valleys labelled with successive
letters of the alphabet P, Q, R, S, T and U
(Malmivuo, J., Plonsey, R., 1995).
Figure 1: Typical form of a ECG signal.
A typical electrocardiogram (ECG) shows peaks
of up to 5 mV. For the proper design of a ECG
amplifier DC components up to +-300 mV, resulting
from the electrode-skin contact, and a common-
mode component of up to 1,5 V, resulting from the
potential between the electrodes and ground, have
to be taken into account. The bandwidth of an ECG
monitoring system, depends on its application. It
ranges from 0,5 Hz to 50 Hz in intensive care units
up to 1kHz for late-potential measurements
(pacemaker detection). A standard clinical ECG
application has a bandwidth of 0.05 Hz to 100 Hz.
A typical PQ interval is about 160ms. A
correlation is given between heart rate and PQ
interval (Atterhög, J., Loogna, E., 1977). Recent
studies have shown that this is not always the case,
for example directly after a heavy workload (Busse,
M., Nißing, A., Tegtbur, U., Miltzow, S., Thomas,
M., Fikenzer, S., 2004). To study variances in the
PQ interval a high spatial time resolution is required
(Ward, S., Shouldice, R.B., Flanagan, M.,
Heneghan, C.,2004).
2.2 Principle Design of the Module
The prototype consists of two boards: the ECG
signal acquisition board including amplifiers and a
high resolution AD converter and the data logger
board, comprising mainly an 8 bit RISC
microcontroller, a display, a Secure Digital memory
card slot and a 10 bar pressure sensor to monitor the
depth.
Figure 2: schematics of the developed module.
2.3 ECG Acquisition Board
For the analogue front ECG amplification stage we
use the typical approach (Company-Bosch E.,
Hartmann, E., 2003) with an instrumentation
amplifier (IA) and a right leg common-mode
feedback op amp. For the IA we have chosen the
AD620 [Analog Devices], a low cost, high accuracy
instrumentation amplifier, with excellent DC
performance: CMRR>>100 dB to nearly 1kHz,
50µVmax offset voltages, low input bias current
(1nA max), and low input voltage noise
(0.28µVfrom 0.1Hz to 10Hz).
Figure 3: Schematic of the ECG amplifier.
The AD620 requires only a single external gain-
setting resistor R
G
(figure 3). Resistors R
2
and R
3
change the normal gain equation to:
Ω
Ω+
Ω
+
=
kkRkGain
G
22/)2/4.49(/4.491
To avoid output saturation, the usable gain is
limited by the output swing and the maximum input
voltage to the IA. Here, Gain is conservatively set to
9 by choosing RG=6,8 kΩ.
HI
R1
220k
2
1
R3
22k
2
1
R6
1m
2
1
To AD7731
R2
22k
2
1
C3 0.1u
1 2
R5
10k
21
HI
C2
1u
12
LA
0
RA
R9 1m21
0
R8 10k
21
-
+
IC4A
OP491
3
2
1
411
2.5V
HI
2.5V
RL
0
IC2
AD620/AD
6
3
2 5
74
1
8
OUT
+
-REF
V+V-
RG1
RG2
C1
100n
1
2
-
+
IC4D
OP491
12
13
14
411
R7
11k
21
R10
220k
21
R4
220k
2
1
RG
6.8k
2
1
BIODEVICES 2008 - International Conference on Biomedical Electronics and Devices
270
The OP491 form Analog Devices is used in the
right-leg common-mode feedback circuit. It is a high
precision operation amplifier with a low power
consumption and high common-mode rejection
(70 dB minimum). This circuit applies an inverted
version of the common-mode interference to the
subjects right leg, with the aim of cancelling
interferences. The op amp has a voltage gain for the
common-mode voltage of 91 (R
9
/R
7
=1MΩ/11kΩ)
with a low-pass cut off at about 160Hz for stability.
(f
-3dB
=1/2π x 10kΩx0,1µF)). For simplicity, a
passive low-pass filter and a passive high-pass filter
are adopted to accomplish both gain and frequency
selectivity. The filter will allow all signals to pass
through unaffected as long as their frequency is
between the low-pass corner frequency at 160Hz and
the high-pass corner frequency at 0.1Hz
(f-
3dB
=1/2π x 1MΩx1µF)).
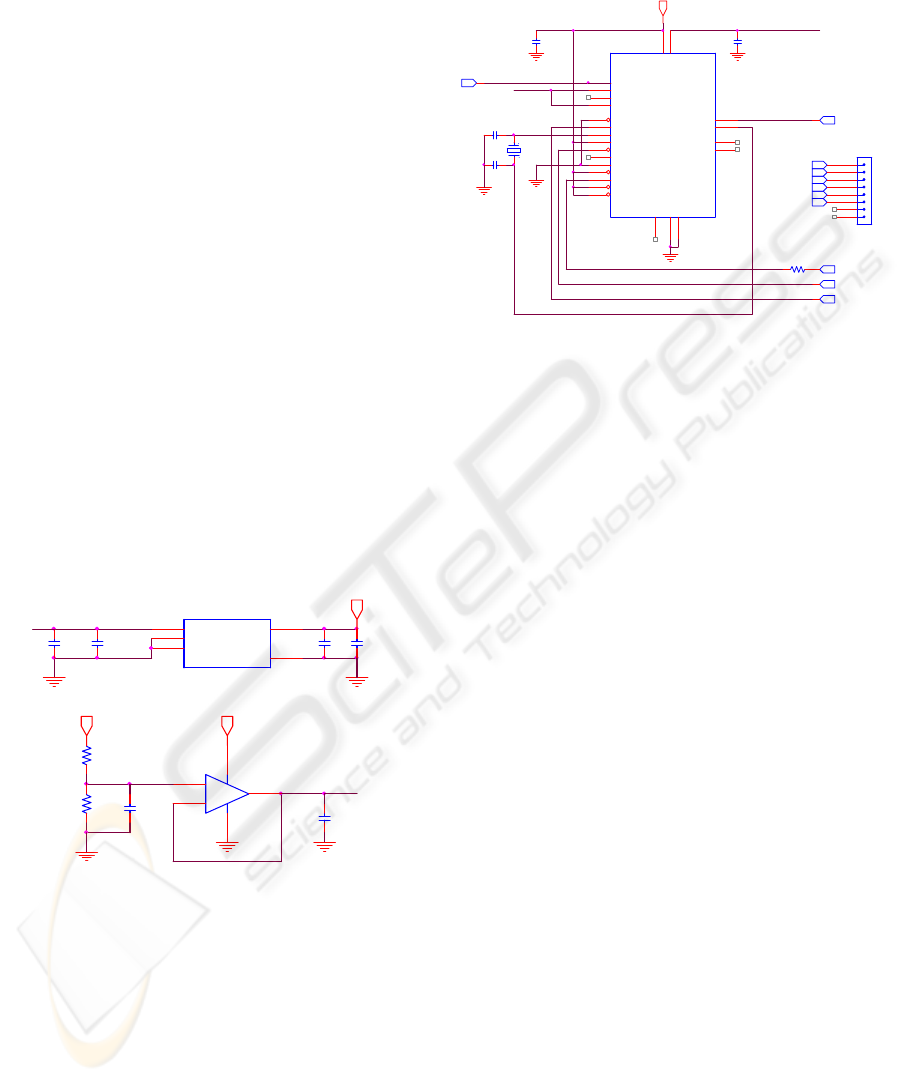
The required power for the module is supplied with
a battery. The +5V supply required for the AD620
and OP491 is handled through the voltage power
regulator TPS76950 [Texas Instruments] which
offers the benefits of low dropout voltage, ultra-low
power operation and miniaturized packaging (5-pin
SOT-23 package). The +2,5 V reference for the
AD620 is accomplished with one of the four
operational amplifiers integrated in the OP491
(figure 4).
Figure 4: Power supply of the ECG board.
A AD7731 AD converter from Analog Devices
follows the analog section. It is a low noise, high
throughput 24 bit Sigma-Delta ADC with buffered
differential inputs and programmable low pass
digital filtering allowing adjustment of filter cut-off,
output rate and settling time. The device has a
proprietary programmable gain front end that allows
it to accept a range of input signal ranges, including
low level signals. Figure 5 shows the peripheral
setup of AD7731.
JAD is the interface aimed for the
communication between AD7731 and Atmega32
which is located on the data logger board.
Figure 5: Schematics of AD7731.
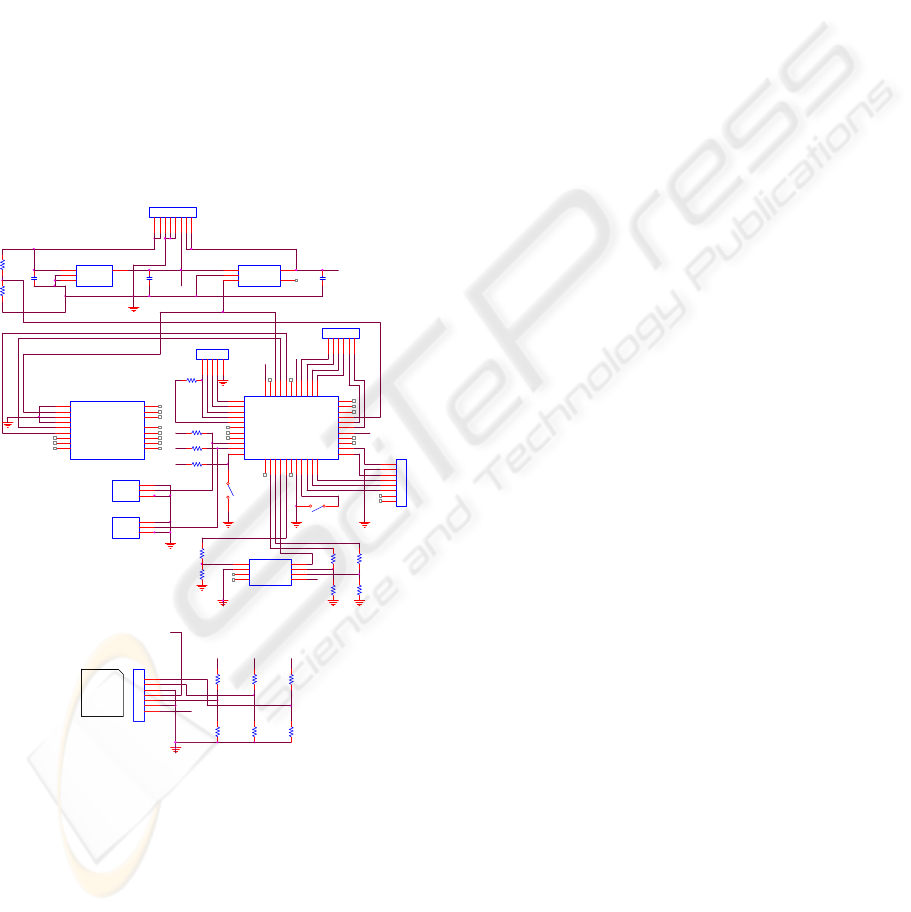
2.4 Data Logger Module
The core component of the data logger board is an
ATMEL Atmega32 microprocessor with the
following specifications:
• 32 kbyte Flash Program Memory
• 2 kbyte SRAM
• 1 kbyte EEPROM
• programmable 8 channel 10 bit ADC
• 16 MIPS @ 16MHz
• TQFP44 housing
The board can be programmed via J1. A Secure
Digital memory card connector is connected to the
SPI interface of the µ-processor (PB4-PB7). As the
SD card is powered with 3,3V, three voltage
dividers (R16 – R21) are deployed to decrease the
5V digital output signals to 3,3V. As the Atmega32
interprets digital signals above 2,7V as high, the
digital output can be directly connected to the input
of the SPI interface (MISO, PB6).
Two low drop low power consumption voltage
regulators are used to provide 3,3 V for the SD card
and 5V for the rest of the components. Additionally
the 3,3 V regulator can be switched in standby mode
via dropping the enable pin to ground (via PB2). The
EA-DP204 4x20 characters display can be
controlled in 4 bit parallel, 8 bit parallel or SPI
mode. To simplify the circuit by minimizing the
necessary connections we have chosen SPI mode.
Therefore the displays clock SCLK and serial input
SDI are connected to PB0 and PB1. The ADC’s
ready pin is interfaced to the external interrupt pin
INT1 of the µ-processor (PB3).
To dedicate the µ-processor’s inbuilt SPI bus
solely to the SD card, the routines for interfacing the
C6
1u
1
2
IC1
TPS76950
1
2
3
4
5
INPUT
GND
EN
NC
OUTPUT
C4
1u
1
2
0
0
C3
1u
1
2
R11
10k
2
1
C2
1u
1
2
0
R12
10k
2
1
C5
0.1u
1
2
0
HI
0
-
+
IC4B
OP491
5
6
7
411
HI
HI
2.5V
C1
1u
1
2
VCC
DIN(J4-5)
HI
RDY(J4-4)
C13
22p
12
DVDD(J3)
DOUT
0
C10
0.1u
1
2
DIN
0
ECG Signal
XTA L
4.9152M
C11
1u
1
2
0
IC6A
AD7731
AD7731BN
8
7
14
20
23
19
12
17
3
16
24
4
5
11
10
13
2
1
6
22
15
9
21
18
AGND
NC
REFIN_+_
RDY*
DVDD
CS*
AIN 3/D1
AIN 6
MCLKOU T
AIN 5
DGND
POL
SY NC*
AIN 2
AIN 1
AIN 4/D0
MC LKI N
SCLK
RESET*
DIN
REFIN_-_
AVDD
DOUT
STANDBY*
2.5V
C12
22p
12
SCLK(J4-7)
R18
1k
21
0
RDY
JAD
1
2
3
4
5
6
7
8
GND
SCLK
DOUT(J4-6)
0
DVDD
HIGH RESOLUTION ECG AND DEPTH DATA LOGGER - A Novel Device to Study Breath Hold Diving Induced
Variations of the PQ Interval
271
AD converter and the Display are software
implemented.
The device mainly addresses ECG recordings in
hyperbaric environments like in diving. Therefore a
digital pressure sensor needs to be integrated. For
this reason the MS5521B 14 bar absolute pressure
sensor was chosen [Intersema, Switzerland]. Even if
it is not mentioned in the datasheet, the sensor is
suitable for pressure measurement up to 33bar.
Moreover a digital temperature sensor is integrated
in the part.
This sensor requires a 3.3V supply, therefore
again voltage dividers (R5-R10) are used to reduce
the pins output voltage. The output of the pressure
sensor can be directly connected to the
microprocessor. For correct operation of the sensor a
clock signal is needed (MCLK). This clock signal is
generated with the internal Timer 2 from the Atmel
ATMEGA32.
0
0
0
DVDD
GND
DIN
DOUT
RDY
SCK
-> AD7731
0
DS18B20
U12
GNDGND
1
DQ
2
VDD
3
DS18B20
U13
GNDGND
1
DQ
2
VDD
3
0
TQFP44A
U1
ATMEGA32
PB5
1
PB6
2
PB7
3
RESET!
4
VCC
5
GND
6
XTA L2
7
XTA L1
8
PD0
9
PD1
10
PD2
11
PD3
12
PD4
13
PD5
14
PD6
15
PD7
16
VCC
17
GND
18
PC0
19
PC1
20
PC2
21
PC3
22
PC4
23
PC5
24
PC6
25
PC7
26
AVCC
27
GND
28
Aref
29
PA7
30
PA6
31
PA5
32
PA4
33
PA3
34
PA2
35
PA1
36
PA0
37
VCC
38
GND
39
PB0
40
PB1
41
PB2
42
PB3
43
PB4
44
EA-DIP 204-4
4x20 Characters
EADI P204
GND
1
VDD (+5V)
2
VEE _ Kontrast (0.. 5)
3
RS (CS*)
4
R/W (SDI)
5
EN (SC K)
6
D0(SDO)
7
D1
8
D2
9
D3
10
D4
11
D5
12
D6
13
D7
14
RES!
16
LED A
17
LED K
18
+5V
0
U10
TPS76950
IN
1
EN!
3
GND
2
OUT 5V
5
C6
1u
SS
C7
1u
R1
47k
J1
SP12 CON
1
2
3
4
5
0
J21
CON8
1
2
3
4
5
6
7
8
VBATT
+5V
Reed
SW KEY -SPST
12
J22
CON6
1
2
3
4
5
6
+5V
R3
1k
0
U11
LP2985-33
VIN
1
GND
2
EN
3
VOUT
5
By pass
4
R2
10M
+5V
0
C8
1u
3V3
MOS I
MI SO
SCK
0
R22
220k
R23
220k
MOSISCK SS
J5
SD Card
1
2
3
4
5
6
7
R4
1k
MIS O
R16
3k3
PB5 (6)
PB6(7)
PB7 (8) PB4 (5)
0
R17
1k8
R18
1k8
R19
3k3
R20
1k8
R21
3k3
3V3
+5V
+5V
3V3
Reed2
12
DS18B20
DS18B20
MS5541B
SCLK
1
GND
2
NC
3
NC
4
VDD
5
MCLK
6
DIN
7
DOUT
8
0
R5
1k8
R6
3k3
J24
CON8
1
2
3
4
5
6
7
8
R7
1k8
R8
3k3
R9
1k8
R10
3k3
Figure 6: Schematics of the datalogger board.
Body skin temperature and water temperature
are parameters that influence the physiological
diving response. Therefore two temperature sensors
are integrated in the design. These sensors can be for
example placed under the diving suit to measure the
skin temperature.
As temperature sensors two “one wire” DS18B20
[Maxim] were selected. The “one-wire” feature
allows to use just two lines for power supply,
communication and ground. In principle the two
sensors could be connected to the same port pin, but
to increase communication speed by parallel read
out, each of the sensors was connected to one
separate pin.
2.5 Software
The firmware of the module detailed in figure 7I is
developed in C under the Atmel AVR Studio 4
[Atmel] and the GNU C compiler WinAVR
(http://winavr.sourceforge.net/).
The implementation of a DOS compatible FAT
16 of FAT 32 filesystem on the SD card requires in
total 1,6 kbyte of ROM to mirror the boot sector, the
file allocation table (FAT) and to provide a buffer
for data storage.
Data storage on SD card in FAT 16 of FAT 32
file system is performed in blocks of 512 bytes each.
To enable a high sampling rate of 1200 Hz, it is
necessary to treat data storage and read out of the
ADC separately, as the data storage of a 512 byte
block may last up to 7µs.
Every time an AD conversion is complete, an
interrupt is generated via the external interrupt pin
INT1.
In the interrupt routine the result is stored in a
FIFO buffer. As soon as there are 10 entries in the
FIFO buffer, the data is converted in an ASCII string
and stored together with the actual depth on SD
card.
The “one-wire” protocol [Maxim] is software
implemented. Every two seconds the two
temperature sensors are read out.
The MS5541B is interfaced via SPI bus. Every
two seconds values for pressure and temperature are
read out and stored on SD card. Together with 6
calibration parameters stored on the sensor and
usually read out at the beginning of the program,
pressure and temperature can be calculated. To
reduce overall processing time depth and
temperature are not calculated on the microprocessor
but later under LabView.
A reed contact is used to switch the system on
and off via a magnet (in underwater applications
magnet switches are preferred as they require no
mechanic connection to a switch that needs to be
sealed). Once the magnet is removed, the system
switches in standby mode. Placing the magnet over
the reed contact creates an interrupt on INT0,
waking up the module.
BIODEVICES 2008 - International Conference on Biomedical Electronics and Devices
272
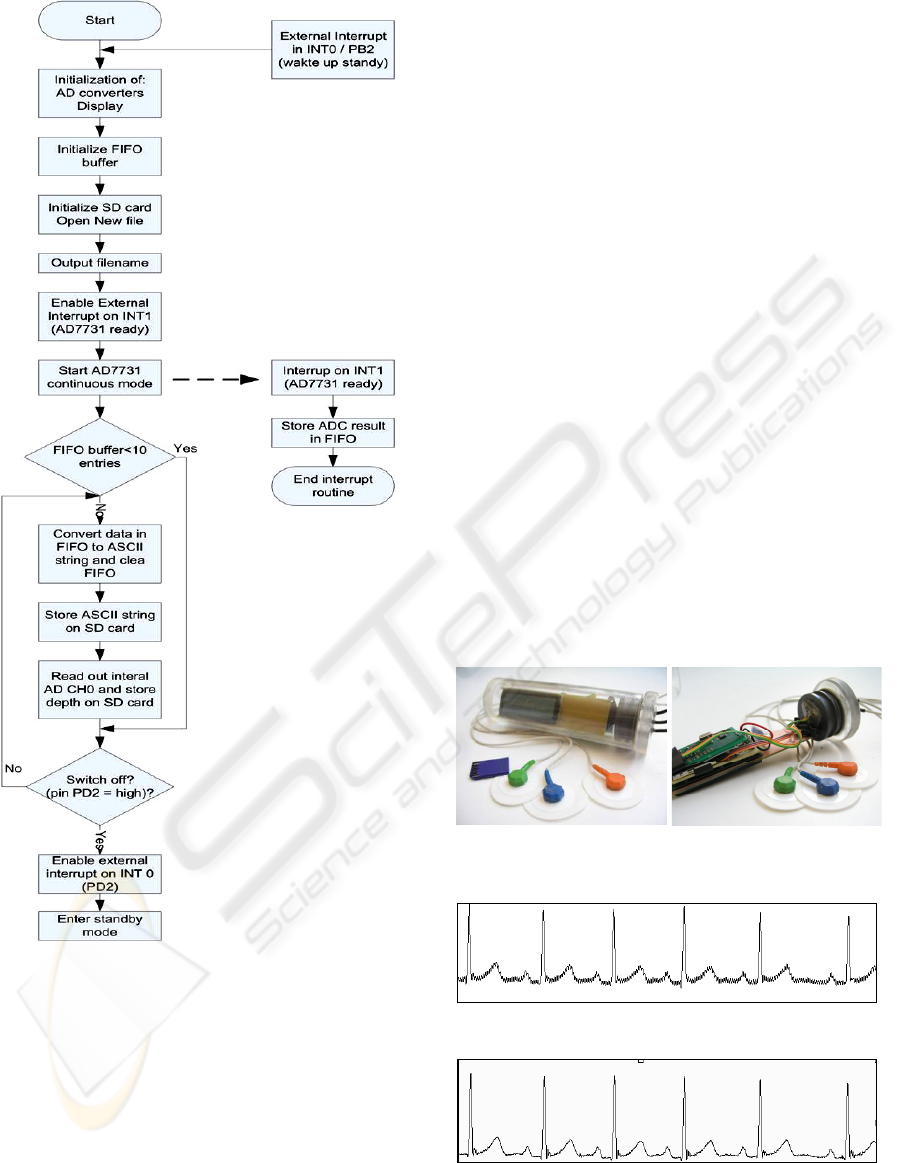
Figure 7: Software flow diagram.
2.6 ECG Data Processing
A software to preview and analyze the collected data
software was developed under Labview 7.1
[National Instruments]. To suppress the 50 Hz
noise, a optimized Notch filter is implemented (2
nd
order IIR filter, 45-55 Hz). (Josh, Y.V., Dutta Roy,
S.C.,1997), (Chivapreecha,, S., Dejhan, K.,
Yimman, S., 2005) (see also figure 9A and 9B).
3 RESULTS
A first prototype with the following specifications
was build up:
Power consumption
1)
34 mA
Module size 80x30x25mm³
Battery supply 5,5 … 10
V
Sampling rate ECG 1200 Hz
Resolution ECG 16 bit
Resolution depth sensor 10 bit / 10cm
Sampling rate depth 120 Hz
Bytes / sec 6,4 kbyte/s
File format FAT16/FAT32
Depth sensor 14 bar (33 bar)
Housing, lexan: 250 m rated
1)
The power consumption depends also on the SD card (Kingston
256 MB: 34 mA; Lbd, 32MB: 130 mA). In Standby Mode the
power consumption drops to 0,3 mA.
Moreover the board is equipped with a second
ECG channel with a second AD converter. To
enable sampling of low frequency signals a AD8730
AD converter from Analog Devices was additionally
integrated in the first prototype. It offers 10
programmable channels with a resolution of 16 bit
(application: measurement of skin conductance,
breathing sensor, temperature, etc.).
Figure 8A and 8B: First prototype in the double o-ring
sealed housing.
Figure 9A: ECG raw data.
Figure 9B: ECG raw data after filtering with the 50Hz
Notch filter.
HIGH RESOLUTION ECG AND DEPTH DATA LOGGER - A Novel Device to Study Breath Hold Diving Induced
Variations of the PQ Interval
273
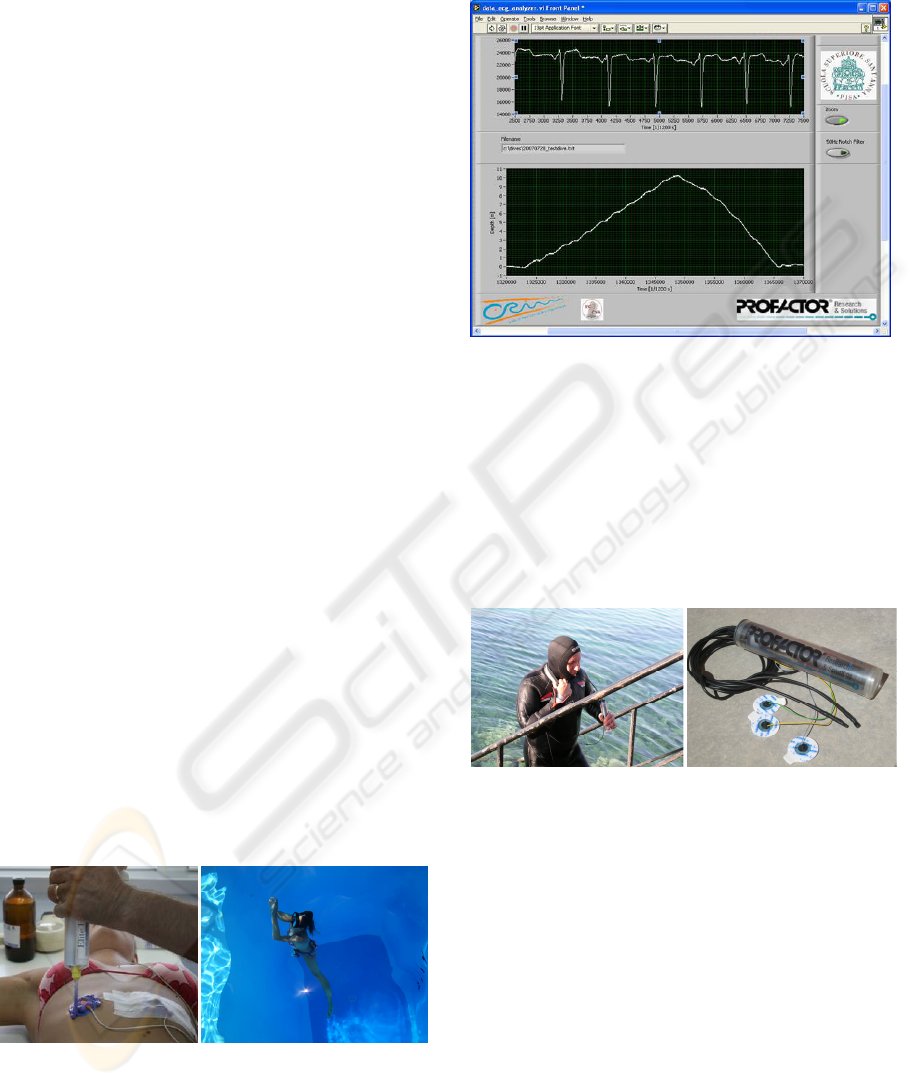
Figure 8A shows the first prototype encapsulated
in the lexan housing. The electronics consist of two
boards, one (yellow-brown) with the µ-processor,
SD card slot and the display and a second (green)
board with the ECG circuit (Figure 8B).
Figure 9A shows a sample ECG recoding. The
Notch filter allows an effective suppression of the
50Hz noise signal (figure 9B). This noise
suppression is especially necessary when recording
the ECG signal on the surface when the diver is
preparing for the apnoe immersion. Once under
water 50Hz noise signals are usually not seen due to
the electrical conductivity of salt water.
Previous experiments have shown that during the
first meters of the immersion electrodes with a
sponge give bad signals. We speculate that this is
due to the small amounts of air next to the sponge
that is getting compressed by increasing deph
causing electrode movement thus causing also
artefacts in the ECG signal. To avoid this problem
Kendall Arbo H34SG [Tyco Healthcare] electrodes
were selected, as there electrode gel is placed over
the electrode without a sponge.
As described earlier (Bedini, R., Reale, L., 2003)
recording of an ECG underwater requires a proper
sealing of the electrodes. Therefore we use two
components impression material (Elite H-D+,
Zhermack Hydrphilic Vinyl Polysiloxane)] (Figure
10A). This works well for short dives like breath
hold dives. If the electrodes are exposed for longer
times like several hours to sea water, we connect the
electrode cables directly to the electrode and seal the
connection with Epoxy (5 min Epoxy, 155105-1,
R&G GmbH, Waldenbuch, Germany).
3.1 Pool Tests
Several tests on apnoe divers were carried out in a
10.5 m deep research pool (Divesystem, Massa
Marittima, Italy).
Figure 10A and 10B: 10A: sealing of the electrodes, 10B:
test dive in the research pool.
For visualisation and analysis of the recorded data a
software was developed under National Instruments
Lab View 7.1 which is also offering several data
processing utilities.
Figure 11: Lab View data visualisation software, in the
upper graph the ECG is visualized, down you can see the
depth profile.
3.2 Long Term ECG Recordings
An adapted version of the system with a to 250 Hz
decreased sampling rate was used to record the ECG
of Francesco Colletta during his world record dive in
Siracusa, Sicily, Italy on September 8th to 9th. The
total dive time was 32h.
Figure 12 A,B: Francesco Colletta after 32h underwater
and our especially for this dive adapted ECG measurement
device (at the end of each of the two black cables one
temperature sensor is encapsulated in epoxy resin).
4 CONCLUSIONS
Research of breath-hold diving induced effects on
the ECG requires a high resolution ECG and depth
storage device. A novel prototype was developed
that is able to store one or two channel ECG with 16
bit resolution at a sample frequency of 1200 Hz on
secure digital memory card. This high sampling rate
is the basis for a precise estimation of the PQ-
interval. The authors are convinced that data gained
from elite apnoe divers during the world
championship in October 2007 in Egypt will lead to
BIODEVICES 2008 - International Conference on Biomedical Electronics and Devices
274

a better understanding of the physiological effects
of breath hold diving.
Other applications of this device are ECG, depth
and temperature recording during SCUBA dives.
5 FUTURE WORK
4 more prototypes will be fabricated to be then
deployed during the AIDA freediving world
championship in October 2007 in Sharm el Sheikh.
An enhanced second version of this prototype is
planned to address SCUBA diving applications. It
will be expanded with the following sensors:
breathing frequency, water temperature, skin
temperature and skin conductivity.
Software will be developed to allow an
automatic measurement of the PQ-interval. This will
be based on triggering on the QRS complex and then
calculating the time to the beginning of the P wave.
REFERENCES
Mayol, J., 2000, Homo Delphinus The Dolphin Within
Man, ISBN 1928649033.
Gooden, B.A., 1994, Mechanism of the human diving
response. Integr Physiol Behav Sci 29: 6–16, 1994
Andersson, J.P.A., Line, M.H., Ruenow, E., Schagatay,
E.K.A.,2002, Diving response and arterial oxygen
saturation during apnea and exercise in breath-hold
divers, J Appl Physiol 93: 882–886.
Marabotti, C., Scalzini, A., Chiesa, F. Bedini, R., Reale,
L., Passera, M. Belardinelli, A. Pingitore, A., Cialoni,
D., Data P.G,2005, Echocardiographic changes
during breath-hold diving, Proceedings of Blue 2005,
Pisa Dec 1-4, 2005, Ed. Star CNR Pisa.
Malmivuo, J., Plonsey, R., 1995, Bioelectromagnetism -
Principles and Applications of Bioelectric and
Biomagnetic Fields, Oxford University Press, New
York.
Atterhög, J., Loogna, E., 1977, P-R interval in relation to
heart rate during exercise and the influence of posture
and autonomic tone, Journal of Electrocardiology 10
(4): 331 – 336.
Busse, M., Nißing, A., Tegtbur, U., Miltzow, S., Thomas,
M., Fikenzer, S., 2004, EKG-Parameter und
Herzfrequenz bei Belastung II. PQ-Zeit und
Herzfrequenz bei Belastung, Klinische Sportmedizin,
KCS 2004, 5(2): 45-49.
Ward, S., Shouldice, R.B., Flanagan, M., Heneghan, C.,
2004, Electrocardiogram Sampling Frequency Errors
in PR Interval Spectral. Analysis, Proc. IEEE
PGBIOMED’04, Southampton, U.K.
Company-Bosch E., Hartmann, E., 2003, ECG Front-End
Design is Simplified with MicroConverter, Analog
Dialogue 37-11.
Josh, Y.V., Dutta Roy, S.C., 1997, Design of IIR Digital
Notch Filters, Circuits Systems Signal Processing,
Vol. 16, NO. 4, 1997, PP. 415-427.
Chivapreecha, S., Dejhan, K., Yimman, S., 2005, Design
of IIR Notch Filter for Removal of Baseline wander
and Power Line Interference from ECG Signal,
ICCAS2005.
Bedini, R., Reale, L., 2003, Rassegna per immagine sulla
Ativita di Biotelemetria nel Diving.
HIGH RESOLUTION ECG AND DEPTH DATA LOGGER - A Novel Device to Study Breath Hold Diving Induced
Variations of the PQ Interval
275
