
METROLOGICAL CHARACTETIZATION OF A
CYCLE-ERGOMETER
Bocciolone Marco, Comolli Lorenzo
Department of Mechanical Engineering, Politecnico di Milano, Via La Masa 34, 20156 Milano, Italy
Molteni Franco
Valduce Hospital, Villa Beretta Rehabilitation Center, Via N.Sauro 17, Costamasnaga (LC), Italy
Keywords: Cycle-ergometer, wireless data transmission, mechanical measurements, data analysis, rehabilitation.
Abstract: A cycle-ergometer has been instrumented with suitable strain gauges to obtain metrological qualified
measurements of the left and right leg torque. A wireless device has been used to transmit in real-time the
gathered signals to the acquisition PC. Advantages are to give to doctors and physiotherapists a diagnostic
tool, to analyze the cycling pattern of the patients and to monitor the improvements during rehabilitation.
The real-time measures are also suitable input data for the Functional Electrical Stimulation (FES). All the
analysis was conducted with a particular attention to spinal cord injured patients, who are characterized by
highly asymmetric cycling: yet, this measurement setup, by independent measurement of right and left
torques, can be used successfully also in this particular situation. An explanation of the measuring principles
and a set of first results are given, that show the potentiality of the setup.
1 INTRODUCTION
The present work is aimed at the metrological
characterization of a commercial cycle-ergometer,
used in clinical and private field, for the
rehabilitation of people who need a motor therapy.
The device shows on a display the mean value of
clinical parameters: subject’s motor power, angular
velocity, energy, right and left leg unbalance. Those
values are computed using electrical quantities from
the motor and the unbalance supposes that one of the
legs is not opposing a relevant resistance to the
motion. These average measurements proved to be
quite accurate on healty subjects, but problems could
arise in the unbalance measurement expecially with
strongly asymmetric spinal cord injured patients.
Indeed, in the standard device, the unbalance is
computed by splitting the revolution in half; but in
asymmetric patients one of the legs typically has a
bigger resistance during flexure respect to extension
(e.g. due to spasticity, contracture or joint
limitation), that could lead to systematic errors. The
proposed measurement of indipendent left and right
torques would solve the problem. An introduction to
the devices can be found in (Comolli et al., 2005).
Moreover the average data on the display are not
saved. To give specialists a better idea of the
rehabilitation of a patient, a recording and tracking
of the data should be done, together with an
a-posteriori appropriate data analysis to quantify the
improvements of the treatment.
Another advantage of having a real time
measurement setup is to provide a proper input to a
Functional Electrical Stimulation (FES) system such
as that in (Ferrante et al., 2005 and 2006).
2 CYCLE-ERGOMETER
INSTRUMENTATION
The employed cycle-ergometer provides the mean
value of the above parameters by using measurement
techniques and data processing that, in particular
working situations (typically asymmetries), could
give unreliable information. In order to overcome
those limitations and to have instantaneous
information, an independent measurement system
has been designed and developed, using mechanical
23
Marco B., Lorenzo C. and Franco M. (2008).
METROLOGICAL CHARACTETIZATION OF A CYCLE-ERGOMETER.
In Proceedings of the First International Conference on Biomedical Electronics and Devices, pages 23-28
DOI: 10.5220/0001052500230028
Copyright
c
SciTePress
sensors. Such system provides the following
quantities:
• bending moments (M
b
) and radial forces
(F
r
) of right and left cranks: through two
Wheatstone full-bridges each made up of
electrical resistance strain gauges;
• angular crank position (
θ): through
optical encoders (Gföhler et al., 2001;
Mimmi, Pennacchi & Frosini, 2004) drawn
with white and black sectors on the main
wheel (see Appendix for additional
solutions).
Strain gauges are sensors suitable for superficial
strain measurements. To measure the bending
moments and radial forces, the gauges must be
positioned in the appropriate position and direction
on the crank, and must be connected on a
Wheatstone full-bridge electrical circuit (made of 4
strain gauges) so that the voltage output is made
proportional only to the selected quantity. An
analysis of the strains present on the crank, subject
to a generic force on the pedal axis, and the
application of the basic laws of the theory of
elasticity, will lead to the conclusion that for the
measurement of the bending moment the sensors
must be positioned near the crank axis, where the
strain is larger, two on the upper and two on the
lower surfaces, with the sensing direction along the
crank longer dimension. The radial forces can be
measured with two opposite strain gauges with the
sensing direction along the crank longer dimension
in a position corresponding to the smaller section;
but to complete the Wheatstone bridge, two more
strain gauges are necessary and they will be
positioned transverse to the former so that they will
sense transverse strain.
The positions on the Wheatstone bridge of each
group of 4 strain gauges are selected such that
compensation of radial forces and bending moments
are achieved respectively in the bridges apt to
measure the bending moment and radial force.
Moreover temperature compensation is achieved
automatically by means of auto-compensated strain
gauges for the crank material (steel) and also thanks
to the full-bridge properties. In this specific
application, the locations of strain gauges are shown
in Figure 4, with the numbers corresponding to
specific positions on the Wheatstone bridge,
according to the conventions of Figure 12. A
detailed description of the applied methods can be
found in Doebelin, 2003, Hoffmann, 1989 and
Cigada, Comolli and Manzoni, 2006.
The strain gauge bridges are conditioned through
a four-channel wireless device, which allows to
transmit the signal from the rotating shaft to the
acquisition system. This solution was selected after
also considering slip rings and capacitive coupling
(Mimmi et al., 2004), both of which required too
much additional space.
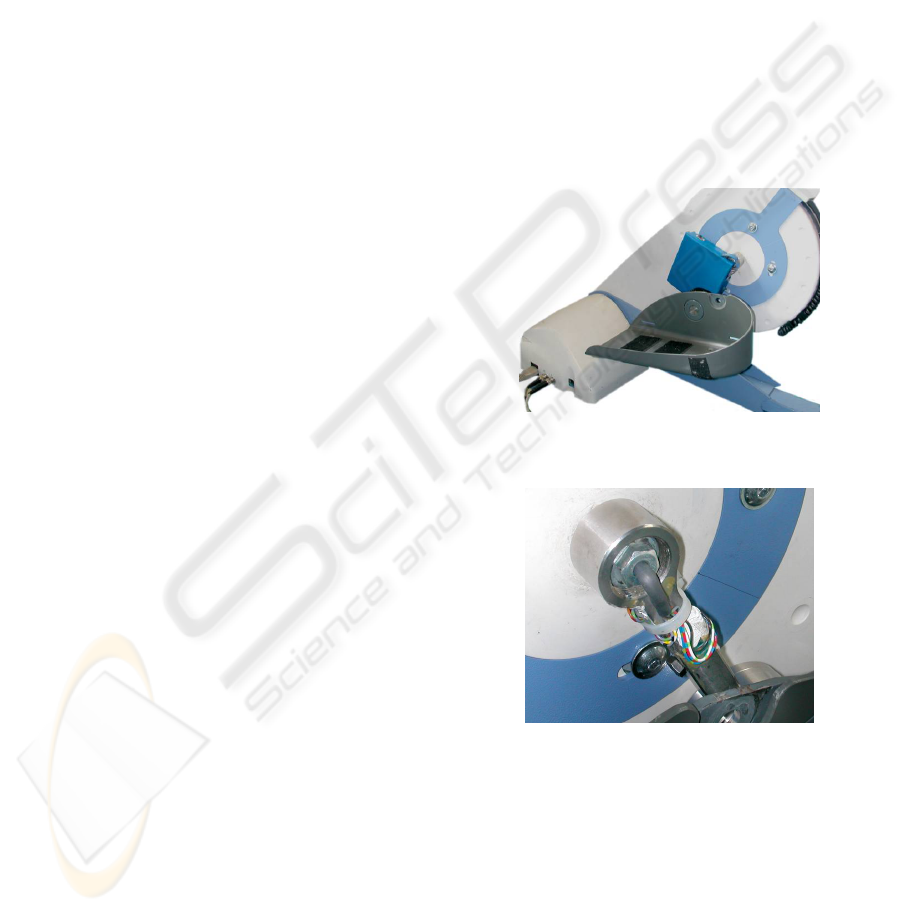
The selected components are very compact: the
wireless device is mounted on the left side crank
inside a metal protection box (
Figure 1); the
connections between the sensors located on the right
and left side of the device are realized by means of a
multi-core cable passing through the crank axis
(Figure 2). The power supply is given by an internal
hi-capacity rechargeable battery that provides up to
9 h working time. The transmitted data are then
converted in analog signals and acquired with a
traditional DAQ board.
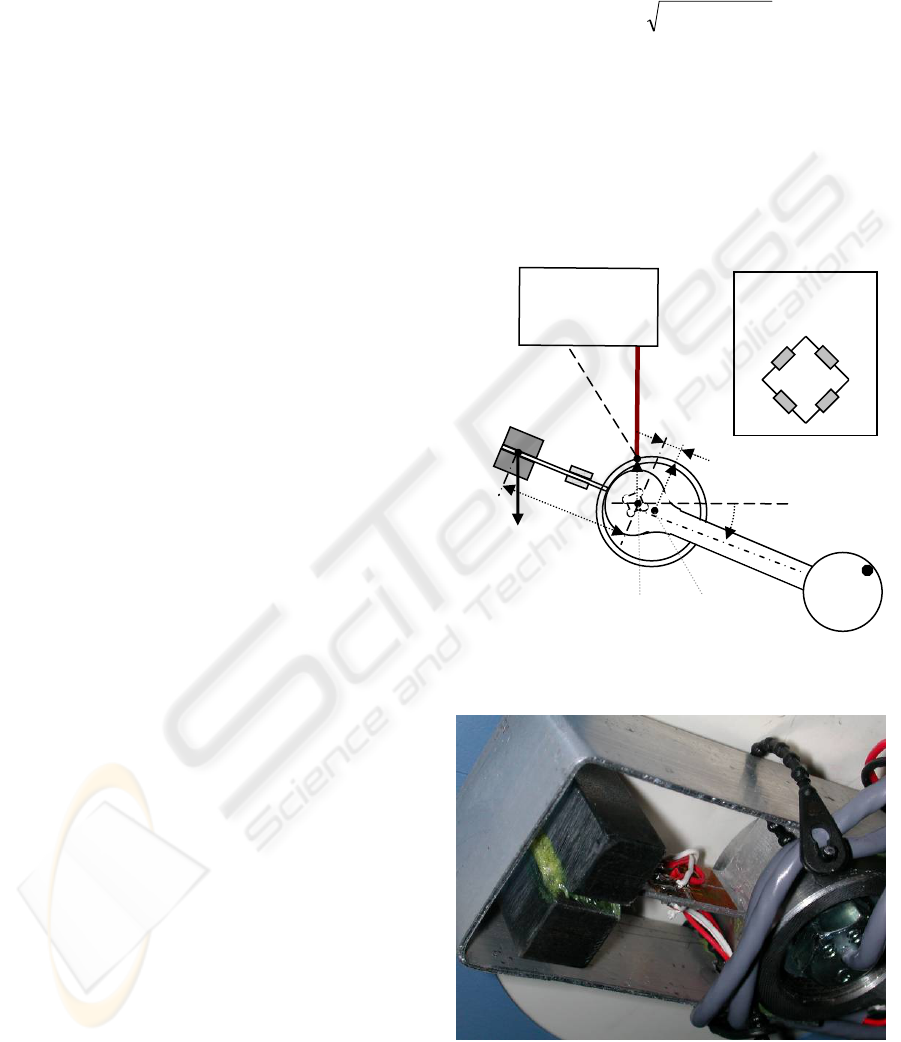
Figure 1: The strain gauge wireless acquisition device is
inside the blue box, mounted on the left crank.
Figure 2:The right crank with the strain gauges wires
passes through the axis to be connected to the wireless
device that is on the other crank.
BIODEVICES 2008 - International Conference on Biomedical Electronics and Devices
24
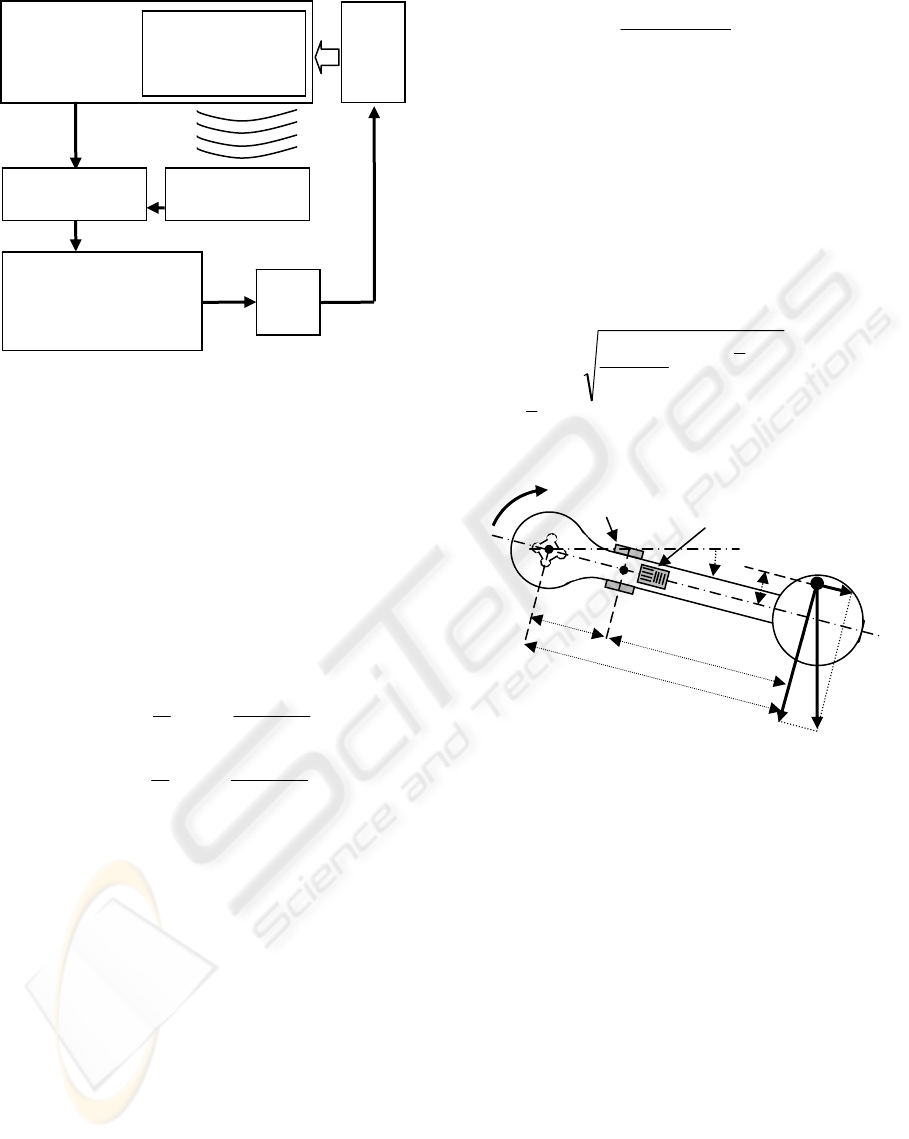
Figure 3: Scheme of the measuring chain and feedback on
the patient.
3 MEASURED QUANTITIES
The measurement setup was designed and developed
in order to identify the torque T as a combination of
the bending moment M
b
and the radial force F
r
(Figure 4).
Known all the dimensions of the crank, the
torques T are given by:
()
()
d
dbe
F
d
b
MT
d
dbe
F
d
b
MT
LrLbL
RrRbR
−
−=
−
−=
,,
,,
(1)
where b, d, e are the dimensions shown in Figure 4,
and L and R pedex are respectively referred as the
left and right leg.
The instantaneous total power P
tot
can be
computed, known the angular velocity
θ
&
measured
by the encoder, as:
()
θ
&
⋅+=
LRtot
TTP
(2)
Moreover the mean energy per revolution can be
computed as:
∫
⋅=
2
1
,
)(
t
t
totm
dttPE
(3)
where t is the time and t
1
and t
2
are the instants of
start and end of a revolution.
The unbalance U, a very significant quantity for
asymmetric patients, can be computed as:
totm
LmRm
E
EE
U
,
,,
−
=
(4)
where a positive value of U mean an unbalance
toward the right leg that is more powerful.
Another useful quantity is the jerk J, i.e. the rate
of change of angular acceleration, which shows the
fluidity of the motion (Schot, 1978 and Teulings et
al., 1997). Absolute jerk is defined as the third
derivative of angular position, while a more
interesting parameter is J
std
, the standard deviation of
jerk computed per revolution:
()
()
∫
−
−
=
=
2
1
2
12
1
t
t
std
dtJJ
tt
J
J
θ
&&&
(5)
where
J is the mean jerk in one revolution.
Figure 4: Scheme of the positioning of strain gauges on
the right crank. For the strain gauges numbering
conventions, see Figure 12.
4 FIRST RESULTS
The identification of the motor strategy of a patient
and the comparison with healthy subjects (or with
the same patient before rehabilitation) is
fundamental to diagnose a pathology and verify the
progress. The modified cycle-ergometer gives to the
doctors and physiotherapist many information: in the
following some examples.
Figure 5 shows a spinal cord injured patient
cycling with the help of FES. Such a patient can
cycle also without FES because the cycle-ergometer
is motorized and maintains a minimum speed. But
the muscles of the insane leg would never make any
work and may loose mass. FES permits also the use
Wireless strain gauges
device:
• 2 bridges for M
b
• 2 bridges for F
r
Receiver and
analog output
Acquisition PC
and FES device
controller
PCI
radio
2.4 GHz
Cycle-ergometer
encoder
signals
(
BNC
)
Acquisition board
USB
FES
controller
Patient
BNC
pedal axis
θ
crank axis
M
b,R
bending moment
strain gauges
T
R
1+3
2+4
b-d
d
b
F
t,R
F
r
,R
F
R
F
r,R
radial force
strain gauges
e
1+2
3+4 opposite
METROLOGICAL CHARACTETIZATION OF A CYCLE ERGOMETER
25
of those muscles and therefore let them grow in size,
even if the patient cannot control them.
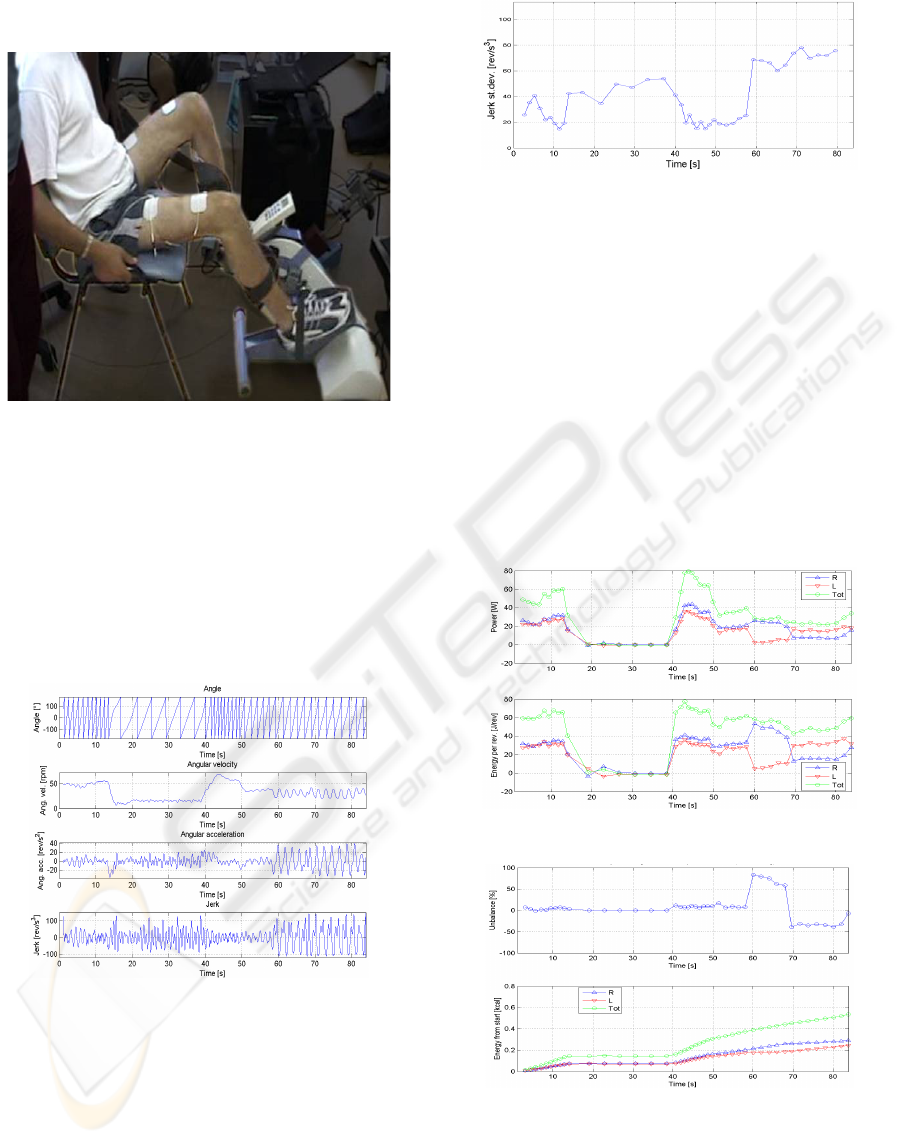
Figure 5: A spinal cord injured patient cycling with the
help of FES.
Figures 6-9 show an example of data that can be
retrieved from the measuring system. A healthy
subject was asked to cycle in different conditions,
such as active (time 0-15 s), passive (15-40 s), active
(40-58 s, various powers), only right leg (58-68 s)
and only left leg (68-82 s).
Figure 6 shows the angular position and the three
derivatives that are necessary to compute all the
subsequent quantities.
Figure 6: Angle and derivatives from cycling data of a
healthy subject in different operating conditions.
In Figure 7 the standard deviation of jerk per
revolution was computed; this quantity has relevant
information: particularly the higher jerk is obtained
when only one leg is used, this is due to the higher
speed variations. Values up to 20 rev/s
3
are normal
for healthy subjects during normal cycling with a
high cycling resistance, while small values such as
2 rev/s
3
can be obtained with small resistance (not
shown).
Figure 7: standard deviation of jerk per revolution: the
biggest values are at right when only one leg was used.
The raw measurements would lead to instantaneous
torque and power plots (not shown), with left, right
and total components. Those information are
interesting but highly difficult to analyze. A better
solution has been found in re-phasing and averaging
the torque values from some adjacent revolutions.
Some examples will be shown ahead.
Average power and energy per revolution are
shown in Figure 8, and give a good idea of the
cycling conditions.
Figure 9 shows the percent unbalance and the
total energy produced by the patient from the start of
the test. Here also very small unbalance will build
up and will be easily visible at the end of the test.
Figure 8: Average power and energy per revolution.
Figure 9: Unbalance and total energy from the start of the
test.
A better way to evaluate the torque produced by the
patient is to re-phase the torque signals and compute
the median value in a number of revolutions. The
median torque (along with percentiles) shows a
BIODEVICES 2008 - International Conference on Biomedical Electronics and Devices
26
better waveform of the cycling and allows a better
comparison between healthy and non healthy
subjects and between the same patient before and
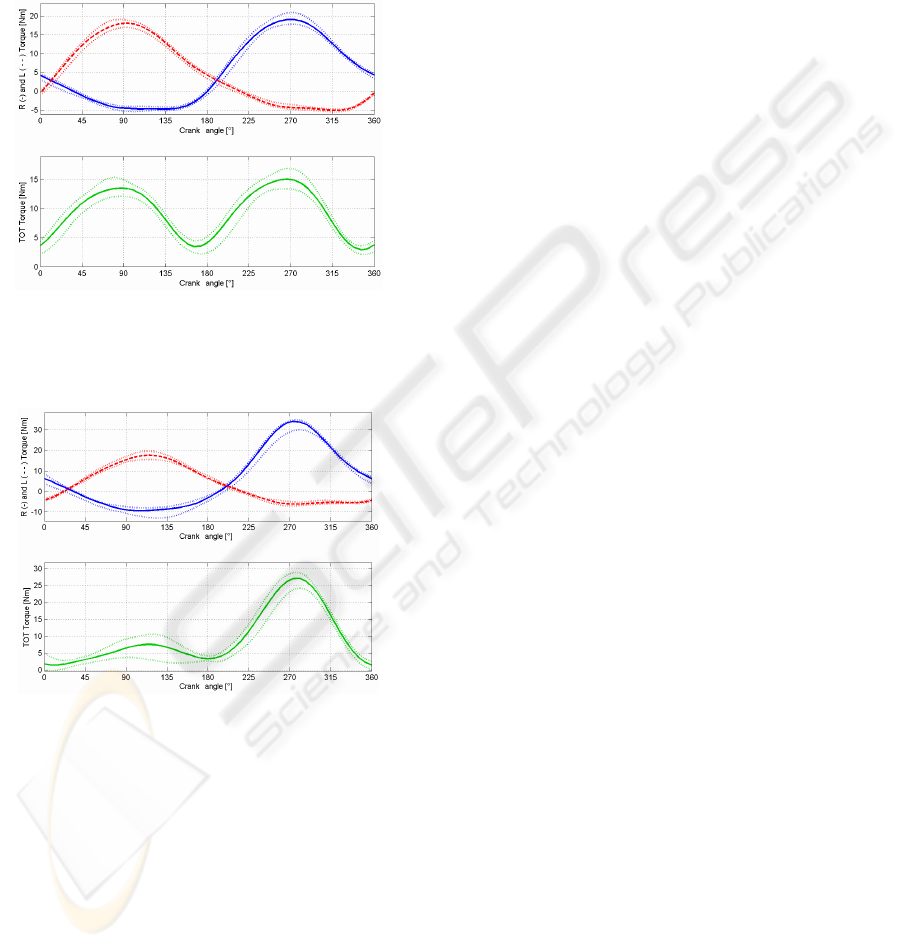
after the rehabilitation. Figure 10 shows the torque
from a healthy subject, while in Figure 11 the same
subject was asked to use only the right leg. The zero
crank angle is set at the maximum flexion of the left
hip.
Figure 10: Median torque from a healthy subject actively
cycling: (a) the left (dashed) and right (solid) components,
(b) total torque that show nearly symmetric peaks. In
dotted line the 5
th
-95
th
percentiles.
Figure 11: Same as the previous figure but related to an
healthy subject, asked to cycle only with the right leg; the
curves show highly asymmetric peaks.
The situation of a healthy subject asked to cycle only
with the right leg simulates only one of the many
possible cases of pathologic patients, where one of
the legs is very weak but not completely passive.
Indeed a healthy subject is unable to perform a true
passive pedaling, as shown in Figure 11(a), where
the left leg curve (dashed) is nearly flat in the
angular range 270-360°, indicating that the weight of
the leg is unconsciously partially compensated.
5 CONCLUSIONS
The paper deals with the design and the realization
of a measurement system able to measure relevant
quantities of the cycling, such as the torque (left,
right and total), power, energy, unbalance and jerk.
The experimental tests involved both healthy
subjects and spinal cord injured patients. Examples
of the obtained measurements had been shown
extensively in the figures. The results obtained up to
now allowed the doctors and physiotherapists to
have at their disposal additional and metrological
qualified information, useful for diagnostic purposes
and for checking the effects of the rehabilitation.
ACKNOWLEDGEMENTS
This work was supported by the Fondazione Cariplo
in the framework of the research program
HINT@Lecco. Authors would like to acknowledge
Mauro Rossini (Villa Beretta Rehabilitation Center)
for his helpful discussion.
REFERENCES
Comolli, L., Cantatore, A., Zappa, E., Bocciolone, M.,
Molteni, F., 2005. HINT@LECCO project:
metrological characterization of a cycle-ergometer,. In
SIAMOC 05, 6th Congress of the Italian Society of
Movement Analysis in Clinics.
Ferrante, S., Pedrocchi, A., Gioia, M., Ferrigno, G.,
Molteni, F., 2005. HINT@LECCO project: FES
cycling optimization and first clinical experiments of
on patients. In SIAMOC 05, 6th Congress of the
Italian Society of Movement Analysis in Clinics.
Ferrante, S., Pedrocchi, A., Ferrigno, G., Molteni, F.,
2006. Experimental campaign of FES cycling on
hemiplegics: first results. In SIAMOC 06, 7th
Congress of the Italian Society of Movement Analysis
in Clinics.
Gföhler, M., Angeli, T., Eberharter, T., Lugner, P., Mayr,
W., Hofer, C., 2001. Test Bed with Force-Measuring
Crank for Static and Dynamic Investigations on
Cycling by Means of Functional Electrical
Stimulation. IEEE Transactions On Neural Systems
And Rehabilitation Engineering, Vol. 9, No. 2, June
2001, pp. 169-180.
Mimmi, G., Pennacchi, P., Frosini, L., 2004.
Biomechanical Analysis of Pedalling for
Rehabilitation Purposes: Experimental Results on Two
Pathological Subjects and Comparison with
Non-pathological Findings. Computer Methods in
Biomechanics and Biomedical Engineering, Vol. 7,
No. 6, Dec. 2004, pp. 229-345.
(a)
(b)
(a)
(b)
METROLOGICAL CHARACTETIZATION OF A CYCLE ERGOMETER
27
Doebelin, E.O., 2003. Measurement Systems, McGraw-
Hill, 5
th
edition.
Hoffmann, K., 1989. An introduction to measurements
using strain gauges, Hottinger Baldwin Messtechnik
GmbH, 1
st
edition.
Cigada, A., Comolli, L., Manzoni, S., 2006. Estensimetria
Elettrica, CittàStudi Edizioni, 1
st
edition.
Schot, S.H., 1978. Jerk: The time rate of change of
acceleration, American Journal of Physics, Nov. 1978,
Vol. 46, Iu. 11, pp. 1090-1094.
Teulings, H.L., Contreras-Vidal, J.L., Stelmach, G.E.,
Adler, C.H., 1997. Parkinsonism Reduces
Coordination of Fingers, Wrist and Arm in Fine Motor
Control, Experimental Neurology, Vol 146, pp. 159-
170.
APPENDIX
For the crank angle measurement, a traditional
encoder solution was chosen using a photo-reflective
sensor coupled with a yet-present encoder drawn on
the main cycle-ergometer wheel. Another two
solutions have been also investigated.
The first solution was an inclinometer able to
measure the bending of a beam with a small mass at
the extreme, by means of strain gauges. The
inclinometer has been positioned on the crank and
have a nearly cosinusoidal output dependent on the
angular position. The measured bending moment is
proportional to the tangential acceleration a
t
of the
mass, which can be computed as:
ρθθ
&&
+= cosga
t
(6)
where g is the acceleration of gravity and ρ is the
distance of the mass from the crank axis (see Figure
12). After the realization of an inclinometer with a
small ρ value (Figure 13), the measurements showed
that the angular acceleration term can be neglected
and so the signal is actually a cosinusoid.
Another consideration is about the thickness of
the beam that should not be too thin, this because a
high natural frequency is desirable; but also not too
thick because the bending must be measurable. The
output signal was gathered with the same strain
gauge wireless device used for moments and forces
measurements, then it is filtered and analyzed to find
the unknown angle. To solve the two solutions
ambiguity of the arccosine function, the first
derivative was considered: a negative value indicate
that the solution is in the first or second quadrant.
Another studied solution takes advantage of a
cam positioned on the crank axis (Figure 12); the
distance of the cam to a fixed point on the
cycle-ergometer was measured by means of a laser
triangulation transducer. The resulting signal is
nearly cosinusoidal and can be analyzed in the same
way of the inclinometer one. In fact the signal is of
this kind:
()
θθθ
sincos
2
2
cc
eRer −+−=
(7)
where r is the distance from the crank axis of a point
on the cam surface that cannot rotate with it, e
c
is the
cam eccentricity and R is the cam radius. With the
proper selection of the dimensions, the cosinusoid
approximation can give as low as ±5° errors, as in
the realized cam.
All the described measurement solutions were
successfully used and proved to be of interest when
no simpler alternatives are possible.
Figure 12: Scheme of the inclinometer and the cam
mounted on the crank.
Figure 13: The adopted inclinometer.
Ca
m
Q
θ
r(
θ
)
Cran
k
R
e
c
Pedal
axis
F = mg
2+4
strain
gauges
1+3
Inclinometer
m
1 2
34
Strain gauges
Wheatstone bridge
conventions
Laser triangulation
distance sensor
Laser
beam
ρ
Cran
k
axis Cam cente
r
BIODEVICES 2008 - International Conference on Biomedical Electronics and Devices
28
