
THRESHOLD LOGIC GENE REGULATORY MODEL
Prediction of Dorsal-ventral Patterning and Hardware-based Simulation of
Drosophila
Tejaswi Gowda, Samuel Leshner, Sarma Vrudhula
School of Computing and Informatics, Arizona State University, Tempe, AZ.
Seungchan Kim
Division of Computational Biology, Translational Genomics Research Institute, Phoenix, AZ.
Keywords:
Gene Regulation, Threshold Logic, Drosophila embryo patterning, Modeling and Simulation of Gene Systems.
Abstract:
Precise characterization of gene regulatory mechanisms is a fundamental problem in developmental biology.
In this paper we present a new gene regulatory network (GRN) model which is based on threshold logic (TL).
Two different set of genes are responsible for the cell patterning of the Drosophila embryo. By using the
proposed threshold logic gene regulatory model (TLGRM), we derive the different gene regulatory rules for
the gene products involved. We use these rules to model and explain the interaction between the genes. Very
large or complex gene regulatory networks are difficult to simulate using a general purpose CPU. Specialized
programmable hardware provides additional concurrency and is an alternative to a large and expensive cluster
of machines. The steady state gene expression predicted by the model clearly mimics the actual wild-type
gene expression along the dorsal-ventral axis in the Drosophila embryo. We thus demonstrate that for a
well characterized gene regulatory system, the nature and topology of interaction is enough to model gene
regulation. We also demonstrate through proof of concept that using hardware-based simulation, it is possible
to achieve orders of magnitude of performance improvement over conventional CPU-based simulation.
1 INTRODUCTION
Understanding how different genes interact with each
other to give rise to the different cell types in an organ-
ism is an active area of research in development biol-
ogy (Albert and Othmer, 2003). The human genome
project was the first step in this direction (Collins
et al., 2003). Now that the methods for gene sequenc-
ing have greatly improved (Heller, 2002) it is possi-
ble to obtain huge amounts of gene expression data.
This data can be analyzed and interpreted to obtain
the different regulatory interactions (activation and
inhibition) between different gene products (mRNA,
protein and protein complexes). Models from math-
ematics and computer science have are been used
to model the interaction of genes (Dougherty et al.,
2007) There are two types of gene regulatory mod-
els. One assumes the expression of the gene products
to be continuous functions which interact with each
other in continuous time (e.g: (Gursky et al., 2001),
(Reinitz and Sharp, 1995)). Another group of mod-
els assume that gene expression takes place in dis-
crete levels and gene interaction takes place in dis-
crete time (e.g: (Shmulevich et al., 2002), (Albert and
Othmer, 2003), (Kauffman, 1993)). The challenge
is to come up with a model that captures the tempo-
ral and spatial characteristics of gene regulation, and
which is easy to construct and simulate. It is generally
agreed that merely specifying the type of interaction
between genes is not enough to characterize gene reg-
ulation (Albert and Othmer, 2003). In this work we
try to show that for at least two gene regulatory sys-
tems knowing the kind of interaction between genes
will suffice to construct an expressive model which
can mimic the actual biological process. For the em-
bryo patterning problem that is considered in this pa-
per, we assume a fixed number of discrete levels of
expression for gene products. This approach is well
suited for this purpose as once the gene is either ex-
pressed or not expressed in a cell, it remains that way
to enable the cell to develop towards its determined
fate.
Although the Drosophila embryo patterning problem
presented in this work uses only a general purpose
212
Gowda T., Leshner S., Vrudhula S. and Kim S. (2008).
THRESHOLD LOGIC GENE REGULATORY MODEL - Prediction of Dorsal-ventral Patterning and Hardware-based Simulation of Drosophila.
In Proceedings of the First International Conference on Biomedical Electronics and Devices, pages 212-219
DOI: 10.5220/0001054302120219
Copyright
c
SciTePress
CPU for simulation, simulation of large GRNs cannot
be done without a large cluster of CPUs. We propose
an inexpensive hardware-based simulation technique
for GRNs using specialized field-programmable gate
arrays.
In (Albert and Othmer, 2003) it is shown that
by using two discrete states of gene expression and
Boolean logic for gene regulation rules it is possible
to explain the action of segment polarity genes in the
creation of segments along the anterior-posterior axis
of a Drosophila embryo. While it has been demon-
strated that Boolean logic rules are enough to describe
gene interaction, there is little understanding on how
to construct Boolean rules for a generic gene regula-
tory system. We propose that the Boolean rules used
in gene regulation belong to a special class of func-
tions called threshold functions. These functions are
a subset of Boolean functions. Using this small subset
of functions we derive regulatory relationships from
the gene interaction graph. We then demonstrate that
it is possible to model the interaction of two differ-
ent sets of genes with these rules. These genes are
responsible for the dorsal-ventral patterning and seg-
ment formation along the anterior posterior axis of the
Drosophila embryo.
A threshold element (TE) has n binary inputs, x
1
,
..., x
n
, and a single binary output, y. Its internal pa-
rameters are a threshold T and weights w
1
, ..., w
n
,
where each weight w
i
is associated with x
i
. The val-
ues of T and w
i
(i = 1, ..., n) may be any real num-
bers (Dertouzos, 1965; Winder, 1965). The input-
output relation of a TE is defined as follows:
y =
1 if
∑
n
i=0
w
i
x
i
≥ T
0 otherwise
(1)
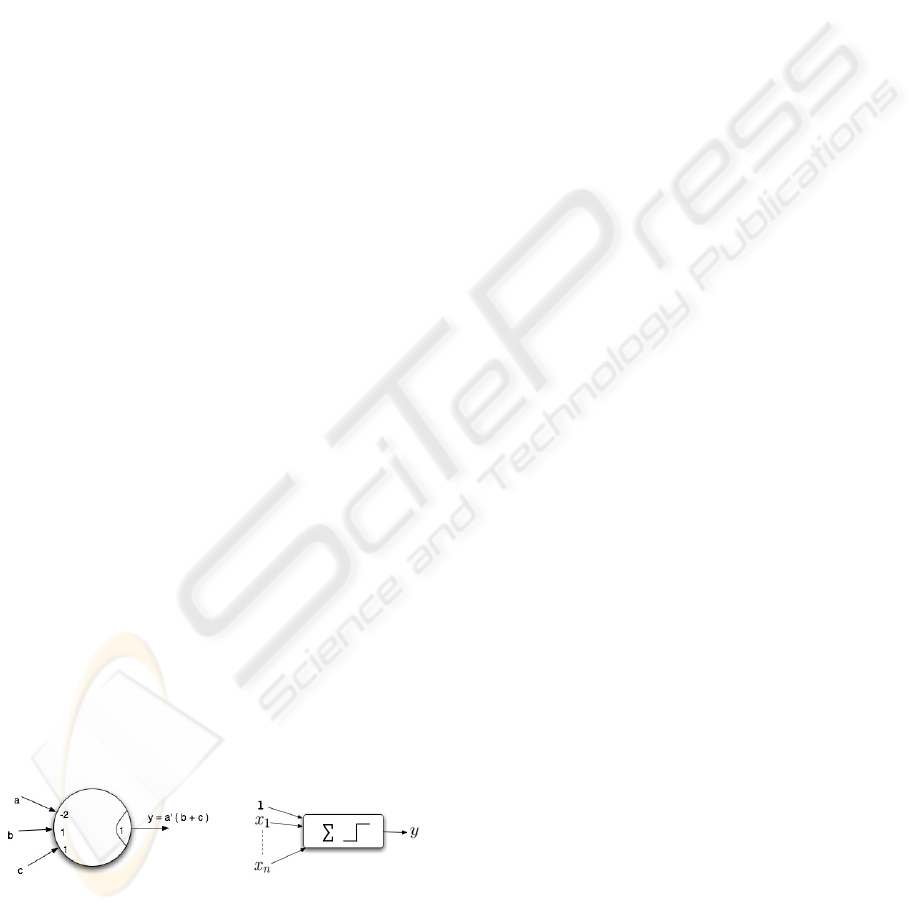
The weighted sum in Equation (1), denotes arithmetic
summation. Example: Figure 1 shows a threshold
element that implements the Boolean function y =
a
0
(b + c). Input a, b, c are assigned the weights −2, 1
and 1 respectively and the threshold (T ) is assigned
the value of 1. It can be seen that the logic function
realized by this threshold element is y = a
0
(b + c).
Figure 1: A threshold element. Figure 2: A perceptron.
Boolean AND and OR functions are threshold (Der-
touzos, 1965). Threshold elements are also ca-
pable of implementing complex Boolean functions.
e.g: ab(c + d) + cd(a + b). However, it should be
noted that a single TE cannot represent all Boolean
functions, as not all Boolean functions are thresh-
old (Muroga, 1971; Kohavi, 1970). The TE is sim-
ilar to a single perceptron (commonly encountered
in neural network literature) with the step function as
the activating function (Russell and Norvig, 2003), as
shown in Figure 2.
Simulation on a large gene regulatory network can
be a slow, computation-intensive process, largely due
to the fact that a general purpose CPU can only per-
form so many operations at one time (DeHon, 1996).
Consider the sequence of events the CPU must per-
form to compute the next state for each gene product
in the network. The CPU must first obtain a copy of
the current state of every gene product in the simula-
tion. Next the updating rules are applied to each gene
product in the simulation sequentially, using the cur-
rent states of the gene products as inputs. Each next
state computation requires one or more instructions,
depending on the rule being applied. Each next state
that is computed must also be saved. Once all next
state computations are complete, the current states are
replaced with the next states and the process repeats.
The total time t required by the CPU for each time
step in the simulation is given in Equation (2), where
t
instruction
is the time per instruction, n
instruction
is the
average number of instructions per next state compu-
tation, and n
gene
is the number of gene products in the
simulation.
t = (t
instruction
)(n
instruction
)(n
gene
) (2)
This is a highly inefficient method of simulation.
Since the next state computation of each gene prod-
uct depends only on the current states of the other
gene products in the simulation, it should be possible,
given the proper resources, to update all gene prod-
ucts in parallel. This can be achieved using a special-
ized field-programmable gate array.
The field-programmable gate array, or FPGA, is
composed of a matrix-like arrangement of config-
urable logic blocks, or CLBs, which are joined to-
gether by interconnect resources (Brown, 1992). The
CLBs and interconnect can be programmed via on-
chip memory to realize any design that it possesses
the resources to implement. Figure 3 shows the con-
ceptual FPGA architecture.
If the number of input parameters in the next state
computation of a single gene product is reasonably
low, the next state computation for a single gene prod-
uct can be implemented and synchronized using a sin-
gle CLB. Configurable logic blocks synchronized us-
ing the same clock signal operate in parallel, thus us-
ing a specialized FPGA the next states of all gene
THRESHOLD LOGIC GENE REGULATORY MODEL - Prediction of Dorsal-ventral Patterning and Hardware-based
Simulation of Drosophila
213

Figure 3: Conceptual FPGA architecture.
products can be computed simultaneously and then
synchronized for use in the next time step.
The total time required by the FPGA for each
time step is thus given solely by the inverse of the
maximum operating frequency, given by the worst-
case next state computation delay for the slowest
gene product in the simulation. The dependence on
the number of gene products in the simulation is no
longer a factor in the delay per time step. Despite the
fact that FPGAs typically operate at frequencies sev-
eral times lower than that of a general purpose CPU,
the elimination of this dependence can improve the
speed of the simulation by orders of magnitude for
large gene regulatory networks.
FPGAs are thus capable of reducing the amount
of real time required to complete a single simulation
by computing the next state of all gene products con-
currently, however the FPGA’s advantage of parallel
computation does not stop at the system level. Given
enough resources, multiple copies of a complete sys-
tem model can be mapped to the FPGA and simu-
lated concurrently, increasing performance yet again
by a factor equivalent to the number of simulations
running in parallel.
2 APPROACH
The motivation for using threshold logic comes form
the “French flag” model of cell pattern forma-
tion (Wolpert et al., 2002). A chemical whose con-
centration varies over a region, and is responsible for
cell patterning is called a morphogen (Wolpert et al.,
2002). A morphogen can create different cells be-
cause its concentration varies from cell to cell. The
morphogen diffuses from the source (region of high
concentration) to the sink (region of lower concen-
tration). The concentration of the source and sink is
constant and hence the gradient is maintained.
The cells derive positional information from one
or more morphogens before differentiating into a par-
ticular type of cell. Threshold logic naturally sup-
ports this kind of multiple logic levels. The weighted
sum
∑
n
i=0
w
i
x
i
in Equation 1 can be compared against
(n − 1) thresholds to generate an output of n levels.
e.g: If the weighted sum is compared against one
threshold we get binary output and if it’s compared
against two thresholds we get ternary output, and so
on. Threshold logic works in the same way irrespec-
tive of the number of levels. This is not true for
Boolean logic.
Another reason to use threshold rules is because
there are only two types of actions that one gene prod-
uct can have on another – activation or inhibition. Ac-
tivation can be thought of as a positive influence and
inhibition as a negative influence. In a threshold func-
tion, these two kinds of influences can be modeled
by the polarity of the input weight. We use a pos-
itive weight for activators and a negative weight for
inhibitors. It is also known that for some genes the
action of inhibitors is stronger than that of the activa-
tor. This can be easily represented in the model by
assigning different magnitudes of positive and nega-
tive weights.
The impact of different activators and inhibitors
can be incorporated into the model by using different
weights. Example: If g
a
has greater impact on on g
z
than g
b
, then in the TE for g
z
, w
g
a
> w
g
b
.
As shown later, these observations lead us to for-
mulate simple guidelines that can be used to derive
the TL rules for gene regulation. This rule generation
is simpler than generating Boolean rules. In the rest
of the paper we introduce the new model and demon-
strate its usefulness by using it to model pattern for-
mation in the Drosophila embryo.
The configurable logic block is a programmable
cell designed to implement all or part of the next state
computation for a single gene product, and then syn-
chronize the output for use in the next time step.
A standard CMOS implementation of the config-
urable logic block is shown in Figure 4. This is a
simple modified version of the CLB used in most
general purpose FPGAs, tailored specifically for per-
forming and synchronizing next state computations
for individual gene products. The unnecessary flex-
ibility added by more general purpose designs has
been removed, yielding a faster, more area efficient
functional unit. Inputs in the figure represent the cur-
rent states of the gene products that promote or in-
hibit the expression of the gene product the CLB rep-
resents. The next state of the gene product the CLB
represents is observed at the output.
The CLB is composed of two primary compo-
nents: the lookup table, which provides the next state
computation, and the flip-flop, which provides syn-
chronization. The lookup table observes the unique
combination of logic states on all of its inputs (1 =
expressed, 0 = unexpressed) and accesses a single bit
BIODEVICES 2008 - International Conference on Biomedical Electronics and Devices
214
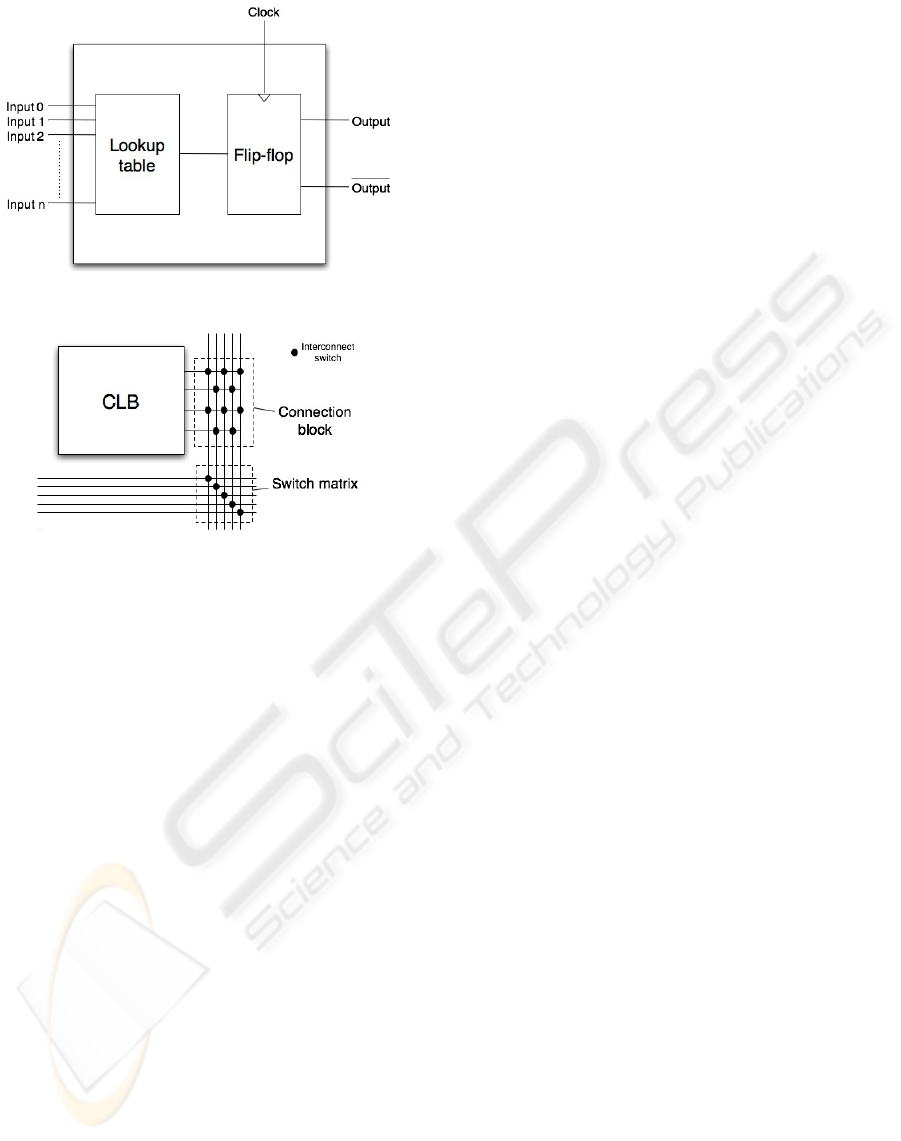
Figure 4: Component-level CMOS implementation of n-
input configurable logic block.
Figure 5: Connection block and switch matrix interconnect
components.
entry in an array stored in memory, containing the de-
sired output (Francis, 1992). This value is passed as
input to the flip-flop which updates its output with the
same value and maintains it until the next time step.
Interconnect is used to join configurable logic
blocks together into one cohesive, functionally cor-
rect system. There are two types of interconnect com-
ponents that are of major importance, the connection
block and the switch matrix (Brown, 1992). Both of
these components are featured in Figure 5.
A connection block is a collection of switches that
directly connect the CLBs to the segments of the in-
terconnect. As the figure indicates, connection blocks
are located adjacent to CLBs on the FPGA.
A switch matrix is a collection of switches that
connect segments of the interconnect to each other.
As the figure indicates, switch matrices are located
where groups of perpendicular wire segments inter-
sect on the FPGA. Each wiring segment that enters a
switch matrix can connect to up to three others.
Preparing a field-programmable gate array for
simulation consists of three separate steps. First, each
of the gene products in the model is assigned to one or
more of the available CLBs. Second, the components
of the interconnect are configured to determine the in-
teraction between the CLBs. Finally, the complete
placement and routing scheme is replicated to max-
imize the usage of the FPGA’s available resources.
Gene products are assigned to configurable logic
blocks with the modular structure of the system in
mind. This is especially important when the GRN
models multicellular interactions. The following rout-
ing assumptions are made when assigning gene prod-
ucts to CLBs:
• The majority of interactions take place between
gene products within the same cell.
• Some interactions are expected to take place be-
tween gene products of adjacent cells.
• Few (if any) interactions occur between gene
products of distant cells.
Using these assumptions, a system can be decom-
posed in modules of cells, and modules of cells into
individual gene products. Cells are organized into a
uniform arrangement of CLBs so that they will be
able to fit together easily with adjacent cells. Like-
wise, complete systems are organized into a uniform
arrangement of cells so as to maximize the number of
simulations that will be able to run concurrently on
the FPGA.
Since nearly all interactions take place within a
single cell or between adjacent cells, interconnect
programming relies on direct connections and short
wire segments to assemble disconnected CLBs into a
fully functioning system.
3 METHODS
Drosophila is one of the best understood of all devel-
opmental systems at the genetic level (Wolpert et al.,
2002). Drosophila, like many other insects starts its
life as an egg, develops into a larva and then un-
dergoes metamorphosis to become an adult. We are
mostly interested in the embryonic gene regulation
that determines the biological fate of the different re-
gions of the embryo. Like all animals with bilateral
symmetry, Drosophila is patterned along two distinct,
independent axes: the anterior-posterior axis and the
dorsal-ventral axis (Wolpert et al., 2002).
Early Drosophila embryo patterning occurs within
a multi-nucleate syncytial blastoderm. This is formed
because of repeated rounds of nuclear division with-
out any cytoplasmic division (Wolpert et al., 2002).
The absence of cells in the early embryo is really
important, because the mRNA and proteins can now
diffuse easily throughout the embryo. This diffu-
sion creates a concentration gradient of different tran-
scription factors and morphogens. The interaction
between different gene products creates a sharp and
stable concentration gradient of proteins. The pres-
ence or absence of certain proteins determine the fate
THRESHOLD LOGIC GENE REGULATORY MODEL - Prediction of Dorsal-ventral Patterning and Hardware-based
Simulation of Drosophila
215
of the cell (when cellularization occurs). The con-
centration gradient of maternal mRNA and proteins
is known (Wolpert et al., 2002; Roth et al., 1989).
The interaction between the different gene products
that determine the dorsal-ventral patterning is also
known (Wolpert et al., 2002). We make use of this
data to build a threshold logic model of gene interac-
tion. We simulate the rules we generate making use
of the concentration gradient of the maternal proteins
as the initial state. The maternal proteins are the pro-
teins generated by maternal genes. Maternal genes
are the genes expressed in the mother fruit fly and not
the fertilized egg (Wolpert et al., 2002).
Patterning along the axes is similar to the French
flag patterning problem described earlier. The expres-
sion of zygotic genes in localized regions differenti-
ate the cells in the embryo. These different cells de-
termine the germ layers that will eventually develop
out of them. This patterning starts when the embryo
is still a syncytial blastoderm. So the concentration
of the proteins we specify corresponds to the inter-
nuclear concentration. There is a high concentration
of maternal dorsal protein in the nuclei found in the
ventral region (Roth et al., 1989). This concentration
falls rapidly in the dorsal region.
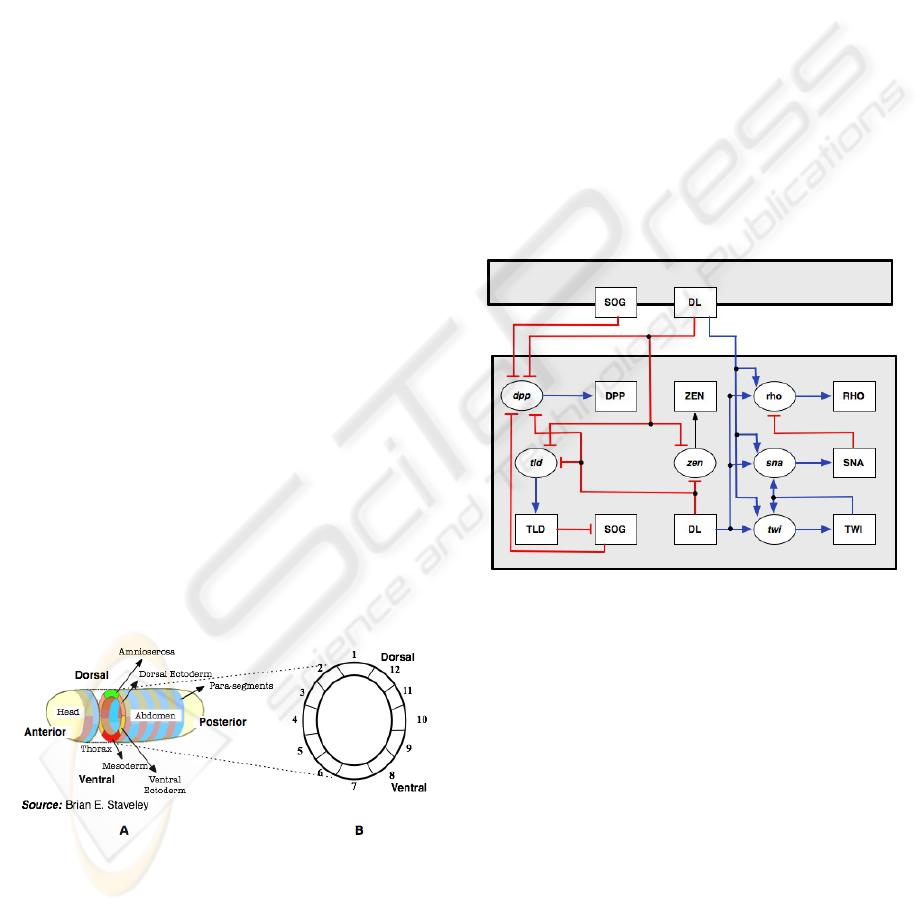
3.1 TLGRM for D-V Patterning
Since early embryonic patterning is essentially two
dimensional, we abstract the dorsal-ventral axis of
the embryo into twelve regions. This patterning takes
place in the blastoderm, which is syncytial before cel-
lularization takes place. The blastoderm has the cells
concentrated in the periphery leaving a hollow in the
center. This abstraction of the dorsal-ventral embry-
onic tissue is shown in Figure 6 (B).
Figure 6: (A): The two axes of a Drosophila. embryo. (B):
For modeling purposes the D-V section of the embryo is
assumed to be made of twelve regions.
Genes which participate in the determination of the
dorsal ventral patterning influence the expression of
each other via the proteins they synthesize. The dor-
sal (dl) protein initiates a complex gene interaction
process that culminates in the formation of well de-
fined regions in the dorsal-ventral axis. Going from
ventral to dorsal, the major regions are mesoderm,
ventral ectoderm, dorsal ectoderm, and amnioserosa
(Figure 6 (A)). The nuclear gradient of the dorsal pro-
tein in the blastoderm decreases exponentially from
the ventral to the dorsal end of the embryo. The con-
centration of the dorsal protein is divided into 3 dis-
crete levels (−1, 0, 1).
We now describe the genes that are involved in the
dorsal-ventral (D-V) patterning and how they interact
with each other. The dorsal protein as mentioned ear-
lier is probably the most important protein involved
in the D-V patterning. The other genes involved are
twist(twi), snail(sna), rhomboid(rho), tolloid(tld), de-
capentaplegic(dpp) and zerkn
¨
ullt(zen). These genes
respond to the concentration of dorsal protein in a
threshold like manner because of the presence of
high- and low-affinity binding sites for the dorsal pro-
tein in their regulatory regions (Wolpert et al., 2002).
Figure 7: The gene interaction graph representing the reg-
ulatory interaction between the gene products that are re-
sponsible for the D-V patterning in Drosophila.
The interaction between these genes can be repre-
sented by a gene interaction graph (Figure 7). The
nodes of this graph represent mRNA and proteins.
The mRNA nodes are elliptical in shape and the pro-
tein nodes are rectangular. Protein nodes are la-
beled in capital letters and the mRNA nodes are la-
bels in small letters. An arrow (→) is used to rep-
resent activation and a t-connector (a) represents in-
hibition. The gray box which contains all the pro-
tein and mRNA nodes represents the boundary of the
region (one of twelve regions in the blastoderm tis-
sue shown in Figure 6 (B)). Since the gene products
usually diffuse to neighboring regions, the gene prod-
ucts in one region can interact with the gene products
of the neighboring regions (e.g: Gene products in re-
gion 1 can interact with the gene products in regions
BIODEVICES 2008 - International Conference on Biomedical Electronics and Devices
216
2 and 12 and vice versa). This is represented by the
regulatory interactions (arrows and t-connectors) that
span in between the boundaries of two neighboring
regions. The complete gene interaction graph for the
D-V patterning is shown in Figure 7. This graph was
constructed by using the information about the reg-
ulatory interactions between mRNA and proteins ex-
plained previously.
Using this gene interaction graph we formulate the
threshold logic rules, using the following guidelines:
1. The weights and threshold are restricted to inte-
gers to simplify rule generation. However, this
does not limit the expressiveness of threshold
logic (Muroga, 1971).
2. Genes and gene products that act as promoters are
assigned positive weights. Inhibitors are assigned
negative weights.
3. Dependent gene products are selected from the
gene interaction graph (Figure 7). e.g: Expression
of sna is dependent on DL and TW I.
4. Since in general inhibition is stronger than activa-
tion, inhibitors have a higher absolute weight than
activators.
5. Weight assignments are modified so that the re-
sults match with biological observation.
Rule generation example:
The rule generation procedure is explained in detail
for the rho mRNA. rho is activated by DL protein in
the same region, and the DL protein in the two neigh-
boring regions (Figure 7). It is inhibited by the SNA
protein. We assign weight of +1 for each of the three
activators (DL protein in the region, and DL protein
in the neighboring regions). We set the threshold to
1 as rho is activated when any one of the activators is
present. We assign a weight of −3 to SNA (inhibitor).
This weight is enough to negate the effect of all the
three activators. We denote this rule as follows:
rho
i
t+1
= [DL
i−1
t
= +1, DL
i
t
= +1, DL
i+1
t
= +1, SNA
i
t
= −3; T = 1].
In this notation, the subscript refers to the cell num-
ber and the superscript refers to the time step in the
model simulation. Each region has a discrete expres-
sion value for every gene product. The cell numbers
are in the range 1 to 12. After 12, we start over with
1, as we have modeled the dorsal-ventral embryonic
section as twelve regions that are arranged in a cy-
cle. These regions are numbered in the counter clock-
wise direction from 1 to 12. Therefore we can now
specify the cells that are adjacent to cell number 1 as
(1 + 1) = 2 and (1 − 1) = 12.
Rules are generated for each gene product. These
rules are then simulated in discrete time. This is dis-
cussed in the results section.
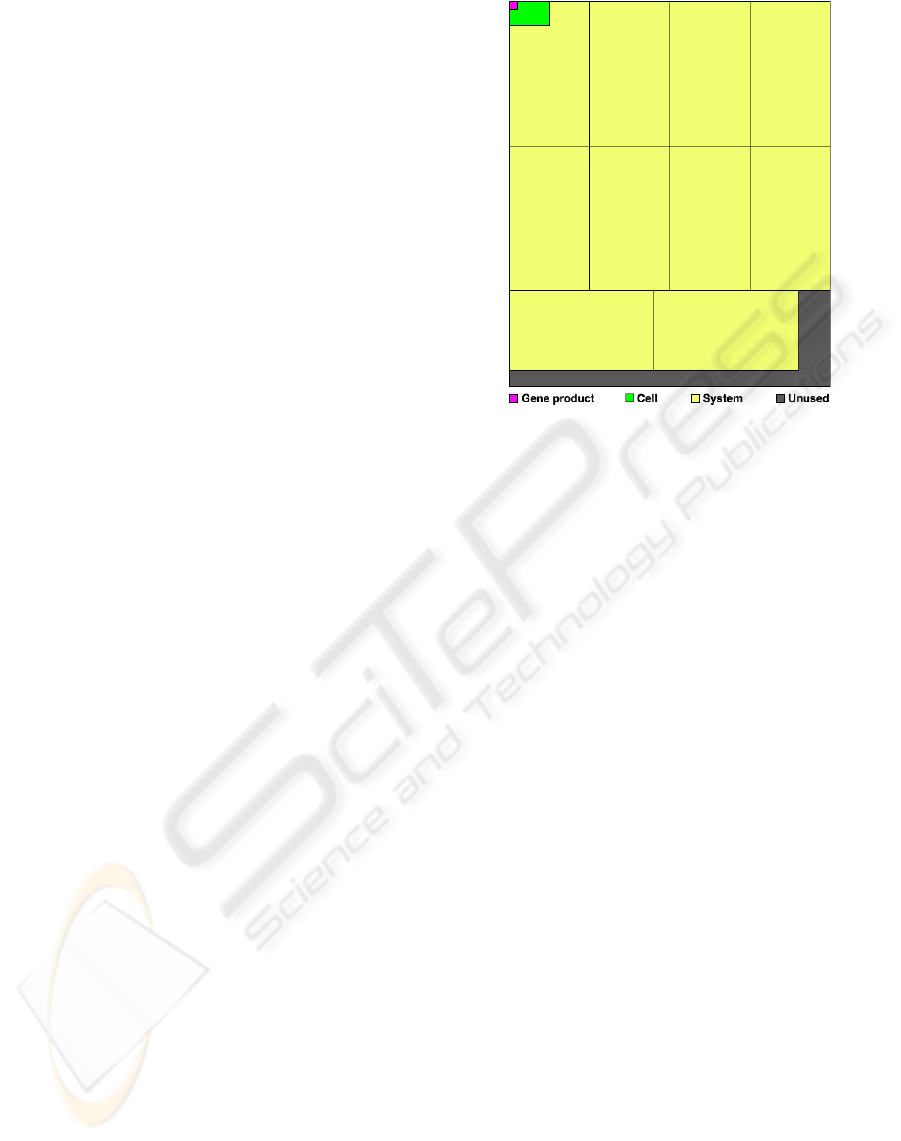
Figure 8: Map of allocated resources for simulation of ex-
pression pattern of the dorsal-ventral patterning genes of
Drosophila melanogaster. on a 48x40 CLB FPGA.
3.2 Hardware Based Simulation
As we can observe from the topology of the interac-
tion graph, each cell in the system is represented by 14
different gene products. Most interactions take place
between products within an individual cell, with some
intercellular interactions taking place between adja-
cent cells involving the SOG and DL proteins.
To map an individual cell to the FPGA, at least 14
configurable logic blocks are required. An area of 3x5
CLBs is chosen in which to allocate the gene prod-
ucts. A rectangular cell mapping is desirable since it
allows multiple cells to fit together easily on the board
without creating large “holes” of unused blocks. Min-
imization of the cell perimeter is also desirable, as it
often reduces routing distances between both blocks
within the cell and blocks of adjacent cells.
The complete system for the dorsal-ventral pat-
terning genes is modeled by 12 cells in a cyclical
structure. This system is mapped to the FPGA as
block of cells two cells wide and six cells deep. A
cyclical model is fairly easy to place and route, as
each cell in the model has only two adjacent cells.
Depending on size and complexity of both the
gene regulatory network and the FPGA being uti-
lized, there may be unused resources remaining on
the FPGA after mapping of the complete system. If
enough unused resources are available, one or more
copies of the system may be placed on the board and
simulated concurrently, decreasing the effective real
time required to simulate each time step by a factor
equivalent to the number of systems on the FPGA.
THRESHOLD LOGIC GENE REGULATORY MODEL - Prediction of Dorsal-ventral Patterning and Hardware-based
Simulation of Drosophila
217

Figure 8 shows the results of mapping to the
FPGA at the gene product, cell, and system levels. As
the figure indicates, each cell contains 14 gene prod-
ucts, each system contains 12 cells, and the 48x40
CLB board is large enough to accommodate 10 in-
dependent simulations. Complete systems are sim-
ulated independently and do not interact with each
other, therefore it makes no difference where they are
placed on the FPGA relative to each other as long as
they do not overlap.
4 RESULTS
Using the “guidelines” proposed earlier, the threshold
logic rules for each gene product are derived. The
rules for all the gene products involved with dorsal-
ventral patterning are as follows :
• rho: rho
i
t+1
= [DL
i−1
t
= +1, DL
i
t
= +1, DL
i+1
t
=
+1, SNA
i
t
= −3;T = 1].
• twi: twi
i
t+1
= [TW I
i
t
= +2, DL
i−1
t
= +1, DL
i
t
=
+1, DL
i+1
t
= +1;T = 3].
• sna: sna
i
t+1
= [TW I
i
t
= +2, DL
i−1
t
= +1, DL
i
t
=
+1, DL
i+1
t
= +1;T = 3].
• dpp: d pp
i
t+1
= [SOG
i−1
t
= −1, SOG
i
t
=
−1, SOG
i+1
t
= −1, DL
i−1
t
= −1, DL
i
t
= −1, DL
i+1
t
=
−1;T = −1].
• tld: tld
i
t+1
= [DL
i−1
t
= −1, DL
i
t
= −1, DL
i+1
t
=
−1;T = 0].
• zen: zen
i
t+1
= [DL
i−1
t
= −1, DL
i
t
= −2, DL
i+1
t
=
−1;T = 2].
• RHO : RHO
t+1
= [rho = +1; T = 1]
• TW I : TW I
t+1
= [twi = +1; T = 1]
• SNA : SNA
t+1
= [sna = +1; T = 1]
• ZEN : ZEN
t+1
= [zen = +1; T = 1]
• DPP : DPP
t+1
= [d pp = +1; T = 1]
• TLD : T LD
t+1
= [tld = +1; T = 1]
We know the original concentration gradient of DL
(expressed ventrally and concentration decreases dor-
sally). We also know that the SOG protein is found
in the middle regions (Wolpert et al., 2002). The ex-
pression of these proteins is assumed to be constant
throughout the process of pattern formation, since
these proteins are not affected by the other gene prod-
ucts that we consider. The other gene products are
assumed to be uniformly unexpressed at t = 0.
Starting from the initial state we simulate the
threshold logic rules in discrete time steps. The steady
state is attained in the dorsal-ventral simulation af-
ter about five time steps. This steady state gene ex-
pression is shown in Figure 9. We now interpret this
steady state expression and predict if this indicates
prospective germ layer formation. The position of the
different germ layers along the dorsal-ventral axis is
shown in Figure 6.
The ventral-most stripe of cells form the meso-
derm (Wolpert et al., 2002). Twist and snail genes are
activated in this region. Both these proteins are nec-
essary for the formation of mesoderm (Wolpert et al.,
2002). Our model also predicts that both twi and sna
are expressed in the ventral regions (Figure 9 (B)).
Rhomboid is activated in the cells that form the fu-
ture neurectoderm (ventral ectoderm) (Wolpert et al.,
2002). The region in which the model predicts the ex-
pression of rho is exactly where the ventral ectoderm
develops (Figure 9 (D)).
The dpp gene is expressed in the dorsal-most region;
the gradient of this protein is crucial for the creation of
dorsal-ventral patterning (Wolpert et al., 2002). The
expression of dpp predicted by the model matches
with the biologically observed wild-type expression.
The expression of different genes observed in the
Drosophila embryo that are necessary for dorsal-
ventral patterning is shown in Figure 9 (A). Ob-
serve that the gene expression predicted by the model
matches very well with the actual wild-type expres-
sion. Correct spatial expression of these genes is re-
sponsible for the creation of the four different germ
layers. This simulation takes under one second to
complete.
Hardware simulation is expected to improve simula-
tion performance significantly. Functionally, the sim-
ulation performed on the FPGA is no different from
the simulation performed on the CPU. Given the same
set of initial states and rules for the next state compu-
tation of the gene products, the steady states reached
are precisely the same.
A 2-GHz CPU utilizing three address code instruc-
tions with register operands requires an average of
roughly 8.6 instructions to compute the next state for
a single gene product of the genes simulated in this
system. If the processor utilizes 4 integer arithmetic
logic units, all of which operate on independent in-
structions, the effective step time of the CPU simu-
lation is approximately 180 ns. A 400-MHz FPGA
using the mapping described is able to perform 10
simulations concurrently, resulting in an effective step
time of approximately 250 ps, 720 times faster than
the general purpose CPU.
5 CONCLUSIONS
In this paper we propose a novel methodology to
model gene regulation based on threshold logic. We
demonstrate the effectiveness of this method to model
the dorsal-ventral and anterior-posterior pattern for-
BIODEVICES 2008 - International Conference on Biomedical Electronics and Devices
218
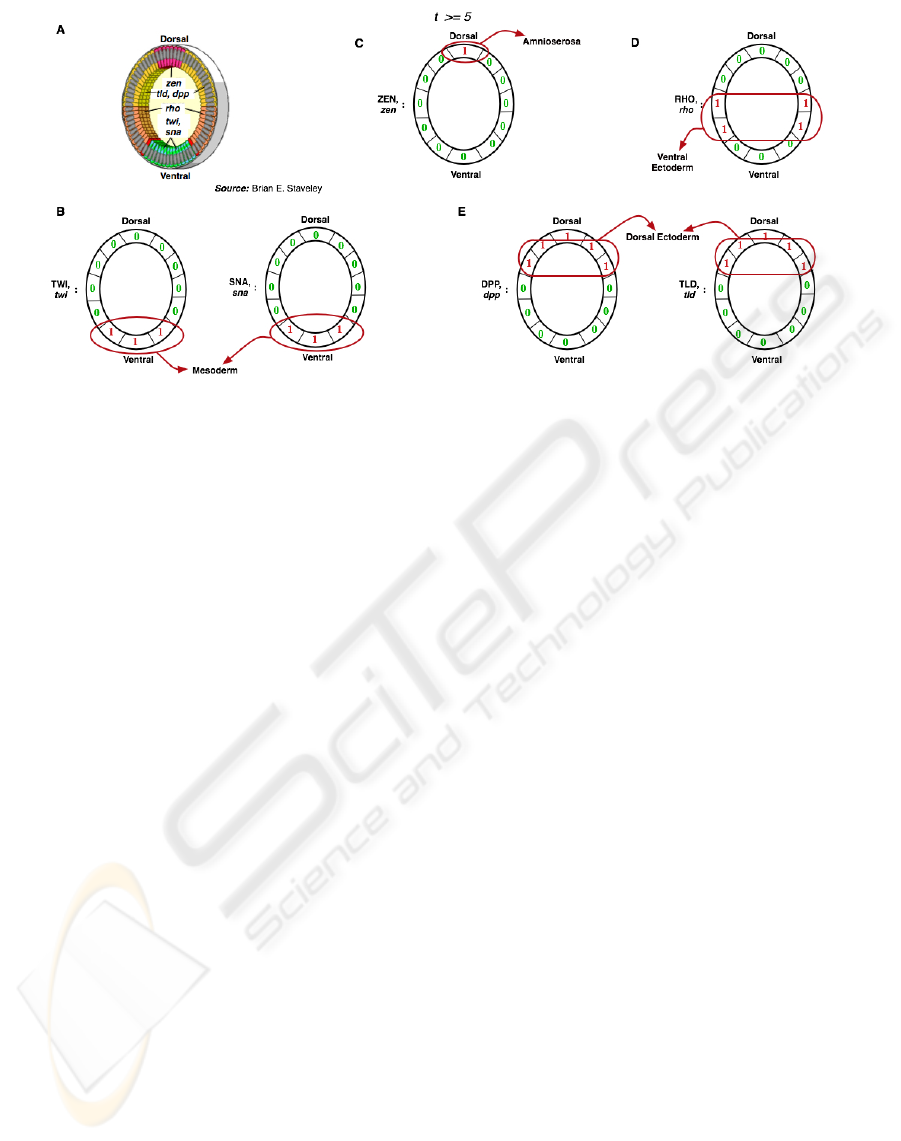
Figure 9: A: Biologically observed gene expression in Drosophila. blastoderm. B-E Steady state expression obtained from
simulation of the model. This matches well with the gene expression observed in actual embryos.
mation in Drosophila. The model was able to pre-
dict the role of different genes and their interaction in
determining the pattern formation in the Drosophila
embryo. The advantage of this model is that it is very
simple and makes use of only the nature of interaction
(activation and inhibition) between genes. In simula-
tion, field-programmable gate arrays provide a great
deal of power in a relatively small package. Through
modular decomposition of gene interaction models
and highly parallel computation, FPGAs are capable
of high speed simulation that greatly surpass the com-
putational ability of a single CPU. Compared with
a large computer cluster capable of the same tasks,
GRN-application oriented FPGAs are clearly an eco-
nomical choice in terms of size, cost, and power con-
sumption.
REFERENCES
Albert, R. and Othmer, H. G. (2003). The topology of the
regulatory interactions predicts the expression pattern
of the segment polarity genes in Drosophila melan-
gogaster. In J. Theor. Biol.
Brown, S. (1992). Field-programmable gate arrays.
Kluwer Academic Publishers, Norwell, MA.
Collins, F. S., Morgan, M., and Patrinos, A. (2003). The
human genome project: Lessons from large-scale bi-
ology. Science, 300(5617):286–290.
DeHon, A. (1996). Reconfigurable Architectures for
General-Purpose Computing. Ph.D. dissertation,
MIT.
Dertouzos, M. (1965). Threshold Logic : A Synthesis Ap-
proach. The MIT Press.
Dougherty, E. R., Hua, J., and Bittner, M. L. (March 2007).
Validation of computational methods in genomics.
Current Genomics, 8:1–19(19).
Francis, R. (1992). A tutorial on logic synthesis for lookup-
table based fpgas. Proceedings of the NAS, pages 40–
47.
Gursky, V. V., Reinitz, J., and Samsonov, A. M. (2001).
How gap genes make their domains: An analytical
study based on data driven approximations. Chaos,
11:132–141.
Heller, M. J. (2002). Dna microarray technology: Devices,
systems, and applications. Annual Review of Biomed-
ical Engineering, 4(1).
Kauffman, S. A. (1993). The Origins of Order: Self–
Organization and Selection in Evolution. Oxford Uni-
versity Press, New York; Oxford.
Kohavi, Z. (1970). Switching and Finite Automata Theory.
New York: McGraw-Hill Book Company.
Muroga, S. (1971). Threshold Logic and Its Applications.
New York: WILEY-INTERSCIENCE.
Reinitz, J. and Sharp, D. H. (1995). Mechanism of eve
stripe formation. In Mechanisms of Development,
number 49, pages 133–158.
Roth, S., Stein, D., and Nusslein-Volhard, C. (1989). A
gradient of nuclear localization of the dorsal protein
determines dorsoventral pattern in the drosophila em-
bryo;. Cell, 59(6):1189–1202.
Russell, S. and Norvig, P. (2003). Artificial Intelligence: A
Modern Approach. Prentice-Hall, Englewood Cliffs,
NJ.
Shmulevich, I., Dougherty, E. R., Kim, S., and Zhang, W.
(2002). Probabilistic boolean networks: a rule-based
uncertainty model for gene regulatory networks. In
Bioinformatics.
Winder, R. O. (1965). Threshold Logic. PhD thesis, Prince-
ton Univiversity.
Wolpert, L., Beddington, R., Jessell, T., Lawrence, P.,
Meyerowitz, E., and Smith, J. (2002). Principles of
Development. Oxford University Press.
THRESHOLD LOGIC GENE REGULATORY MODEL - Prediction of Dorsal-ventral Patterning and Hardware-based
Simulation of Drosophila
219
