
MECHANOMYOGRAPHIC SENSOR
A Triaxial Accelerometry Approach
Guilherme Nunes Nogueira-Neto
Departamento de Engenharia Biomédica, UNICAMP, Cidade Universitária Zeferino Vaz, P.O. 6040, Campinas, Brazil
Ronie Wesley Müller, Fábio Andrey Salles, Percy Nohama, Vera Lúcia da Silveira Nantes Button
CPGEI, Universidade Tecnológica Federal do Paraná, Av Sete de Setembro, 3165, Curitiba, Brazil
Departamento de Engenharia Biomédica, UNICAMP, Cidade Universitária Zeferino Vaz, P.O. 6040, Campinas, Brazil
Keywords: Mechanomyography, accelerometer, triaxial.
Abstract: Recently, accelerometers have been used to acquire mechanomyography signals. These signals are due to
muscle lateral oscillations during contraction. In this study, a sensor acquired such vibrations in three
directions. A triaxial accelerometer-based sensor was constructed and tested with a controlled mechanical
vibrator and subwoofer speaker (both from 10Hz up to 40Hz) during isokinetic muscle contraction (3
volunteers, 50 extensions at 300 degrees/s). With triaxial accelerometry it was possible to compute the
MMG modulus signal. For normalised and average values, MMG amplitude presented strong correlation
coefficients (R=0,89) with RMS and peak torque. Below 80% of normalised data, MMG amplitude and
torque values (RMS and peak) seem to converge.
1 INTRODUCTION
In the last decades, the acquisition of oscillatory
waves of contracting muscles has been performed
with diverse sensors like piezoelectric and condenser
microphones (Brozovich & Pollack, 1983; Stokes &
Cooper, 1992) and hydrophones (Orizio, 1993)
under different acronyms: acousticmyography
(AMG); sound-myography (SMG); vibromyography
(VMG); and phonomyography (PMG). Such
oscillations originate from lateral movement of
muscle fibres (Orizio, Perini, & Veicsteinas, 1989b).
Recently, these waves have been acquired by means
of accelerometers (Watakabe, Mita, Akataki, & Ito,
2003) and the technique named mechanomyography
(MMG). Laser displacement sensors have also been
used (Orizio, Gobbo, Diemont, Esposito, &
Veicsteinas, 2003).
The MMG literature presents studies performed
with isolated muscles and voluntary contraction
tests. Almost all of them have given emphasis in
monitoring the vibratory axis orthogonal to the
muscle belly. This could be assigned to the materials
used in the manufacture of those sensors. As
microelectromechanical systems (MEMS) advance,
new, smaller, more precise and sensible sensors are
developed. Today it is possible to find commercial
monoaxial accelerometers of 1,2V/g and triaxial
ones of 800mV/g.
The MMG signal can be useful for providing
muscle function information different from that
obtained by the electromyography (EMG) and
torque analysis (Orizio, Perini, & Veicsteinas,
1989a). MMG signal time and frequency domain
analyses can help in determining muscle fatigue
(Shinohara, Kouzaki, Yoshihisa, & Fukunaga,
1998).
With efforts aimed at detecting localized muscle
fatigue, defined as the failure to maintain muscle
power output (Fitts, 1994), a triaxial accelerometer
sensor and acquisition system were developed and
described in this paper.
2 METHODS
In this section we will present the hardware and the
methods employed for the sensor assessment.
176
Nunes Nogueira-Neto G., Wesley Müller R., Andrey Salles F., Nohama P. and Lúcia da Silveira Nantes Button V. (2008).
MECHANOMYOGRAPHIC SENSOR - A Triaxial Accelerometry Approach.
In Proceedings of the First International Conference on Biomedical Electronics and Devices, pages 176-179
DOI: 10.5220/0001054601760179
Copyright
c
SciTePress
2.1 Hardware
Taking into account that muscle displacements
during isometric contraction are minimal, the sensor
circuitry was greatly reduced (2,2x2,9cm
2
, 4g). The
hardware was divided into two boards. The first one
(Figure 1) is a double-faced board. On one face is
the triaxial accelerometer circuit (Freescale
MMA7260Q, capacitive, high sensitivity
800mV/g@1,5g) and on the other face is the SMD
passive filter circuit: one high-pass (fc=3Hz) and
one low-pass (fc=1,5kHz) filter per axis. The static
acceleration was eliminated with high-pass filtering.
Therefore, as the inclination of body segments does
not vary so abruptly, its influence is ignored.
The second board lays at 10 cm from the first
one and consists of supply circuit (+/–10V) for the
inverter operational amplifier (G=37,5dB) and 3,3V
regulation circuit.
Figure 1: MMG sensor (both faces).
Sensor and cabling were completed shielded by
aluminium foil and bandage.
For acquisition and assessment purposes, the
signals were concentrated in a DT300 series Data
Translation™ acquisition board, 12-bits, 8
differential input channels and 1kHz sampling
frequency.
2.2 Hardware Assessment Tests
In order to assess the correct operation, the signals
generated were analysed in an FFT-based
LabVIEW™ program. The program used a 40Hz
low-pass Butterworth filter since the MMG signal
energy is primarily comprised below 50Hz (Zagar &
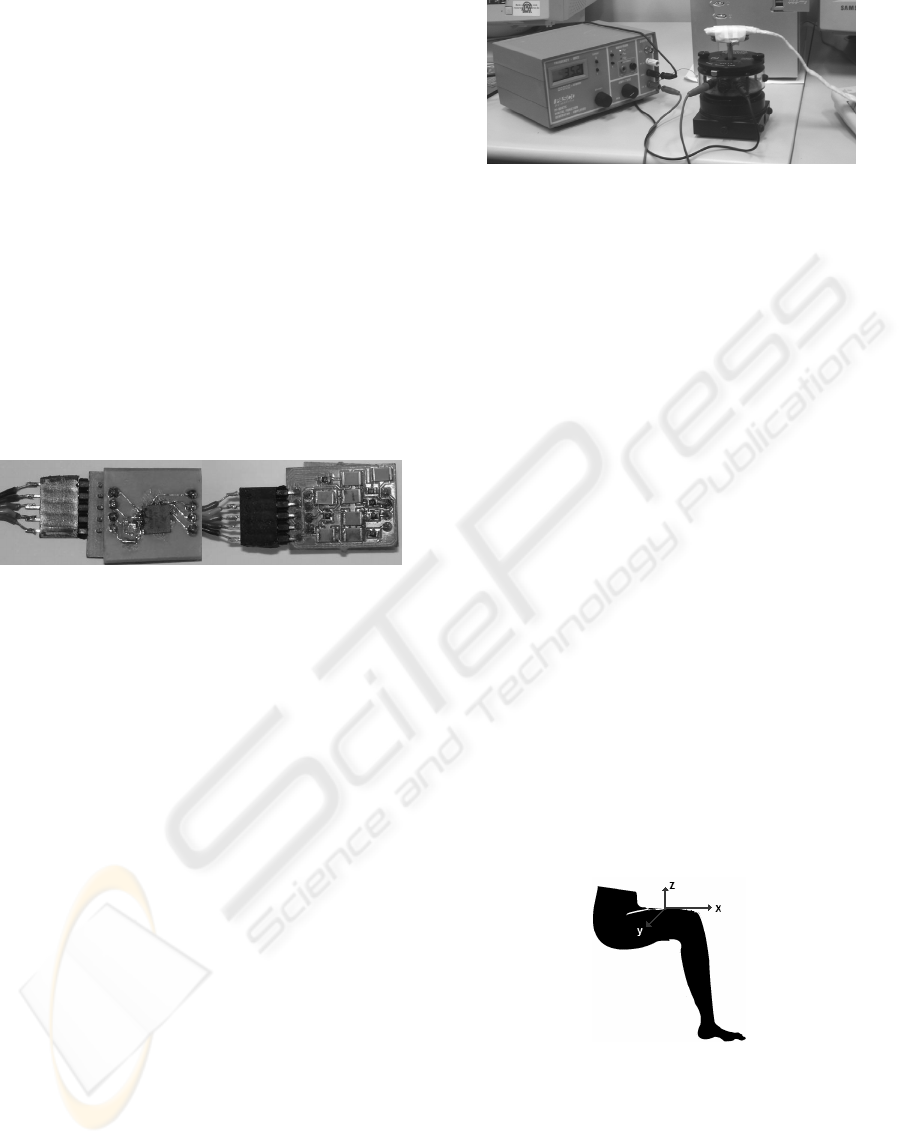
Krizaj, 2005). Figure 2 presents the assessment test
equipment, a PASCO™ digital function PI-9587C
connected to a mechanical wave driver SF-9324.
The MMG sensor was tightly fixed on a plastic
support screwed to the driver.
For the subwoofer test, the sensor was fixed with
double-faced adhesive tape on the woofer.
In the function generator, a sine wave of 0,5Vpp
was set with the following frequencies: 10, 11, 12,
13, 14, 15, 16, 17, 18, 19, 20, 25, 30, 35, and 40Hz.
These frequencies were selected because of the 8-
50Hz MMG pass-band frequency range.
Figure 2: Assessment test equipment.
2.3 MMG Analysis Software
The MMG signal acquisition and analysis software
was created in LabVIEW™ and described elsewhere
(Salles, Müller, Nogueira-Neto, Button, & Nohama,
2006). Briefly, it processes MMG signals extracting
amplitude (integrated MMG, root mean square or
RMS) and frequency (mean power frequency)
variables of interest. Signals were filtered at 40Hz.
For this test, torque signal acquired from an
isokinetic dynamometer was added to the MMG
analysis software.
2.4 Isokinetic Test Protocol
Three volunteers (between 24 and 30 years)
performed an isokinetic muscle contraction test.
Firstly, they warmed up on a cycle ergometer.
Then, they were asked to perform 50 consecutive leg
extensions at the maximum voluntary contraction
(MVC) they could get while a physician provided
sound feedback. The angular velocity was fixed at
300º/s and the leg movement amplitude limited from
10º of flexion to complete extension (total 100º).
The sensor was placed over the muscle belly of
the rectus femoris muscle, as indicated in Figure 3,
fixed with double-face adhesive tape.
Figure 3: Sensor placement and triaxial orientation.
During the extensions, only the intermediate 270ms
of both MMG and torque signals were taken into
account for statistical analysis due to the
dynamometer initial/final acceleration/deceleration.
The modulus (MMG
MOD
) of the MMG signals
from all three axes was calculated and correlated
MECHANOMYOGRAPHIC SENSOR - A Triaxial Accelerometry Approach
177
with RMS and peak torque values (Torque
RMS
and
Torque
PEAK
, respectively).
3 RESULTS
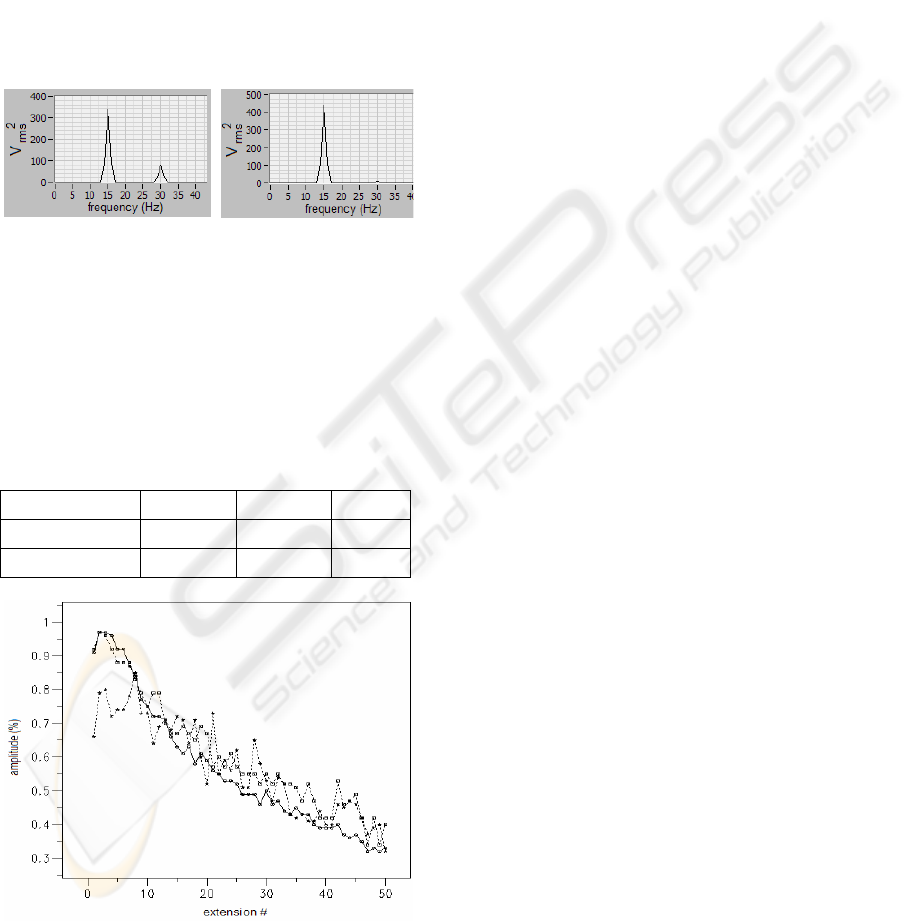
Figure 4 shows the results from one of the controlled
frequencies on both vibrators. As one can see, the
subwoofer results presented less harmonic
components, and these occurred for all frequencies
from 10Hz to 20Hz. Moreover, the fundamental
frequency matched the desired one near two-decimal
digits of accuracy for all frequencies.
Figure 4: (a) Mechanical vibrator and (b) subwoofer
results during test at 15Hz.
Table 1 shows the correlation coefficients between
MMG
MOD
and torque data. Only V3 did not
presented strong coefficients. Figure 5 shows the
curves with the average normalized MMG
RMS
,
TORQUE
RMS
and TORQUE
PEAK
as a function of the
extensions.
Table 1: Correlation between MMG
MOD
and torque.
Volunteers V1 V2
V3
TORQUE
RMS
0,79 0,78 0,48
TORQUE
PEAK
0,75 0,76 0,46
Figure 5: MMG
MOD
(star), TORQUE
RMS
(circle), and
TORQUE
PEAK
(square) vs. extension.
The MMG
MOD
average signal presented strong
correlation coefficient with both TORQUE
RMS
and
TORQUE
PEAK
average signals (R=0,89 and R=0,89,
respectively).
4 DISCUSSION
The results of the hardware assessment test showed
that the mechanical vibrator introduced more
harmonic components than the subwoofer. This can
be partly due to the difference between the
amplitudes of vibration, and partly assigned to the
fixation method. The sensor was tightly fixed on the
plastic support of the driver. However, it was loosely
fixed on the subwoofer membrane. The damping
effect can be responsible for the harmonic
suppression. Also, the amplitude of vibration was
maximal for the driver, but partial for the subwoofer
because the sensor was not placed over the axis of
movement. When analysing spectral indicators, it is
important to have this in mind.
The triaxial sensor-based MMG analysis
becomes acceptable when someone considers a
physiological approach. Inside the thigh, the rectus
femoris muscle is surrounded by subcutaneous fat
layer under the skin (Hudash, Albright, McAuley,
Martin, & Fulton, 1985). It is difficult to determine
the exact direction of muscle vibrations. Fibres are
constantly changing length. Moreover, in the
quadriceps group there are other muscle oscillatory
sources (e.g. vastus medialis) that can indirectly
reduce and distort the MMG signal acquired by the
sensor placed over the rectus femoris muscle belly.
MMG presents greater correlation with torque
when it is measured at the muscle belly (Cescon,
Farina, Gobbo, Merletti, & Orizio, 2004). A
theoretical advantage of triaxial accelerometry is
that MMG
MOD
is less sensitive to variations in sensor
positioning and orientation than individual axes.
On the other hand, triaxial accelerometers tend to
have larger dimensions and can negatively affect
MMG signal analysis due to distortions (Watakabe
et al., 2003). However, it does not seem to be the
case of the sensor described in this paper.
Regarding the correlation coefficients, the high
values (R=0,89) obtained for the average MMG and
torque data are similar to those previously obtained
for peak torque during isokinetic contraction at
300º/s (Evetovich et al., 1997).
It was assumed that volunteers used the
maximum voluntary contraction (MVC) at the
beginning of the tests and, along with the exercise,
torque loss occurred which would lead to localized
BIODEVICES 2008 - International Conference on Biomedical Electronics and Devices
178

muscle fatigue. The average normalized MMG
RMS
,
TORQUE
RMS
, and TORQUE
PEAK
curves seem to
converge for values below approximately 80% of
maximum normalized amplitude and diverge above
it. Similar results were found by researchers
studying isometric contractions (Orizio et al.,
1989b). However, it is not possible to affirm that
volunteers used MVC, because data have been
normalized.
5 CONCLUSIONS
When computing spectral values based on MMG
monitoring of muscle contraction, it is important to
consider the effect of the sensor adhesion technique
because it can influence the calculus of e.g. mean
power frequency. The moduli of the signals acquired
by the triaxial accelerometer sensor present good
correlation with RMS and peak torque. MMG
MOD
can be a good indicator of torque loss during
isokinetic contractions. The MMG and torque
amplitudes (RMS and peak) seem to converge for
values below 80% of normalised data (presumably
80%MVC). The results obtained in the preliminary
tests, with three volunteers, showed that the sensor is
viable. These tests consist in the initial efforts for
assessing the sensor and it will be complemented
with a wider volunteer population.
ACKNOWLEDGEMENTS
Guilherme Nogueira would like to thank CNPq –
Conselho Nacional de Desenvolvimento Científico –
Fundação Araucária and FINEP for the financial
support.
REFERENCES
Brozovich, F. V., & Pollack, G. H. (1983). Muscle
contraction generates discrete sound bursts.
Biophysical Journal, 41(1), 35-40.
Cescon, C., Farina, D., Gobbo, M., Merletti, R., & Orizio,
C. (2004). Effect of accelerometer location on
mechanomyogram variables during voluntary,
constant-force contractions in three human muscles.
Medical and Biological Engineering and Computing,
42(1), 121-127.
Evetovich, T. K., Housh, T. J., Stout, J. R., Johnson, G.
O., Smith, D. B., & Ebersole, K. T. (1997).
Mechanomyographic responses to concentric
isokinetic muscle contractions. European Journal of
Applied Physiology and Occupational Physiology,
75(2), 166-169.
Fitts, R. H. (1994). Cellular mechanisms of muscle
fatigue. Physiol Rev, 74(1), 49-94.
Hudash, G., Albright, J., McAuley, E., Martin, R., &
Fulton, M. (1985). Cross-sectional thigh components:
computerized tomographic assessment. Med Sci Sports
Exerc, 17(4), 417-421.
Orizio, C. (1993). Muscle sound: bases for the
introduction of a mechanomyographic signal in muscle
studies. Crit Rev Biomed Eng, 21(3), 201-243.
Orizio, C., Gobbo, M., Diemont, B., Esposito, F., &
Veicsteinas, A. (2003). The surface mechanomyogram
as a tool to describe the influence of fatigue on biceps
brachii motor unit activation strategy. Historical basis
and novel evidence. European Journal of Applied
Physiology, 90(3 - 4), 326-336.
Orizio, C., Perini, R., & Veicsteinas, A. (1989a). Changes
of muscular sound during sustained isometric
contraction up to exhaustion. Journal of Applied
Physiology, 66(4), 1593-1598.
Orizio, C., Perini, R., & Veicsteinas, A. (1989b). Muscular
sound and force relationship during isometric
contraction in man. European Journal of Applied
Physiology and Occupational Physiology, 58(5), 528-
533.
Salles, F. A., Müller, R. W., Nogueira-Neto, G. N.,
Button, V. L., & Nohama, P. (2006). Sistema de
análisis de señales mecanomiográficas (MMG). Paper
presented at the XXIV Congreso Anual de la Sociedad
Española de Ingeniería Biomédica, Pamplona, Spain.
Shinohara, M., Kouzaki, M., Yoshihisa, T., & Fukunaga,
T. (1998). Mechanomyogram from the different heads
of the quadriceps muscle during incremental knee
extension. European Journal of Applied Physiology,
78(4), 289-295.
Stokes, M. J., & Cooper, R. G. (1992). Muscle sounds
during voluntary and stimulated contractions of the
human adductor pollicis muscle. Journal of Applied
Physiology, 72(5), 1908-1913.
Watakabe, M., Mita, K., Akataki, K., & Ito, K. (2003).
Reliability of the mechanomyogram detected with an
accelerometer during voluntary contractions. Medical
and Biological Engineering and Computing, 41(2),
198-202.
Zagar, T., & Krizaj, D. (2005). Validation of an
accelerometer for determination of muscle belly radial
displacement. Medical and Biological Engineering
and Computing, 43(1), 78-84.
MECHANOMYOGRAPHIC SENSOR - A Triaxial Accelerometry Approach
179
