
DEVELOPMENT OF A PARTIAL SUPERVISION STRATEGY TO
AUGMENT A NEAREST NEIGHBOUR CLUSTERING ALGORITHM
FOR BIOMEDICAL DATA CLASSIFICATION
Sameh A. Salem, Nancy M. Salem and Asoke K. Nandi
Signal Processing and Communications Group
Department of Electrical Engineering and Electronics, The University of Liverpool
Brownlow Hill, L69 3GJ, Liverpool, UK
Keywords:
Data clustering, Partial supervision, Retinal blood vessels segmentation, Breast cancer classification.
Abstract:
In this paper, a partial supervision strategy for a recently developed clustering algorithm NNCA (Salem et al.,
2006), Nearest Neighbour Clustering Algorithm, is proposed. The proposed method (NNCA-PS) offers clas-
sification capability with smaller amount of a priori knowledge, where a small number of data objects from the
entire dataset are used as labelled objects to guide the clustering process towards a better search space. Results
from the proposed supervision method indicate its robustness in classification compared with other classifiers.
1 INTRODUCTION
Data clustering is a common technique for data anal-
ysis, which is used in many fields, including ma-
chine learning, data mining, pattern recognition, im-
age analysis and bioinformatics. Clustering is the
grouping of individualsin a population in order to dis-
cover structures in the data. In some sense, we would
like the individuals within a group to be close or sim-
ilar to one another, but dissimilar from the individu-
als in the other groups (Webb, 2003; Theodoridis and
Koutroubas, 2003). Recently, a number of clustering
algorithms has been proposed. The basic two types
of clustering algorithms are partitional and hierarchi-
cal algorithms. Their main purpose (Xu and Wunsch,
2005; Jain et al., 1999; Jain and Dubes, 1988) is to
evolve a N
C
× n partition matrix U(X) of a dataset
X (X = {x
1
,x
2
,.. . ,x
n
}) in R
p
, representing its parti-
tioning into a number of N
C
clusters (C
1
,C
2
,.. . ,C
N
C
).
The partition matrix U(X) may be represented as
U = [u
mj
], m = 1,.. . ,N
C
and j = 1, ...,n, where u
mj
is the membership of pattern x
j
to cluster C
m
. In hard
partitioning of the data, the following conditions hold:
u
mj
= 1 if x
j
∈ C
m
; otherwise, u
mj
= 0.
Clustering is unsupervised classification where
there are no predefined classes (labels) and no a priori
knowledge of the data, while supervised classification
requires a complete knowledge of the data where the
class label and the number of classes (labels) are pre-
defined (Bouchachia and Pedrycz, 2006). The pro-
cess of labeling data objects is always an expensive
and error-prone task that requires time and human in-
tervention. In many situations, objects are neither per-
fectly labelled nor completely labelled. Therefore, the
main idea of clustering with partial supervision strat-
egy is to take the advantage of the smaller proportion
of labelled objects to guide the clustering process of
the unlabelled objects.
One of the typical applications of clustering
with partial supervision is Computer-AidedDiagnosis
(CAD) which has become one of the major research
subjects in medical imaging and diagnostic radiology
(Doi, 2005). The basic concept of CAD is to provide
a computer output as a second opinion to assist radi-
ologists’ image interpretation by improving the accu-
racy and consistency of radiological diagnosis (Doi,
2005). The design of clustering with partial supervi-
sion in CAD can play an important role in improv-
ing CAD performance at small amount of knowledge,
where only some labelled objects or regions of an im-
age can assist in identification of any suspicious ob-
jects or regions.
This paper proposes a novel partial supervision
strategy for the recently developed clustering algo-
rithm NNCA (Salem et al., 2006). We examine its
applicability and reliability using datasets from real-
world problems, where the proposed method is used
to segment the blood vessels in retinal images which
326
A. Salem S., M. Salem N. and K. Nandi A. (2008).
DEVELOPMENT OF A PARTIAL SUPERVISION STRATEGY TO AUGMENT A NEAREST NEIGHBOUR CLUSTERING ALGORITHM FOR BIOMEDI-
CAL DATA CLASSIFICATION.
In Proceedings of the First International Conference on Bio-inspired Systems and Signal Processing, pages 326-333
DOI: 10.5220/0001056503260333
Copyright
c
SciTePress

can help in early detection and diagnosis of many eye
diseases, and it is used to classify breast tumors into
either malignant or benign. Additionally, this paper
presents a comparative evaluation of the proposed al-
gorithm with some other algorithms.
2 THE NNCA CLUSTERING
ALGORITHM
NNCA (Salem et al., 2006) is a modified version of
the KNN classifier, and it is divided into two stages for
creating N
C
clusters. First stage is to select N objects
randomly. Then non-overlapping clusters are created
from these N objects, each of maximum size K
init
ob-
jects (the choice of K
init
ensures that more than N
C
clusters are generated here). Afterwards an iterative
control strategy is applied to update the clusters and
their memberships by increasing the number of neigh-
bours until N
C
non-overlapping clusters are created.
Second stage is to cluster the remaining objects. For
each unclustered object q, K nearest clustered objects
are found. Then, the cluster to which most of these K
clustered objects belong is deemed to be one to which
the object q belongs to.
The NNCA clustering algorithm is detailed in Al-
gorithm 1. Let each object x be described by the fea-
ture vector:
< a
1
(x)a
2
(x),. .. ... , a
p
(x) >
where a
r
(x) is used to denote the values of the p-th
attribute of data point x. If we consider two objects x
i
and x
j
, then the distance between them is defined as
d(x
i
,x
j
), which is expressed in Eq. 1.
d(x
i
,x
j
) =
s
p
∑
r=1
(a
r
(x
i
) − a
r
(x
j
))
2
(1)
A fuzzy clustering, where all objects are allowed to
belong to all clusters with different degrees of mem-
bership, is achieved by obtaining the mean value
of the K nearest neighbours for each object in the
dataset. Therefore, hard partition as well as soft parti-
tion can be obtained. For an object x
q
to be clustered,
let x
1
... x
K
denote the nearest K clustered objects to
x
q
and C(x
i
) ∈ {1,. .., N
C
} is the cluster index for ob-
ject x
i
. Hard partition value for x
q
is:
C(x
q
) = argmax
n∈N
C
K
∑
r=1
δ(n−C(x
r
)), (2)
and soft partition vector is:
C(x
q
) =
K
∑
r=1
δ(C(x
r
) −C(x
i
))
K
(3)
Algorithm 1 Nearest Neighbour Clustering Algo-
rithm (Salem et al., 2006)
Input (data, N, K
init
, N
C
, K) where:
∗ N is the number of random objects to be clus-
tered.
∗ K
init
is the nearest neighbour objects from N.
∗ N
C
is the user defined number of clusters.
∗ K is the number of nearest clustered objects.
# Step 1: Create N
C
non-overlapped clusters
# (a) Create initial clusters:
* Initially, all the N objects are unclustered.
let M = 1
For i = 1 to N
IF ( object i is unclustered )
- Assign i and its unclustered neighbours (from N)
of the K
init
nearest neighbours to cluster # M.
- M = M + 1
End IF
End For
# (b) Merge clusters:
* DO
- K
init
= K
init
+ 1
- Assign each clustered object to the common
cluster of the K
init
nearest neighbours.
- Update the number of clusters → M
WHILE ( M > N
C
)
# Step 2: Find the nearest K neighbours for each
remaining object
- Assign each unclustered object to the common
cluster of the K nearest clustered objects.
- Use Eq. 2 to find hard partition and Eq. 3 to
find soft partition.
Output ( Hard partition vector, Soft partition matrix)
Figure 1 shows a sub-image from a colour retinal im-
age and its ground truth along with the corresponding
segmented sub-images after applying NNCA.
3 NNCA WITH PARTIAL
SUPERVISION STRATEGY
(NNCA-PS)
In this section, we propose to adapt NNCA algorithm
with some labelled objects to guide the clustering pro-
cess of the unlabelled objects, i.e., NNCA with partial
supervision (NNCA-PS). The proposed method is di-
vided into two stages. First stage is to select N
P
ob-
jects randomly from the dataset to be labelled data ob-
DEVELOPMENT OF A PARTIAL SUPERVISION STRATEGY TO AUGMENT A NEAREST NEIGHBOUR
CLUSTERING ALGORITHM FOR BIOMEDICAL DATA CLASSIFICATION
327
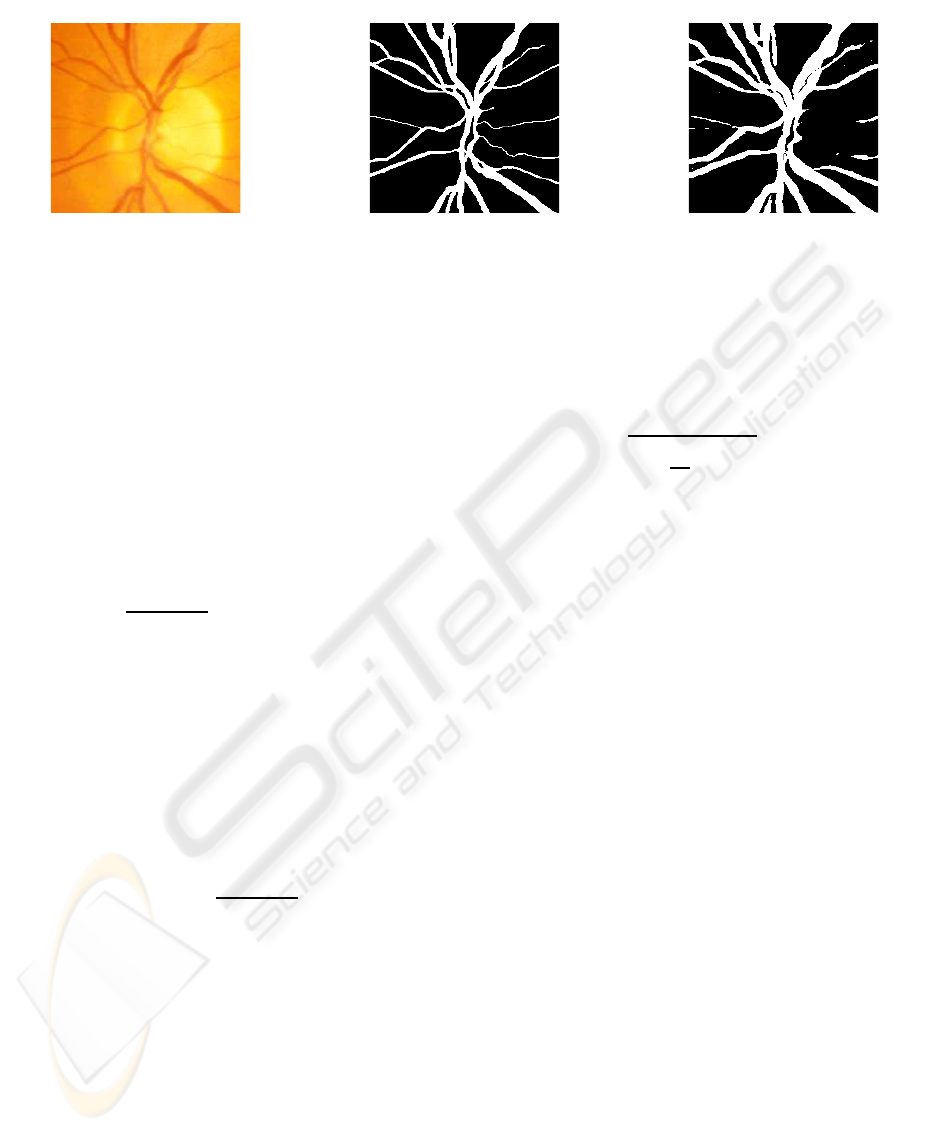
(a) (b) (c)
Figure 1: (a) Original sub-image, (b) ground truth sub-image, and (b) sub-image with blood vessels clustered using NNCA.
jects and cluster these N
P
objects into N
C
clusters, as
described in Sec. 2. Second stage is to classify each
cluster according to the class label of the majority of
its objects. For each labelled data object x
l
of class
C
i
, assigned to cluster j (1 ≤ j ≤ N
C
), if its cluster is
classified to different class (label), then this data ob-
ject will be assigned to the cluster that has the nearest
objects and with the same label of it as in Eq. 4.
j =
j if cluster j ∈ C
i
argmin
k∈C
i
∑
z∈k
d
zx
l
|cluster k|
if cluster j /∈ C
i
(4)
where |cluster k| is the number of objects in cluster k,
and d
zx
l
is the Euclidean distance between an object z
and the labelled object x
l
.
This process continuesuntil all labelled objects within
a cluster have the same class label. Then, the process
continues to assign each unlabelled object x
u
to the
cluster that has the nearest labelled objects as in Eq.
5. Then, all the data objects that belong to different
clusters with the same class labels can be assigned to
that label.
j = arg min
1≤k≤N
C
∑
z∈k
d
zx
u
|cluster k|
(5)
where d
zx
u
is the Euclidean distance between an ob-
ject z and the unlabelled object x
u
.
This proposed method will bias clustering towards a
better search space. The proposed supervised method
is detailed in Algorithm 2. Figure 2 shows two ex-
amples; abnormal (top) and normal (bottom) images
and their results after blood vessels segmentation us-
ing NNCA, NNCA-PS, and KNN classifier.
A soft classification, where all objects are allowed
in principle to belong to all classes with different de-
grees of membership, is achieved by adding the fuzzy
memberships for each object with the clusters that be-
long to the same class label. Equations 6 and 7 show
the fuzzy membership (u
ix
) of object x to cluster i,
and the soft membership (U
C
i
x
) of object x to class C
i
respectively.
u
ix
=
1
N
C
∑
j=1
d
ix
d
jx
2/(q−1)
(6)
U
C
i
x
=
N
C
∑
j
u
jx
if cluster j ∈ classC
i
(7)
where d
ix
is the distance from object x to the current
cluster centre i (the average of all objects in cluster i),
d
jx
is the distance from object x and the other cluster
centre j (1 ≤ j ≤ N
C
), and q is the weighting exponent
which controls the fuzziness of the resulting clusters
(q≥ 1) (Webb, 2003). A value of q = 1 gives the hard
membership, i.e. u
ix
= 1 if x ∈ cluster i; otherwise,
u
ix
= 0. In this study, q = 1.5 is used.
4 DATASETS
Two different types of real-world data are used to in-
vestigate whether the proposed algorithm scales well
with the size and dimension of the dataset.
4.1 Retinal Images
For performance evaluation, a publicly available
dataset is used (STARE, ). The dataset consists of 20
images which are digitised slides captured by a Top-
Con TRV-50 fundus camera at 35
◦
FOV. Each slide
was digitized to produce a 605×700 pixels image,
standard RGB, 8 bits per colour channel. Every im-
age has been manually segmented by two observers
to produce ground truth vessels segmentation. Ten of
these images contain pathology and the other ten are
normal, giving a good opportunity to test the proposed
method in both normal and abnormal retinas.
BIOSIGNALS 2008 - International Conference on Bio-inspired Systems and Signal Processing
328
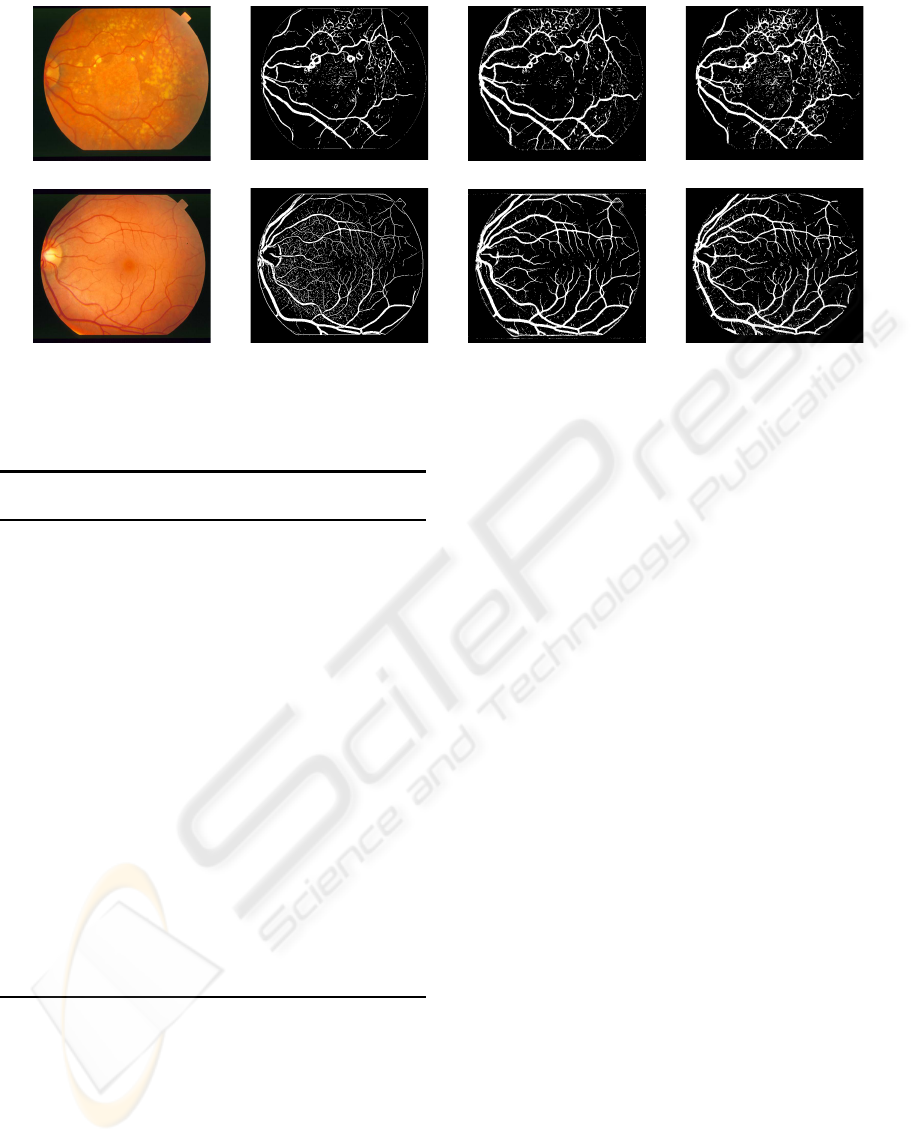
(a) (b) (c) (d)
Figure 2: (a) Original images, (b) output from the NNCA (hard decision), (c) output from the NNCA-PS (hard decision), and
(d) output from the KNN classifier (hard decision).
Algorithm 2 NNCA with partial supervision strategy
(NNCA-PS)
• Step 1: Clustering using NNCA algorithm
1. Randomly select N
P
points from the ground
truth to be labelled objects.
2. Cluster the N
P
objects into N
C
cluster using
NNCA clustering algorithm.
• Step 2: Apply the supervision strategy as follow:
1. Classify the clusters obtained by NNCA al-
gorithm to the class of its most labelled objects.
2. For each labelled object, if its cluster is
classified to different class (label), then this
object will be assigned to the cluster that has
the nearest objects and with the same label of it.
3. Each unlabelled object is assigned to the cluster
that has the nearest objects and then classified
to the class (label) of this cluster.
4.2 Breast Cancer Data
Two Wisconsin breast cancer datasets (UCI, ) are con-
sidered in this paper. The first dataset contains 569
samples of 30 features each, and two classes: Benign
(class 1 and 357 samples) and Malignant (class 2 and
212 samples). The second dataset contains 683 sam-
ples of 9 features each, and two classes: Benign (class
1 and 444 samples) and Malignant (class 2 and 239
samples).
5 EXPERIMENTAL RESULTS
5.1 Retinal Images
In our experiments, retinal blood vessels are seg-
mented using the NNCA with partial supervised strat-
egy (NNCA-PS). The performance is measured by the
true and false positive rates. These rates are defined
in the same way as in (Hoover et al., 2000), where
the true (false) positive is any pixel which was hand-
labelled as a vessel (not vessel), whose intensity af-
ter segmentation is above a given threshold. The true
(false) positive rate is established by the dividing the
number of true (false) positives by the total number of
pixels hand-labelled as vessels (not vessels).
For purposes of comparison, we have compared
the performance of NNCA-PS with KNN classifier
(Salem and Nandi, 2006a) and RACAL with partial su-
pervision strategy (Salem et al., 2007). For the KNN
classifiers, two sets are required; one for training and
the other for testing, so the dataset is randomly di-
vided into two sets of images, each contains 5 nor-
mal and 5 abnormal images. The training set con-
tains large number of training samples (423500 pix-
els/image), which is huge and is the main problem
with this type of classifiers. To overcome such a prob-
lem, a random number of pixels are chosen from the
field of view (FOV) of each image in the training set.
The targets for these training samples are available
from the manually segmented images. The testing
DEVELOPMENT OF A PARTIAL SUPERVISION STRATEGY TO AUGMENT A NEAREST NEIGHBOUR
CLUSTERING ALGORITHM FOR BIOMEDICAL DATA CLASSIFICATION
329

Table 1: NNCA-PS, RACAL and KNN hard decision results (average from 10 images (testing set)).
NNCA-PS RACAL (Salem et al., 2007) KNN (Salem and Nandi, 2006a)
Image type Specificity Sensitivity Specificity Sensitivity Specificity Sensitivity
% % % % % %
Normal 95.4% 90.2% 97.2% 85.9% 93.6% 88.6%
Abnormal 94.4% 87.8% 96.9% 80.3% 91.9% 82.4%
All images 94.8% 89.0% 97.0% 83.1% 92.7% 85.5%
Table 2: Average sensitivity at certain specificity values for 10 images.
NNCA-PS RACAL (Salem et al., 2007) KNN (Salem and Nandi, 2006a)
Image Specificity Sensitivity Sensitivity Sensitivity
type % % % %
Normal 90.8% 85.3% 86.6%
Abnormal 95% 86.7% 81.0% 76.2%
All images 88.8% 83.2% 81.4%
Normal 95.1% 92.9% 92.6%
Abnormal 90% 92.8% 93.5% 86.1%
All images 93.9% 93.2% 89.4%
Normal 96.9% 94.1% 95.1%
Abnormal 85% 95.4% 97.7% 90.9%
All images 96.1% 95.9% 92.9%
Normal 98.1% 98.1% 96.5%
Abnormal 80% 96.9% 96.6% 93.7%
All images 97.5% 97.4% 95.1%
set contains 10 images to test the performance of the
classifier. The value of K = 60 and each feature is
normalised to zero mean and unit standard deviation.
While for NNCA-PS and RACAL with partial supervi-
sion strategy, only 30% of all the pixels are known (as
vessels or non-vessels pixels) to demonstrate the ad-
vantage of using a small proportion of labelled pixels
in clustering the unlabelled pixels.
For hard classification, the same set of images is
used when comparing with the KNN classifier. As
shown in Table 1, NNCA-PS achieves average sensi-
tivity (true positive rate) of 89% at average specificity
(1-false positive rate) of 94.8%, while the KNN clas-
sifier achieves sensitivity of 85.5% at average speci-
ficity of 92.7%. On average, the proposed NNCA-PS
achieves better specificity as well as sensitivity than
KNN classifier. On average, RACAL (Salem et al.,
2007) achieves 2% higher specificity than NNCA-PS,
but it offers 6% less sensitivity than NNCA-PS.
For soft classification as shown in Table 2, the soft
classification results of the proposed NNCA-PS are
compared with the soft results of RACAL and KNN.
As shown, at 95% specificity, the proposed NNCA-
PS achieves 5.5% and 4.2% higher sensitivity than
RACAL and KNN respectively in case of normal im-
ages. Also in abnormal images at 95% specificity,
NNCA-PS achieves 5.7% and 10.5% higher sensitiv-
ity than RACAL and KNN respectively. For higher
specificity, KNN classifier achieves the lowest aver-
age sensitivity compared with NNCA-PS and RACAL,
while both NNCA-PS and RACAL achieves on aver-
age comparable sensitivity.
5.2 Breast Cancer Datasets
For purposes of comparison, a series of experiments
were carried out to examine the performance of
NNCA when applying the proposed supervision strat-
egy (NNCA-PS) on breast cancer datasets, where the
classification results obtained by NNCA with the su-
pervision strategy on breast cancer dataset 1 are com-
pared with the results (Guo and Nandi, 2006) of dif-
ferent classifiers (PCA/MDC “Principal Component
Analysis / Minimum Distance Classifier” (Theodor-
idis and Koutroubas, 2003; Cios et al., 1998),
FLDA/MDC “Fisher Linear Discriminant Analysis /
MDC” (Cios et al., 1998), MLP “Multi-Layer Per-
cepton“ (Duha et al., 2001), SVM “Support Vector
Machine” (Hsu and Lin, 2002), and GP/MDC “Ge-
netic Programming/ MDC” (Guo and Nandi, 2006;
Kishore et al., 2002)). In order to achieve fair com-
parisons as in (Guo and Nandi, 2006), we randomly
selected, without replacement, 100 samples (from the
entire dataset) for training, and 100 samples for test-
BIOSIGNALS 2008 - International Conference on Bio-inspired Systems and Signal Processing
330
Table 3: Comparison of classification accuracy (%) for breast cancer dataset 1 (testing set) using NNCA-PS and different
classifiers, based on 100 experiments.
Algorithms Best (%) Average (%) Std (%)
PCA/MDC (Guo and Nandi, 2006) 88.7 88.6 N/A
FLDA/MDC (Guo and Nandi, 2006) 88.9 88.6 N/A
MLP (Guo and Nandi, 2006) 97.3 96.2 1.7
SVM (Guo and Nandi, 2006) 96.7 96.3 0.8
GP/MDC (Guo and Nandi, 2006) 98.9 97.4 1.5
NNCA-PS 99.5 97.2 1.2
ing; this process has been repeated 100 times. The tar-
get information, class labels, of the training samples
is used to guide the clustering process of the testing
samples using NNCA-PS algorithm. Table 3 shows
comparison results of NNCA-PS along with different
methods for classification. As shown, the best clas-
sification accuracy is achieved by NNCA-PS (99.5%),
with the lowest being 88.7% obtained by PCA/MDC
which gives comparable results as FLDA/MDC. Al-
though the average classification accuracy obtained
by GP/MDC are comparable with NNCA-PS, it gives
0.6% less than the best performance of NNCA-PS
with higher standard deviation in classification accu-
racy. Therefore, the proposed method is more robust
compared with other methods.
In order to reduce the amount of a priori knowl-
edge, a small number of objects from the entire
dataset are used as labelled objects. In these exper-
iments, the effect of the number of labelled objects on
the classification accuracy are investigated. We ran-
domly selected a fraction from the entire dataset to be
labelled objects. For each fraction, this process is re-
peated one hundred times without replacement. The
best, average, and standard deviation of classification
accuracy are obtained over one hundred runs for each
fraction of labelled objects. For breast cancer dataset
1, as demonstrated in Table 4, the best and average
classification accuracies increase with the increas-
ing fraction of the labelled objects. As shown, the
best and average classification accuracy of 98.2% and
96.3% respectively were achievedat 30% labelled ob-
jects, with the lowest being 96.2% and 91.5% for best
and average accuracies respectively at 5% labelled
objects. By examining the average and standard de-
viation of the classification performance, when 5%
of the entire dataset are labelled, the average perfor-
mance is the lowest, while it has the highest standard
deviation compared with the other fractions of la-
belled objects. For breast cancer dataset 2 as recorded
in Table 5, the standard deviations is lower than the
standard deviations of breast cancer dataset 1. It is
conjectured that the clusters on breast cancer dataset
2 are more compact with those in breast cancer dataset
Table 4: Classification accuracy (%) for breast cancer
dataset 1 (entire dataset) using NNCA with partial super-
vision (NNCA-PS), based on 100 experiments.
labelled
objects % Best (%) Average (%) Std (%)
5 96.2 91.5 2.3
10 96.3 93.1 1.8
15 97.0 94.4 1.3
20 97.2 95.3 1.0
25 97.6 95.6 0.9
30 98.2 96.3 0.7
Table 5: Classification accuracy (%) for breast cancer
dataset 2 (entire dataset) using NNCA with partial super-
vision (NNCA-PS), based on 100 experiments.
labelled
objects % Best (%) Average (%) Std (%)
5 98.0 96.0 1.2
10 98.1 96.3 1.1
15 98.5 96.7 0.9
20 98.7 97.0 0.8
25 98.7 97.4 0.7
30 99.2 97.9 0.5
1, as indicated in (Salem and Nandi, 2005). For 5%
labelled objects and higher, the best classification ac-
curacy is higher than 98% with a small decrease in the
standard deviation and a significant increase in the av-
erage classification accuracy as demonstrated in Table
5.
When comparing the proposed NNCA-PS with
RACAL for breast cancer data classification, where
a small number of objects from the entire dataset
are used as labelled objects. The average classi-
fication accuracy for breast cancer dataset 1 using
NNCA-PS is 1% higher than RACAL algorithm while
it achieves comparable accuracy for breast cancer
dataset 2 as demonstrated in Tables 6 and 7. More-
over, the standard deviation of the classification per-
formance of NNCA-PS for breast cancer dataset 1 is
lower than RACAL which favors compact clusters,
DEVELOPMENT OF A PARTIAL SUPERVISION STRATEGY TO AUGMENT A NEAREST NEIGHBOUR
CLUSTERING ALGORITHM FOR BIOMEDICAL DATA CLASSIFICATION
331

Table 6: Comparison of classification accuracy (%) for breast cancer dataset 1 (entire dataset) using NNCA and RACAL with
partial supervisions, based on 100 experiments.
NNCA-PS RACAL
labelled (Salem and Nandi, 2006b)
objects % Average(%) ± Std(%) Average(%) ± Std(%)
5 91.5 ± 2.3 90.6 ± 4.7
10 93.1 ± 1.8 92.1 ± 3.2
15 94.4 ± 1.3 93.5 ± 2.3
20 95.3 ± 1.0 94.4 ± 1.8
25 95.6 ± 0.9 94.9 ± 1.6
30 96.3 ± 0.7 95.2 ± 1.7
Table 7: Comparison of classification accuracy (%) for breast cancer dataset 2 (entire dataset) using NNCA and RACAL with
partial supervisions, based on 100 experiments.
NNCA-PS RACAL
labelled (Salem and Nandi, 2006b)
objects % Average(%) ± Std(%) Average(%) ± Std(%)
5 98.0 ± 1.2 97.5 ± 1.4
10 98.1 ± 1.1 97.9 ± 0.3
15 98.5 ± 0.9 98.2 ± 0.3
20 98.7 ± 0.8 98.6 ± 0.3
25 98.7 ± 0.7 98.6 ± 0.3
30 99.2 ± 0.5 98.6 ± 0.3
while it achieves slightly higher standard deviations
in breast cancer dataset 2. This may be the result of
the NNCA-PS achieving clustering without any con-
trol of cluster sizes while RACAL is constrained with
a radius parameter δ
0
which controls the size of the
clusters.
6 CONCLUSIONS
In this paper, we have proposed a partial supervision
strategy for a recently developed clustering algorithm
(NNCA) to act as a classifier. We examined its appli-
cability and reliability using datasets from real-world
problems. As shown, the proposed NNCA-PS has the
ability to classify pixels of retinal images into those
belonging to blood vessels and others not belonging
to blood vessels, and it also has the ability to classify
breast tumors into either benign or malignant. Ex-
perimental results show that the proposed algorithm
offers better classification accuracies compared with
certain other classifiers.
REFERENCES
Bouchachia, A. and Pedrycz, W. (2006). Data clustering
with partial supervision. Data Mining and Knowledge
Discovery, 12:47–78.
Cios, K., Pedrycz, W., and Swiniarski, R. (1998). Data
Mining Methods for Knowledge Discovery. Kluwer
Academic, Boston.
Doi, K. (2005). Current status and future potential of
computer-aided diagnosis in medical imaging. The
British Journal of Radiology, 78:3–19.
Duha, R., Hart, P., and Stork, D. (2001). Pattern Classifica-
tion. John Willey & Sons, Inc., Chichester.
Guo, H. and Nandi, A. (2006). Breast cancer diagnosis us-
ing genetic programming generated feature. Pattern
Recognition, 39(5):980–987.
Hoover, A., Kouznetsova, V., and Goldbaum, M. (2000).
Locating blood vessels in retinal images by piecewise
thresholding probing of a matched filter response.
IEEE Transaction on Medical Imaging, 19:203–210.
Hsu, C. and Lin, C. (2002). A comparison of methods for
multiclass support vector machines. IEEE Transac-
tions on Neural Networks, 13:415–425.
Jain, A. and Dubes, R. (1988). Algorithms for Clustering
Data. Prentice Hall.
Jain, A., Murty, M., and Flyn, P. (1999). Data clustering: A
review. ACM Computing Surveys, 31(3):264–323.
BIOSIGNALS 2008 - International Conference on Bio-inspired Systems and Signal Processing
332

Kishore, J., Patnaik, L., Mani, V., and Arawal, V. (2002).
Application of genetic programming for multicate-
gory pattern classification. IEEE Transaction on
Evoluationary Computation, 4:242–258.
Salem, N. and Nandi, A. (2006a). Segmentation of retinal
blood vessels using scale space features and k-nearest
neighbour classifier. In The 31st International Con-
ference on Acoustics, Speech, and Signal Processing
(ICASSP 2006), Toulouse, France.
Salem, S. and Nandi, A. (2005). New assessment crite-
ria for clustering algorithms. In IEEE international
workshop in Machine Learning For Signal Processing
(MLSP 2005), pages 285–290, Mystic, CT, USA.
Salem, S. and Nandi, A. (2006b). Novel clustering algo-
rithm (RACAL) and a partial supervision strategy for
classification. In IEEE international workshop in Ma-
chine Learning For Signal Processing (MLSP 2006),
pages 313–318, Mynooth, Ireland.
Salem, S., Salem, N., and Nandi, A. (2006). Segmenta-
tion of retinal blood vessels using a novel clustering
algorithm. In 14th European Signal Processing Con-
ference (EUSIPCO 2006), Florence, Italy.
Salem, S., Salem, N., and Nandi, A. (2007). Segmenta-
tion of retinal blood vessels using a novel clustering
algorithm (RACAL) with a partial supervision strat-
egy. Medical and Biological Engineering and Com-
puting, 45(3):261–273.
Theodoridis, S. and Koutroubas, K. (2003). Pattern Recog-
nition. Academic Press, San Diego.
STARE. The STARE project.
http://www.ces.clemson.edu/ ahoover/stare.
UCI. UCI repository of machine learning databases.
http://www.ics.uci.edu/ mlearn/MLRepository.html.
Webb, A. (2003). Statistical Pattern Recognition. John Wil-
ley & Sons, Inc.
Xu, R. and Wunsch, D. (2005). Survey of clustering al-
gorithms. IEEE Transactions on Neural Networks,
16(3):645–677.
DEVELOPMENT OF A PARTIAL SUPERVISION STRATEGY TO AUGMENT A NEAREST NEIGHBOUR
CLUSTERING ALGORITHM FOR BIOMEDICAL DATA CLASSIFICATION
333
