
ANALYSIS OF DIFFERENCES BETWEEN SPECT IMAGES OF
THE LEFT AND RIGHT CEREBRAL HEMISPHERES
IN PATIENTS WITH EPILEPTIC SYMPTOMS
Elżbieta Olejarczyk and Małgorzata Przytulska
Institute of Biocybernetics and Biomedical Engineering PAS, ul. Ks.Trojdena 4, 02-109 Warszawa, Poland
Keywords: SPECT, epilepsy, fractal dimension, entropy.
Abstract: The aim of his work was examination of asymmetries in activity of the left and right cerebral hemispheres
as well as localization and contouring of the regions of reduced or increased activity on the basis of single
photon emission computer tomography (SPECT) images. The mean and standard deviation of normalized
intensities inside the contoured areas of images, entropy based on intensity histograms and Chen’s fractal
dimension were calculated.
1 INTRODUCTION
The aim of his work was examination of
asymmetries in activity of the left and right cerebral
hemispheres as well as localization and contouring
of the regions of reduced or increased activity on the
basis of single photon emission computer
tomography (SPECT) images (Prószyński, 1989).
Advantage of this technique is possibility of brain
activity map acquisition at the time of radiotracer
injection during seizures though the image
registration is done one hour after seizure. SPECT
imaging method allows better spatial localization of
seizure source than the analysis of EEG signal.
Simultaneous EEG signal registration allows to
qualify exactly the moment of seizure onset when
radiotracer injection could be done to register an
unequivocal image. The mean and standard
deviation of normalized intensities inside the
contoured areas of images were calculated. Methods
like entropy based on intensity histograms and
Chen’s fractal dimension were also applied.
2 MATERIALS
The scintigraphic examinations of cerebral perfusion
in 6 patients were performed in the Department of
Nuclear Medicine of the Medical Academy of
Warsaw.
From each patient after delivering them the
HMPAO Tc99m isotope in interictal phase several
transverse cerebral images have been acquired. In
the below-shown series of images they have been
ordered from the basis to the top of the examined
brain; left side of an image corresponds to the right
side of the brain and vice versa.
An increased/reduced cerebral perfusion
corresponds to a higher/lower isotope density and is
manifested by an increased/ reduced image
luminance registered in an 8-bits scale and
normalized to the maximum (256 steps) luminance
level. Images of 128x128 pixels size were registered.
In table 1 several examples of medical description of
the corresponding cases are given.
3 METHODS
In order to evaluate the effectiveness of various
methods the comparative analysis of the images of
the left and right cerebral hemispheres was
performed by using three independent methods:
1. comparison of the mean and standard
deviation values,
2. comparison of estimated entropies,
3. comparison of fractal dimensions.
208
Olejarczyk E. and Przytulska M. (2008).
ANALYSIS OF DIFFERENCES BETWEEN SPECT IMAGES OF THE LEFT AND RIGHT CEREBRAL HEMISPHERES IN PATIENTS WITH EPILEPTIC
SYMPTOMS.
In Proceedings of the First International Conference on Bio-inspired Systems and Signal Processing, pages 208-211
DOI: 10.5220/0001057702080211
Copyright
c
SciTePress

Table 1: Kind of perfusion and localization of the brain region by medical assessment.
Patent name
(slices number)
Kind of perfusion Localization on the image Brain region
CHM (16) Reduced Right upper
Left frontal lobe
KOS (15) Disabled Right
Left temporal lobe
SIE (15) Reduced Right
Left temporal lobe
SZY (14) Disabled Left upper
Right frontal temporal lobe
TWO (15) Disabled Left upper
Right frontal temporal lobe
ZIE (11) Increased Left
Right temporal lobe
(numerous movement artifacts)
3.1 The Mean and Standard Deviation
of Normalized Intensities
The images were processed and analyzed using
standard Image Pro Plus (Media Cybernetics) and
Microsoft Excel software packages (Russ, 1995).
Each image was geometrically divided into the left
and right parts. For a direct visual assessment of
monochromatic images they also were visualized in
pseudocolors. Then the left and right cerebral
hemispheres were automatically contoured and the
mean and standard deviation of normalized
luminances inside the contoured areas of images
were calculated. At the next step the surrounding
background, outside a mask selecting the object of
interest, from the images was reduced to the 0 level.
3.2 Entropy based on Intensity
Histograms
The Shannon’s entropy (Shannon, 1948) of a
probability distribution of image intensities is
defined as:
S = −∑
N
i=1
p
i
log p
i
, ∑
N
i=1
p
i
=1
(1)
where
p
i
, i=1,…N - probability of i-th intensity level.
Entropy based on intensity histogram (Kuczyński
and Mikołajczyk, 2003) can be estimated as:
p
i
=
g
i
/ g
total
(2)
where g
i
- number of pixels with intensity i;
g
total
- total number of pixels;
N - number of image gray levels.
Entropy is a measure of information. The bigger
are changes of pixel intensities the bigger is the
entropy. In this method only a total histograms are
used to calculate entropy therefore the spatial
information is lost.
3.3 Chen’s Fractal Dimension
For image matrices with dimension N x N a multi-
scale vector of difference intensity MSID =
[ri(s1),ri(s2),… ri(sk)], where ri(sk) – mean intensity
of all pairs of pixels at the distance sk, was defined
(Chen, 1989).
If I(x,y) is a measure of intensity (gray level at
point with (x,y) coordinates), then:
ri(sk) = ∑
N-1
x1=0
∑
N-1
y1=0
∑
N-1
x2=0
∑
N-1
y2=0
(|I(x2,y2) -I(x1,y1)|) / number of pixel
pairs for sk scale
(3)
There are the following relations for coordinates x1,
y1, x2, y2:
22
)12()12( yyxxsk −+−=
(4)
|ΔI| =|I(x2,y2) -I(x1,y1)| ~ |Δx|
H
(5)
where
H – Hurst’s exponent (fractal dimension Df = 3-H);
Δx – the distance between points with coordinates
(x2,y2) and (x1,y1).
The logarithms of both sides were calculated:
log |ΔI| ~ H ·log |Δx| (6)
4 RESULTS
4.1 The Mean and Standard Deviation
of Normalized Intensities
The comparative analysis was performed in 6
patients for which mean values and standard
deviations of luminance on the left and right cerebral
hemispheres were measured. In order to make the
results independent on the mean brightness level
data were normalized by calculation of the ratio of
ANALYSIS OF DIFFERENCES BETWEEN SPECT IMAGES OF THE LEFT AND RIGHT CEREBRAL
HEMISPHERES IN PATIENTS WITH EPILEPTIC SYMPTOMS
209
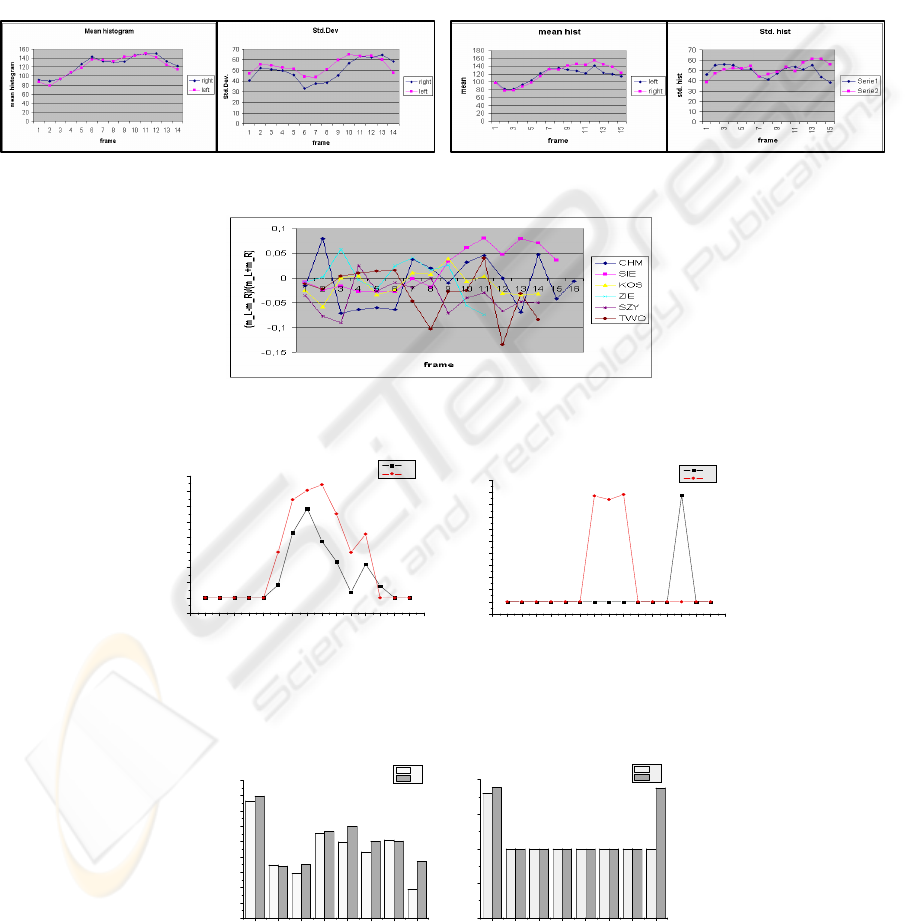
the difference to the sum of mean brightness in the
hemispheres. The regions of reduced/increased
perfusion were localized using the above-described
image segmentation method. The results of
calculations (for two patients mentioned above) are
shown in Fig. 1. The horizontal axes indicate the
numbers of consecutive slices. The normalized
values of mean brightness differences for 6 patients
are shown in Fig. 2.
4.2 Entropy and Fractal Dimension
Entropy and Chen’s fractal dimension were
calculated for all quarters of brain (upper-left, upper-
right, down-left, down-right) in 8 ranges of pixel
intensity: 1-32, 33-64, 65-96, 97-128, 129-160, 161-
192, 193-224, 225-256. Each of four regions of brain
contains 63 x 63 pixels. The ratio of the difference
1.KOS 2. SIE
Figure 1: Mean values and standard deviations of luminance for the left and right cerebral hemispheres, patients KOS, SIE.
Figure 2: Normalized values of mean brightness differences for 6 patients.
0 1 2 3 4 5 6 7 8 9 10 11 12 13 14 15 16
-0.01
0.00
0.01
0.02
0.03
0.04
0.05
0.06
0.07
0.08
entropy
slice number
lu
ru
012345678910111213141516
1.9
2.0
2.1
2.2
2.3
2.4
2.5
2.6
2.7
2.8
2.9
3.0
Chen's fractal dimension
slice number
ld
rd
Figure 3: Entropy and Chen’s fractal dimension graphs for the higher level of pixels intensity (225-256) for patient KOS in
regions of brain in which differences of these measures between both hemispheres are bigger than 10%.
01234567
0.00
0.02
0.04
0.06
0.08
0.10
0.12
0.14
0.16
0.18
entropy
level of pixels intensity
lu
ru
01234567
1.0
1.5
2.0
2.5
3.0
Chen's fractal dimension
level of pixels intensity
ld
rd
Figure 4: Histogram of entropy and Chen’s fractal dimension for all levels of pixels intensity for patient KOS in regions of
brain in which differences of these measures between both hemispheres are bigger than 10%.
BIOSIGNALS 2008 - International Conference on Bio-inspired Systems and Signal Processing
210

to the sum of entropy and Chen’s fractal dimension
for left upper/down respect of right upper/down
quarter of brain was calculated. Entropy results
confirmed the medical observations (Table 2).
Graphs of entropy and Chen’s fractal dimension for
the higher level of pixel intensity (225-256) in
regions of brain for which the differences of these
measures between both hemispheres are bigger than
10% are showed on Fig. 3. Histograms of entropy
and fractal dimension (Fig.4) show significant
differences for the higher level of pixel intensity.
Table 2: Number of slices for which the rate of the
difference to the sum of S or Df in the left and right
hemispheres in range with the biggest intensity of pixels
(from 193 to 256) has values bigger than 0.1 for four
regions of brain (UL-upper left, UR-upper right, DL-down
left, DR-down right).
Pacjent
name
Number of slices
for entropy
UL-UR-DL-DR
Slices number
for fractal
dimension
UL-UR-DL-DR
CHM 1-7-7-0 1-1-0-4
KOS 3-7-8-0 6-1-1-3
SIE 0-9-3-5 1-0-0-0
SZY 10-0-9-0 0-0-0-0
TWO 3-3-2-0 1-0-0-5
ZIE 1-7-4-2 1-1-0-0
5 CONCLUSIONS
The above presented methods of cerebral SPECT
images analysis based on simple image processing
methods and calculation of basic statistical
parameters are effective tools for a preliminary
assessment of cerebral perfusion in diagnosis of
epileptic and/or cerebral ischemic patients. It was
found that for reduced perfusion entropy increases
and Chen’s fractal dimension decreases. Entropy
based on the intensity histograms permits on
automatic perfusion asymmetry evaluation between
left and right brain hemisphere taking into account
only the bigger intensities of pixels (in the range
from 193 to 256). Entropy is a better measure to
estimate the global intensity however without
information about spatial distribution. For
identification of epileptic seizure localization
(concentration of high intensity pixels) Chen’s
fractal dimension seems to be the better measure.In
further work calculations for more patients and for
group of healthy volunteers should be done. Chen’s
fractal dimension could be calculated for less-
dimensional matrices (8 x 8) in sliding window to
construct map of fractal dimension of the whole
brain. It will allow to estimate better the utility of
this method to localize the epileptic seizure and to
compare different regions of interest (ROIs).
ACKNOWLEDGEMENTS
We acknowledge thanks to prof. Leszek Królicki
and dr Adam Bajera from the Department of Nuclear
Medicine of the Medical Academy of Warsaw for
providing databases – the SPECT images registered
for epileptic patients.
This work was supported by Institute of
Biocybernetics and Biomedical Engineering Polish
Academy of Sciences under Grant St/18/07 and
ST/21/07.
REFERENCES
Chen C., Daponte J., Fox M., 1989. Fractal feature
analysis and classification in medical imaging. IEEE
Trans. Med.. Imaging, 8, 133-142.
Kuczyński K., Mikołajczyk P., 2003. Dopasowanie i
segmentacja obrazów medycznych w oparciu o
elementy teorii informacji (in polish). In XIII Krajowa
Konferencja Naukowa Biocybernetyka i Inżynieria
Biomedyczna, Gdańsk, pp. 806-811.
Oczeretko E.S., 2006. Wymiar fraktalny w analizie
sygnałów i obrazów biomedycznych (in polish),
Wydawnictwo Uniwersytetu w Białymstoku,
Białystok.
Shannon C.E., 1948. A Mathematical Theory of
communication. The Bell System Technical Journal,
27, 379-423, 623-659.
Prószyński B., 2006. Radiologia obrazowa RTG, TK,
USG, MR i radioizotopy (in polish), PZWL,
Warszawa.
Russ J.C., 1995. Image processing handbook. 2
nd
edition.
CRC Press, Boca Raton, Ann Arbor, London.
ANALYSIS OF DIFFERENCES BETWEEN SPECT IMAGES OF THE LEFT AND RIGHT CEREBRAL
HEMISPHERES IN PATIENTS WITH EPILEPTIC SYMPTOMS
211
