
EFFECTIVENESS FOR A SLEEPINESS TEST OF PUPIL SIZE
ESTIMATION DURING BLINK
Minoru Nakayama
CRADLE (The Center for Research and Development of Educational Technolgy)
Tokyo Institute of Technology, O-okayama 2–12–1, Meguro-ku, Tokyo, 152–8552, Japan
Keiko Yamamoto, Fumio Kobayashi
Deapartment of Health and Psychosocial Medicine, Aichi Medical University
Karimata Yazako 21, Nagakute-cho, Aichi, 480–1195, Japan
Keywords:
Pupil size, Estimation, Support Vector Regression, Sleepiness test, Pupil Unrest Index.
Abstract:
Pupillary response has been used for an index of sleepiness, but the validity of the index is not clear. In this
paper, the influence of blinks on the Pupillary Unrest Index (PUI) and the Power Spectrum Density (PSD) for
the frequency range 0.01 < f < 0.8Hz, as indices of pupil’s instability during a sleepiness test, was examined.
To estimate pupil size during blink, a procedure for collecting the clinical data was developed using Support
Vector Regression (SVR). The values of PUI increased with experimental time, and the values and deviations
of PUI for experimental observation were larger than the ones with SVR estimation. The blink time also
increased with experimental time, and there were significant correlation relationships between the value of
PUI and blink time. The mean PSD also correlated significantly with blink time. The relationship between
pupillary indices and a subjective sleepiness index was not significant, as it was not in other previous works.
These results provide evidence that pupillary indices were significantly affected by blink, and they did not
reflect sleepiness correctly.
1 INTRODUCTION
Temporal observation of the human eye pupil is called
as pupillography, and these observations can be used
as an index for various human activities (Kuhlmann
and B¨ottcher, 1999; Beatty, 1982). In particular,
pupillography has been used for assessment of sleepi-
ness and exhaustion using the eye sleepiness test,
which consists of measuring the magnitude of pupil-
lary change as a Pupil Unrest Index (PUI) and making
readings of the frequency power spectrum. It is often
applied to clinical observations or used in industrial
engineering situations (L¨udtke et al., 1998; Wilhelm
et al., 1998; Wilhelm et al., 1999). These indices have
been applied to the evaluation of emotional change
(Norrish and Dwyer, 2005); this analysis procedure is
recognized as a significant measure.
Although these indices have also been applied to
diagnostic procedures, a series of research studies of
multiple sclerosis patients suggests that for healthy
people there is no significant correlational relation-
ship between PUI and subjective sleepiness indices
such as the Stanford Sleepiness Score (Egg et al.,
2002; Frauscher et al., 2005). This means that the
evaluation procedure should be examined carefully.
A possible problem with observing the pupil is the
influence of blink (Nakayama and Shimizu, 2001),
because most methods of measuring pupil size are
based upon processing the image of the eye. Blink
can affect measurements due to the eye being ob-
scured by the eye lid during blink. Blinks are
usually discussed as an artifact in temporal obser-
vations such as mean pupil sizes or for results of
frequency analysis (Nakayama and Shimizu, 2001;
Nakayama and Shimizu, 2002). To resolve these
problems, some methods of estimating pupil size dur-
ing blink were developed (Nakayama and Shimizu,
2001; Nakayama, 2005), and the performancewas ex-
amined (Nakayama, 2006).
However, the effectiveness of the estimation pro-
cedure for a diagnostic procedure ( such as an eye
sleepiness test ) and the significance of pupil indices
which include blinks have not been discussed suffi-
ciently. In this paper, we address the influence of
blink and the validity of pupillary indices by exam-
ining the effectiveness of estimating pupil size during
558
Nakayama M., Yamamoto K. and Kobayashi F. (2008).
EFFECTIVENESS FOR A SLEEPINESS TEST OF PUPIL SIZE ESTIMATION DURING BLINK.
In Proceedings of the First International Conference on Bio-inspired Systems and Signal Processing, pages 558-564
DOI: 10.5220/0001058105580564
Copyright
c
SciTePress

Table 1: Analysis condition.
Condition Original method This paper
Sampling
Sampling rate 25Hz 60Hz
Pre-processing moving average moving average
SVR
Average window size 0.4sec. 0.4sec.
PUI
Segment length 2048(82sec.) 4096(68.3sec.)
Unit for segment 16(0.64sec.) 32(0.53sec.)
N of units 128 128
Sampling rate 1.560Hz 1.875Hz
FFT
Data length 2048(82sec.) 4096(68.3sec.)
Frequency range 0.0<f<0.8Hz 0.01<f<0.8Hz, 4Hz
Original method:(L¨udtke et al., 1998; Wilhelm et al., 1999)
blink using the support vector regression (SVR) tech-
nique.
The purposes of this paper are as follows:
1. To develop an estimation procedure using SVR
for clinical pupillary observation.
2. To examine the influence of blink on the pupillary
indices.
3. To examine the relationship between pupil indices
and subjectivesleepiness scores, and the influence
of blinks on them.
2 MEASURING PUPIL SIZE
2.1 Sleepiness Test
The most popular method to assess sleepiness is a
procedure which has been proposed by Wilhelm et
al. (L¨udtke et al., 1998; Wilhelm et al., 1999). The
measuring procedure in this paper was based on the
following method.
The measuring equipment was designed to be
worn on the eyes as goggles (Hamamatsu photon-
ics:C7364). The subjects were asked to wear this
equipment and to gaze at a small red LED light (in-
frared wave length: 890 nm) through the goggles,
with a CCD camera shooting an image of the pupil.
The subjects were instructed to sit and to remain
awake in a semi-dark room in a building during the
experiment, and were also asked to close their eyes
for one minute to promote sleepiness before starting
the experiment. The experiment lasted 12 minutes.
The pupil diameter size was measured at 60 Hz.
This experiment was conducted between 9 a.m.
and 4 p.m. in the late summer. 35 healthy males
joined the experiment, their average age was 37.9
years and the standard deviation was 4.1. They were
volunteer subjects and signed an agreement on the ex-
perimental procedure before it commenced.
Some parameters of the analyzing procedure
which were proposed by Wilhelm et al. (L¨udtke et al.,
1998) depended on the measuring equipment. One
example is the sampling rate of pupil size. The differ-
ences are summarized in Table 1.
2.2 Pre-processing
Pre-processing of pupil size during blink provides a
possible pupil size from the temporal sizes. To ex-
amine the effectiveness of pre-processing, the follow-
ing two pre-processings were created using moving
average method (MOV) and support vector regres-
sion (SVR) (Smola and Scholkopf, 1998; Nakayama,
2005). SVR and the kernel method are often used for
signal reconstruction or smoothening (Bishop, 1995;
Smola and Scholkopf, 1998).
2.2.1 Experimental Observation (Exp.)
This data set consisted of experimental observations
without any pre-processing. During the periods of
blink, the pupil diameter shows that the size was mea-
sured as 0.
2.2.2 Moving Average (MOV)
Moving average method was applied to exclude a
large deviation caused by blink and noise. Wilhelm
et al. conducted this method for every data series of
0.4 sec. (L¨udtke et al., 1998; Wilhelm et al., 1999).
This means that the sampling rate is reduced to 2.5
Hz.
2.2.3 Estimation with Svr
This processing provided estimation diameters dur-
ing blink using support vector regression (SVR) with
Gaussian kernel (Smola and Scholkopf, 1998). The
estimation function was derived from the training
data. This training data, as a prototype of pupil re-
sponse, consisted of measured pupil diameters during
the blink and estimated pupil sizes. To produce the
training data, a set of data containing 5000 data points
collected at the beginning of observations was pre-
pared. To obtain an optimized model, the dimension
n of input vector, and a precision ε(eps) and σ(std)
of Gaussian kernel needed to be calculated. A prac-
tical calculation was conducted using the SVMTorch
package (Collobert and Bengio, 2001), and parame-
ters were optimized. As a result, the following param-
eters were provided: input dimension = 45; σ = 40;
EFFECTIVENESS FOR A SLEEPINESS TEST OF PUPIL SIZE ESTIMATION DURING BLINK
559
0
2
4
6
4
6
4
6
Pupil diameter (mm)
0 5 10
Time (sec.)
Exp.
MOV
SVR
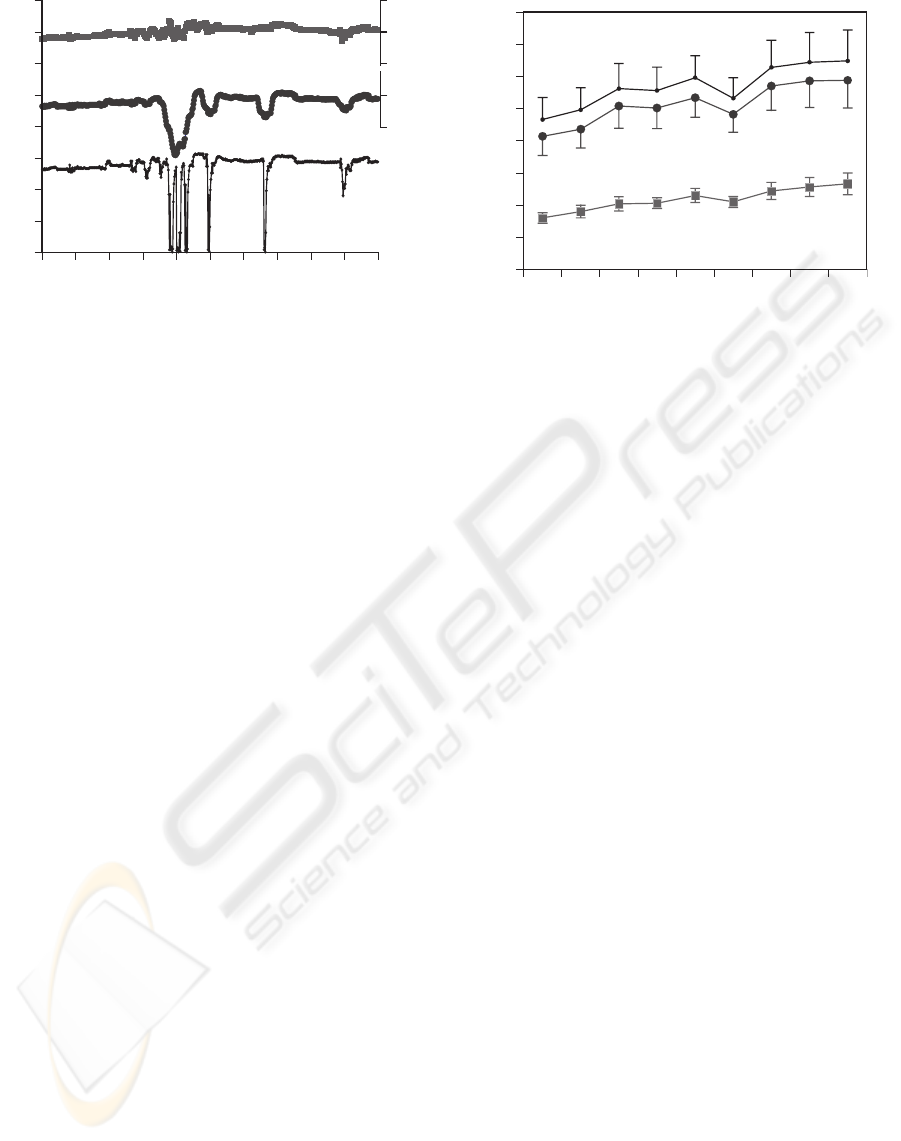
Figure 1: Example of pre-processing for pupillary change
during blink.
ε = 0.5. Estimation accuracy was examined in the
previous estimation experiments (Nakayama, 2006).
3 RESULTS
3.1 Results of Pre-processing
To examine the pupil size pre-processing perfor-
mance, an example of experimental pupil size and
processed data for 10 seconds is illustrated in Fig-
ure 1, listed from bottom to top as Exp., MOV and
SVR. The horizontal axis shows time, the vertical axis
shows pupil size with drops indicating blinks. Pre-
processing with MOV shows that temporal changes
are influenced by blink and all points are smoothened,
although there is no null point during blink periods.
On the other hand, SVR indicates the same pupil size
without large blink drops and gives possible sizes of
pupil diameters during blinks. As a result, an appro-
priate estimation procedure for clinical pupillography
can be developed from this.
3.2 Results of Pupillary Unrest Index
(PUI)
PUI as an index of instability of pupillography was
calculated following a procedure which was modified
from the original method using the parameters listed
in Table 1. According to the definition of PUI as
cumulative changes in pupil diameter (L¨udtke et al.,
1998), firstly the data were reduced by calculating the
average for periods of 32 (0.53 sec.) consecutive val-
ues, secondly the absolute values of the differences
from one 32-value average to the next one were sum-
marized for each 68.3 sec. data segment, namely 127
differences for one segment. Calculating the average
0
5
10
15
20
25
30
35
40
0
5
10
15
20
25
30
35
40
Exp.
MOV
SVR
1 2 3 4 5 6 7 8 9
Segment No.
Pupil Unrest Index (PUI)
Figure 2: Result of PUIs across segments and pre-
processing procedures.
prior to cumulation serves as a simple low pass filter-
ing and excludes high frequency noise.
Average PUIs with standard error bars across the
pre-processing procedure results were summarized in
Figure 2. PUIs for Exp. and MOV conditions are sig-
nificantly higher than the ones for SVR. According to
the estimation procedure, PUI increases when pupil-
lary temporal change includes blink drop. Therefore,
PUIs for Exp. and MOV were relatively high.
Also, sleepiness may increase gradually with ex-
perimental time, so this suggests that the gradual
increase may depend on sleepiness. According to
the pre-processed PUI results and a previous work
(Nakayama, 2006), the biggest factor in PUI change
must be blink frequency, however.
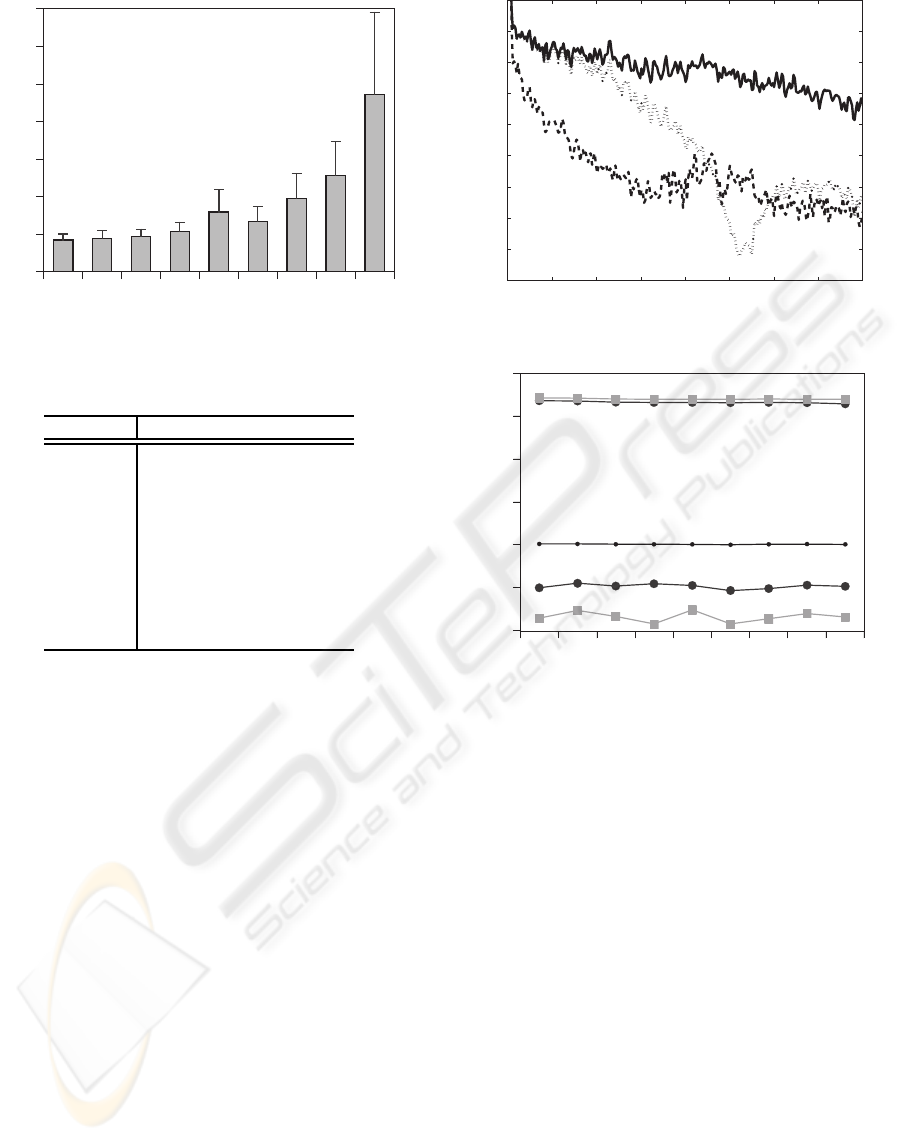
3.3 Blink Time
Blink may influence a sleepiness index according to
the results of PUI. Blink time is defined as the sum of
blink drop duration of measured pupil diameters. Av-
erage blink times for each segment (68.3 sec.) were
summarized as bar graphs with standard error bars in
Figure 3. The figure shows that the blink time in-
creases monotonically with the sequence number of
the segment excepting segment 5. According to blink
research, the estimated blink time may be around 1
minute per segment in the standard condition (Tada
et al., 1991). It was suggested that the blink time after
segment 5 was longer than the one for the standard
condition.
These results also indicated that blink influenced
PUIs. To examine the relationship between PUI and
blink time, correlation coefficients were calculated
across all segments and preprocessing procedures.
The coefficients were summarized in Table 2. Most
coefficients were significant (p < 0.05). During seg-
BIOSIGNALS 2008 - International Conference on Bio-inspired Systems and Signal Processing
560
0
1
2
3
4
5
6
7
1 2 3 4 5 6 7 8 9
Segment No.
Blink time (sec.)
Figure 3: Average blink time for segments.
Table 2: Correlation coefficient between PUI and blink
time.
Seg. No. Exp. MOV SVR
1 0.95 0.95 0.42
2 0.91 0.92 0.71
3 0.93 0.92 (0.23)
4 0.90 0.92 0.41
5 0.42 0.45 0.41
6 0.64 0.65 0.34
7 0.55 0.58 0.63
8 0.69 0.70 0.58
9 (0.16) (0.18) 0.35
N=35, ( ) not significant
ment numbers 1 to 4, there were large correlation co-
efficients for pupil diameters with blink times for Exp.
and MOV rather than for correlation coefficients for
SVR. Coefficients across all pre-processing stayed at
same levels after segment number 5, when the blink
times were longer than the ones in the standard con-
dition.
These results showed that blink significantly af-
fected PUI changes in the standard condition, and the
effectiveness of pre-processing for pupils was exam-
ined while the blink times stayed at the standard level.
The relationship was also affected by the incidence of
additional blinking. Furthermore, these results sug-
gested the blink time affected PUIs despite the con-
ducting of estimations of pupil size during blink.
3.4 Frequency Analysis
Frequency power value of pupillary change, which is
given by frequency analysis over 68.3 sec., can be
used as another index of sleepiness (L¨udtke et al.,
1998; Wilhelm et al., 1999). According to the pro-
cedure, the power spectrum of pupil diameter change
was summarized. Figure 4 shows the results of Power
1 2 3 4
0
10
-10
-20
-30
0
Frequency (Hz)
Power Spectrum Density (dB)
Exp.
MOV
SVR
Figure 4: PSD of pupillography across pre-processing.
-40
-20
0
20
40
60
80
Exp.(0.01<f<0.8)
MOV(0.01<f<0.8)
SVR(0.01<f<0.8)
Exp.(1.5<f<3.5)
MOV(1.5<f<3.5)
SVR(1.5<f<3.5)
1 2 3 4 5 6 7 8 9
Segment No.
Mean PSD (dB)
Figure 5: Averaged PSD of each segment for two frequency
ranges.
Spectrum Density (PSD) for the first segment of one
subject. PSD was estimated with pwelch function and
Parzen window function of MATLAB (MathWorks
Inc.). The vertical axis shows PSD in decibels (dB)
and the horizontal axis shows frequency (Hz) from
0.01 to 4.0 Hz. DC component as frequency power
was excepted in following analysis. The pupillary
change has a low pass filter as low as 4 Hz because
it is biological signal, and also pupilograms contain
0.05 ∼ 0.3 Hz components which are well known as
pupillary noise (Tsukahara, 1976).
During sleepiness tests, the average power value
for the frequency range (0.01 < f < 0.8Hz) is often
evaluated as the index (L¨udtke et al., 1998; Wilhelm
et al., 1999). The average PSD for frequency range
(0.01 < f < 0.8Hz) for each segment was compared
between pre-processing procedures. The results were
summarized in Figure 5. According to the results
of frequency analysis for the task evoked pupillog-
raphy, PSDs of frequency range (1.5 < f < 3.5Hz)
changed significantly in response to the task diffi-
culty. Therefore, average PSDs for frequency range
EFFECTIVENESS FOR A SLEEPINESS TEST OF PUPIL SIZE ESTIMATION DURING BLINK
561

Table 3: Correlation coefficients between PSDs and blink
for two frequency ranges.
Seg. 0.01 < f < 0.8Hz 1.5 < f < 3.5Hz
No. Exp. MOV SVR Exp. MOV SVR
1 -.36 -.36 (-.29) 0.81 0.86 0.44
2 -.38 -.38 (-.25) 0.86 0.87 0.65
3 -.35 -.36 (-.30) 0.65 0.77 (0.20)
4 -.53 -.53 -.51 0.57 0.63 (0.21)
5 -.42 -.42 -.37 (0.11) (0.15) (-.03)
6 -.47 -.46 -.47 (0.28) 0.37 (0.10)
7 -.52 -.52 -.46 (0.13) (0.20) (0.19)
8 -.55 -.55 -.53 (0.31) 0.45 (0.20)
9 -.62 -.62 (-.30) (-.10) (-.07) (-.07)
N=35, ( ) not significant
(1.5 < f < 3.5Hz) were also summarized in the same
format in Figure 5. The figure shows that PSDs for
(0.01 < f < 0.8Hz) are at the same level across seg-
ments and pre-processing procedures. The PSDs for
(1.5 < f < 3.5Hz) have some differences amongst
pre-processing, but they stay at the same levels dur-
ing each experimental time point. This suggests that
PSDs are not affected by a change in blink time, such
as during a change in the level of sleepiness.
3.5 Blink Influence On Psd
To examine the influence of blink, correlation coeffi-
cients between blink time and average PSDs for two
frequency ranges (0.01 < f < 0.8Hz and 1.5 < f <
3.5Hz) across pre-processing procedures were calcu-
lated. The results were summarized in Table 3.
All coefficients for the frequency range (0.01 <
f < 0.8Hz) were negative values and significant ex-
cept for some coefficients for SVR. There was no sig-
nificant relationship between SVR and blink time dur-
ing the first three segments, and some absolute values
of coefficients for SVR were relatively smaller than
the ones for Exp. and MOV. Most PSDs for frequency
range (0.01 < f < 0.8Hz) correlated with blink time,
however. This suggests that PSDs depend on blink
time, and that the relationship is affected by the pre-
processing procedure. Also, PSDs of Exp. and MOV
for frequencyrange (1.5 < f < 3.5Hz) correlated with
blink time during segments 1-4. There were no signif-
icant relationships between them after Segment No.
5, while blink time was longer than in the standard
condition, however. These correlation relationships
seem to be caused by blinks.
3.6 Relationship with a Subjective Score
Subjective sleepiness was measured for each subject
using the Stanford Sleepiness Score (SSS) (Hoddes
et al., 1973). 33 out of 35 subjects responded to
0
1
2
3
4
5
6
7
8
9
10
1 2 3 4 5 6 7 8 9
Segment No.
Blink time (sec.)
High
Low
Figure 6: Averaged blink time across two sleepiness groups.
0
5
10
15
20
25
30
35
40
0
5
10
15
20
25
30
35
40
1 2 3 4 5 6 7 8 9
Segment No.
Pupil Unrest Index (PUI)
Exp.
MOV
SVR
H
L
H
H
L
L
Figure 7: PUI changes with pre-processing procedures and
two sleepiness groups.
this questionnaire. The scores were distributed from
2 to 4 on a 7 point scale. The correlation relation-
ships of SSS with both PUIs and PSDs were exam-
ined. The absolute value of the correlation coeffi-
cients (r) were less than 0.15 and they were not sig-
nificant (p > 0.10), because all subjects were healthy
and scores were distributed in a narrow range. There-
fore, indices of pupillography do not correlate with
the subjective scores as well as in previous works
(Egg et al., 2002; Frauscher et al., 2005).
4 DISCUSSION
The two observations and suggested causes which
have been reported in this paper are examined here;
there is an influence of blink on pupillary indices
(Nakayama, 2005; Nakayama, 2006), and there is no-
correlation between pupillary indices and subjective
sleepiness (Egg et al., 2002; Frauscher et al., 2005).
There was some distribution of subjective sleepiness
BIOSIGNALS 2008 - International Conference on Bio-inspired Systems and Signal Processing
562

Table 4: Correlation coefficients between PSD and blink time across pre-processing procedures and two sleepiness groups.
0.01 < f < 0.8Hz 1.5 < f < 3.5Hz
Seg. High sleepiness Low sleepiness High sleepiness Low sleepiness
No. Exp. MOV SVR Exp. MOV SVR Exp. MOV SVR Exp. MOV SVR
1 (-.25) (-.25) (-.15) -.60 -.60 -.58 0.82 0.78 0.57 0.88 0.97 (0.18)
2 (-.33) (-.33) (-.15) (-.53) (-.53) (-.52) 0.88 0.88 0.74 0.87 0.96 (0.19)
3 (-.35) (-.35) (-.29) (-.37) (-.37) (-.31) 0.76 0.78 (0.04) 0.57 0.77 (0.38)
4 -.56 -.57 -.56 (-.51) (-.51) (-.44) 0.52 0.55 (0.15) 0.68 0.84 (0.27)
5 -.46 -.46 (-.41) (-.51) (-.51) (-.47) (0.04) (0.07) (-.12) (0.54) 0.71 (0.13)
6 -.59 -.59 -.61 (-.50) (-.50) (-.47) 0.42 (0.47) (0.01) (0.20) (0.31) (0.18)
7 -.55 -.55 -.51 (-.55) (-.55) (-.48) (0.09) (0.14) (0.31) (0.35) (0.48) (0.20)
8 -.60 -.60 -.62 -.65 -.65 -.60 (0.34) 0.48 0.55 0.60 0.71 (0.19)
9 -.68 -.68 (-.37) (-.32) (-.32) (-.31) (-.17) (-.14) (-.15) (0.45) 0.69 (0.11)
N=35, ( ) not significant
in this experiment, such as between 2 and 5 on the
7 point scale, therefore the effect of the difference in
the subjective sleepiness on the indices was analyzed.
Firstly, 33 responded subjects were divided into two
groups; the low sleepiness group consisted of 13 sub-
jects who answered 2 on the 7 point scale of sleepi-
ness, and the high sleepiness group consisted of 20
subjects who answered 3 to 5 on the 7 point scale of
sleepiness, with an average rate of 3.4.
Blink time for each segment was summarized
across two groups in Figure 6 using the same format
as in Figure 3. In Figure 6, bars show average blink
times with error bars as standard errors. In compar-
ing the two groups, the temporal change in segment
sequences were quite different. Blink times for the
high sleepiness group increased monotonically, and
the standard errors also increased with the average.
Blink times for the high sleepiness group in the 8th
segment became 7 times the length of the time of the
1st segment. On the other hand, the average blink
times for the low sleepiness group did not change dur-
ing the experiment. There were no significant differ-
ences in blink time between the two groups because
of the large deviation in blink time, however. If blink
time reflects sleepiness, the differences in blink time
between the two groups may significantly affect the
variation in the subjective sleepiness score.
PUIs for two groups were summarized in Figure 7
using the same format as in Figure 2. Differences of
PUIs for Exp. and MOV between the two groups in-
creased with experimental time. Also, the differences
in PUI for SVR between the two groups was small
and almost constant during the experiment. There
was no significant difference in PUI between the two
groups and three pre-processing procedures because
of the large deviation in PUI, particularly for the high
sleepiness group. Although there was no significant
difference between the two groups, it was noted that
blink affected PUI values on pupil diameter observa-
tions when blinks were not processed appropriately.
To examine the relationship between PSDs and
subjectivesleepiness, correlation coefficientsbetween
averaged PSDs and blink times for the two groups
were summarized in Table 4 using the same format
as in Table 3. Comparing correlation coefficients be-
tween the two groups of subjective sleepiness ratings,
the significance of coefficientsfor the frequencyrange
0.01 < f < 0.8Hz changed across the two groups. Co-
efficients in the frequency rage 1.5 < f < 3.5Hz were
relatively stable with the subjective sleepiness ratings.
According to the results, coefficients between PSD
and blink time depend on both the pre-processing pro-
cedure for blink and the subjective sleepiness rating.
For coefficients in the frequency range 1.5 < f <
3.5Hz, the effect of the subjective sleepiness rating
was relatively smaller than the effect in the frequency
range 0.01 < f < 0.8Hz.
The results of analyzing pupil indices during the
sleepiness test coincide with the clinical claims (Egg
et al., 2002; Frauscher et al., 2005); PUI does not
correlate with subjective sleepiness such as SSS. Al-
though it was suggested that the frequency power of
0.01 < f < 0.8Hz reflected the subjective sleepiness
(L¨udtke et al., 1998; Wilhelm et al., 1998; Wilhelm
et al., 1999), the relationship was not confirmed in
this experiment. Additionally, even the influence of
blink when the blink drops during a temporal change
of pupil size were removed was examined. Consider-
ing the empirical evidence from these clinical obser-
vations, a sleepiness evaluation procedure should be
developed. A discussion of this will be the subject of
our further study.
5 CONCLUSIONS
In this paper, we used pupillography to examine the
influence of blink and validity of pupillary indices by
analyzing a clinical sleepiness test.
The following results were achieved:
EFFECTIVENESS FOR A SLEEPINESS TEST OF PUPIL SIZE ESTIMATION DURING BLINK
563

1. A pupil size during blink estimation procedure us-
ing the Support Vector Regression technique for
clinical pupillary observation was developed and
an appropriate level of performance was obtained.
2. The influence of blink in pupillary indices such
as Pupil Unrest Index (PUI) and Power Spectrum
Density (PSD) of pupillographywas examined. In
particular, it was shown that blink time increased
monotonically with experimental time, therefore
the influence of blink changed as the experiment
progressed.
3. The relationship between pupil indices and sub-
jective sleepiness scores such as the Stanford
Sleepiness Score (SSS) was analyzed. There was
no significant relationship, but there were some
differences in pupil indices between high and low
SSS groups.
Development of a sleepiness test evaluation procedure
which considers blink and other factors will be the
subject of our further study.
ACKNOWLEDGEMENTS
We would like to thank Dr. Misuzu Watanabe,
Dr. Reiko Hori and Dr. Hirohito Tsuboi, Aichi Med-
ical University, who kindly provided us with the op-
portunity to analyze pupillography data collected dur-
ing their sleepiness tests.
REFERENCES
Beatty, J. (1982). Task-evoked pupillary response, process-
ing load, and the structure of processing resources.
Psychological Bulletin, 91(2):276–292.
Bishop, C. M., editor (1995). Neural Networks for Pattern
Recognition. Oxford University Press, Oxford, UK.
Collobert, R. and Bengio, S. (2001). Svmtorch: Support
vector machines for large-scale regression problems.
Journal of Machine Learning Research, 1:143–160.
Egg, R., H¨ogl, B., Glatzl, S., Beer, R., and Berger, T.
(2002). Autonomic instability, as measured by pupil-
lary unrest, is not associated with multiple sclerosis
fatigue severity. Multiple Sclerosis, 8:256–260.
Frauscher, B., Egg, R., Brandauer, E., Ulmer, H., Berger, T.,
Poewe, W., and H¨ogl, B. (2005). Daytime sleepiness
is not increased in mild to moderate multiple sclerosis:
a pupillographic study. Sleep Medicine, 6:543–547.
Hoddes, E., Zarcone, V., Smythe, H., Phillips, R., and De-
ment, W. C. (1973). Quantification of Sleepiness. Psy-
chlophysiology, 10(4):431–436.
Kuhlmann, J. and B¨ottcher, M., editors (1999). Pupil-
lography: Principles, Methods and Applications.
W. Zuckschwerdt Verlag, Munchen, Germany.
L¨udtke, H., Wilhelm, B., Adler, M., Schaeffel, F., and Wil-
helm, H. (1998). Mathematical procedures in data
recording and processing of pupillary fatigue waves.
Vision Research, 38:2889–2896.
Nakayama, M. (2005). Estimation of eye-pupil size during
blink by support vector regression. In Modelling Nat-
ural Action and Selection: Proc. of an International
Workshop, pages 121–126.
Nakayama, M. (2006). Influence of blink on pupillary in-
dices. In IEEE BioCAS 2006: Proceeding of Biomed-
ical Circuits and Systems Conference, pages 29–32.
Nakayama, M. and Shimizu, Y. (2001). An estimation
model of pupil size for blink artifact in viewing TV
programs. IEICE Transactions, J84-A:969–977.
Nakayama, M. and Shimizu, Y. (2002). An estimation
model of pupil size for ‘blink artifact’ and it’s applica-
tions. In Proc. 10th European Symposium on Artificial
Neural Networks, (ESANN ’02), pages 251–256.
Norrish, M. I. K. and Dwyer, K. L. (2005). Preliminary
investigation of the effect of peppermint oil on an ob-
jective measure of daytime sleepiness. International
Journal of Psychophysiology, 55:291–298.
Smola, A. J. and Sch¨olkopf, Y. (1998). A tutorial on support
vector regression. NeuroCOLT2 Technical Report Se-
ries NC2-TR-1998-030.
Tada, H., Yamada, F., and Fukuda, K. (1991). Psychological
blink (in Japanese). Kita-Ouji-Shobo, Kyoto, Japan.
Tsukahara, N. (1976). Control system of vertebrate and cen-
tral nervous system (in Japanese), volume 6 of Biolog-
ical Science. Asakura Shoten, Tokyo, Japan.
Wilhelm, B., L¨udtke, H., and Wilhelm, H. (1999). Spon-
taneous pupillary oscillations, Volume 18 of Clinical
Pharmacology. W. Zuckschwerdt Verlag, Munchen,
Germany.
Wilhelm, B., Wilhelm, H., L¨udtke, H., Streicher, P., and
Adler, M. (1998). Pupillographic assessment of
sleepiness in sleep–deprived healthy subjects. SLEEP,
21(3):258–265.
BIOSIGNALS 2008 - International Conference on Bio-inspired Systems and Signal Processing
564
