
NONLINEAR MODELING OF CARDIOVASCULAR
RESPONSE TO EXERCISE
Lu Wang
1
, Steven W. Su
2,1
, Gregory S. H. Chan
1
, Branko G. Celler
1
*, Teddy M. Cheng
1
and Andrey V. Savkin
1
1
Biomedical System Lab, School of Electrical Engineering & Telecommunications, Faculty of Engineering
University of New South Wales, UNSW Sydney, N.S.W. 2052, Australia
2
Key University Research Centre for Health Technologies, Faculty of Engineering, University of Technology
Sydney,PO Box 123 Broadway NSW 2007 Australia
Keywords: Cardiovascular system, Nonlinear modelling, Cardiovascular responses to Exercise, Machine learning.
Abstract: This study experimentally investigates the relationships between central cardiovascular variables and
oxygen uptake based on nonlinear analysis and modeling. Ten healthy subjects were studied using cycle-
ergometry exercise tests with constant workloads ranging from 25 Watt to 125 Watt. Breath by breath gas
exchange, heart rate, cardiac output, stroke volume and blood pressure were measured at each stage. The
modeling results proved that the nonlinear modeling method (Support Vector Regression) outperforms
traditional regression method (reducing Estimation Error between 59% and 80%, reducing Testing Error
between 53% and 72%) and is the ideal approach in the modeling of physiological data, especially with
small training data set.
1 INTRODUCTION
The relationships between central cardiovascular
variables and oxygen uptake during steady state of
graded exercise have been widely examined by
numerous investigators (Allor et al., 2000) (Astrand
et al., 1964) (Fairbarn et al., 1994) (Freedman et al.,
1955) (Kobayashi et al., 1978) (Reeves et al., 1961)
(Richard et al., 2004) (Rowland et al., 1997) (Turley
et al., 1997). Most of them investigated the
relationship between cardiac output (CO) and
oxygen uptake (
2
OV
) using linear regression
methods and found the slope between the two
variables to be approximately 5 – 6 in normal and
athletic subjects (Rowell et al., 1986). Beck et al
(Beck et al., 2006) in contrast, investigated this
relationship in healthy humans using polynomial
regression. Turley (Turley et al., 1997) described
both the relationship of stroke volume (SV) and the
total peripheral resistance (TPR) to oxygen uptake
during steady state of sub-maximal exercise using
linear regression. However, from the point view of
modeling, the regression methods used by the
previous researchers have several limitations. First
the empirical risk minimization (ERM) principle
used by traditional regression models does not
guarantee good generalization performance and may
produce models that over-fit the data (Gunn, 1997).
Secondly, most of the regression models developed
from early research based on a small sample set with
limited subjects during three or four exercise
intensities. Traditional regression approachs are
particularly not recommended for modeling small
training sets. Determination of the size of the
training set is a main issue to be solved in the
modeling performance because the sufficiency and
efficiency of the training set is one of the most
important factors to be considered.
This study presents a novel machine learning
approach, Support Vector Regression (SVR)
(Drucker et al., 1997) to model the central
cardiovascular response to exercise. SVR, developed
by Vapnik and his co-workers in 1995, has been
widely applied in forecasting and regression (Su et
al., 2007) (Su et al., 2005) (Su et al., 2006) (Valerity
et al., 2003). The following characteristics of SVR
make it an ideal approach in modeling of
cardiovascular system. Firstly, SVR avoids the over-
fitting problem which exists in the traditional
modeling approaches. Second, SVR condenses
information in the training data and provide a sparse
40
Wang L., W. Su S., S. H. Chan G., G. Celler B., M. Cheng T. and V. Savkin A. (2008).
NONLINEAR MODELING OF CARDIOVASCULAR RESPONSE TO EXERCISE.
In Proceedings of the First International Conference on Bio-inspired Systems and Signal Processing, pages 40-46
DOI: 10.5220/0001059000400046
Copyright
c
SciTePress

representation by using a small number of data
points (Girosi, 1998). Thirdly, SVR is insensitive to
modeling assumption due to its being a non-
parametric model structure. Finally, the SVR model
is unique and globally optimal, unlike traditional
training which can risk converging to local minima.
The rest of this paper is organized as follows:
section 2 describes the experimental design for the
data collection. Section 3 applies SVR for modeling
the relationships between central cardiovascular
variables and oxygen uptake. Finally, some
conclusions are drawn in Section 4.
2 EXPERIMENTAL DESIGN
2.1 Subjects
We studied 12 normal male subjects. They are all
active, but do not participate in formal training or
organized sports. However, since two of them could
not complete 6 minutes of higher level exercise, only
the data recorded from 10 subjects (aged 25 ± 4yr,
height 177 ± 5cm, body weight 73 ± 11kg) are used
for this study. All the subjects knew the protocol and
the potential risks, and had given their informed
consent.
2.2 Experimental Procedure
All tests were conducted in the afternoon in an air-
conditioned laboratory with temperature maintained
between 23-24
o
C. The subjects were studied during
rest and a series of exercise in an upright position on
an electronically braked cycle ergometer. Exercise
was maintained at a constant workload for 6
minutes, followed by a period of rest. The initial
exercise level was 25W and each successive stint of
exercise was increased in 25W steps until a
workload of 125W was reached. The rest periods
were increased progressively from 10 to 30 minutes
after each stint of exercise. Six minutes of exercise
was long enough to approach a steady state since the
values of oxygen uptake and the A-V oxygen
difference had become stable by the 5th and 6th
minutes even for near maximum exertion (Reeves et
al., 1961).
2.3 Measurement and Data Processing
Heart rate was monitored beat by beat using a single
lead ECG instrument, while ventilation and
pulmonary exchange were measured on a breath by
breath basis. Minute ventilation was measured
during inspiration using a Turbine Flow Transducer
model K520-C521 (Applied Electrochemistry,
USA). Pulmonary gas exchange was measured using
S-3A and CD-3A gas analyzers (Applied
Electrochemistry, USA). Before each individual
exercise test, the turbine flow meter was calibrated
using a 3.0 liters calibration syringe. Before and
after each test, the gas analyzers were calibrated
using reference gases with known O
2
and CO
2
concentrations. The outputs of the ECG, the flow
transducer and the gas analyzers were interfaced to a
laptop through an A/D converter (NI DAQ 6062E)
with a sampling rate of 500 Hz. Programs were
developed in Labview 7.0 for breath by breath
determination of pulmonary gas exchange variables
but with particular reference to
2
OV
(
2
OV
STPD).
Beat by beat stroke volume and cardiac outputs were
measured noninvasively using the ultrasound based
device (USCOM, Sydney, Australia) at the
ascending aorta. This device has previously been
reported to be both accurate and reproducible
(Knobloch et al., 2005). In order to keep consistent
measurements, all CO/SV measurements were
conducted by the same person. An oscillometric
blood pressure measurement device (CBM-700,
Colin, France) was used to measure blood pressure.
The measurement of
2
OV
and HR were
conducted during the whole exercise and recovery
stage. The static values (
2
OV
and HR) were
calculated for each workload from data collected in
the last minute of the six minute exercise protocol.
The measurements of SV, CO and BP (blood
pressure) were similarly conducted during the last
minute of the six minute exercise for each workload
with the additional requirement that subjects keep
their upper body as still as possible to minimize
artifacts caused by the movement of the chest during
exercise. We then, calculated their static values (CO,
SV and BP) based on the measurement in the last
minute for each workload.
2.4 Results
We found that the percentage changes of
cardiovascular variables relative to their rest values
more uniform than when absolute values are used.
This may be because using relative values diminish
the variability between subjects. For example,
Figure 1 (a) shows the relationship between the
absolute value of mean arterial blood pressure
response and the absolute value of oxygen uptake
rate for all the ten subjects, while Figure 1 (b) is the
percentage change in mean arterial blood pressure
relative to its rest value with the percentage change
in oxygen uptake rate to its rest value for the ten
NONLINEAR MODELING OF CARDIOVASCULAR RESPONSE TO EXERCISE
41
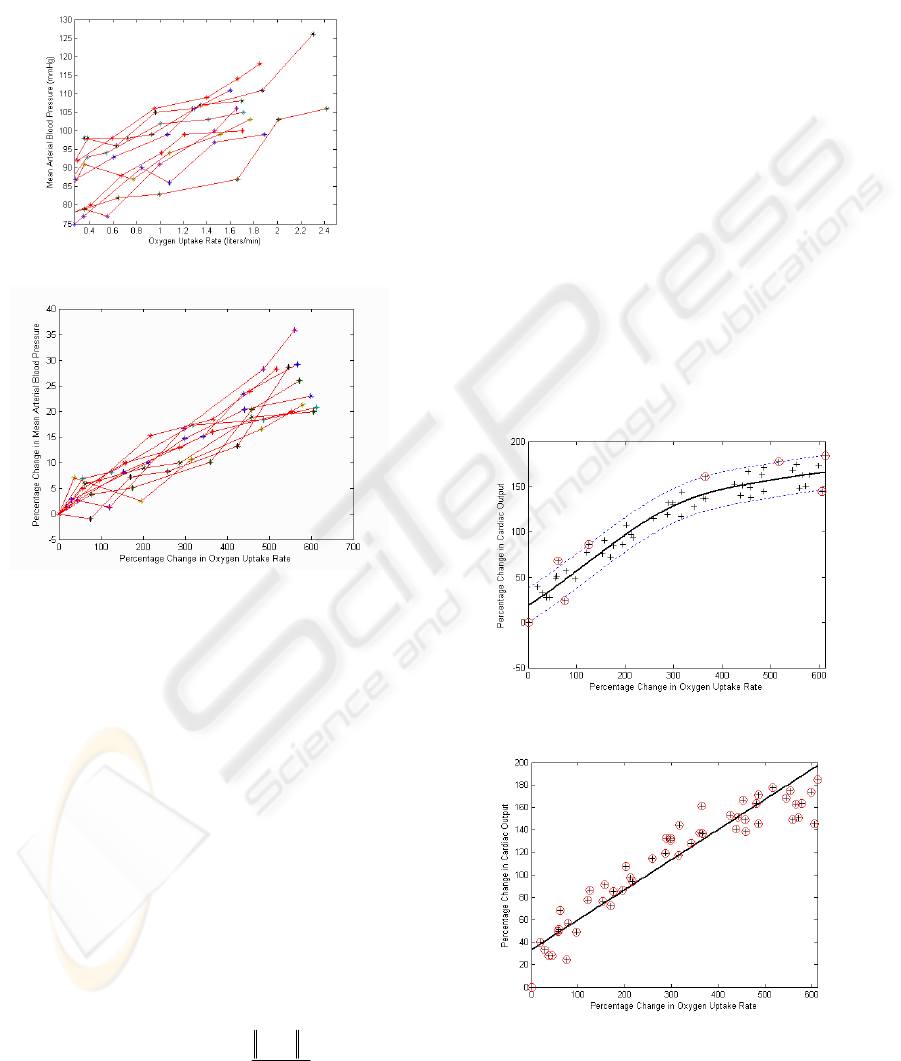
subjects. Obviously, the response in Figure 1 (b) is
more consistent and gives clearer trend than that in
Figure 1 (a). It is thus reasonable to believe that
modeling of cardiovascular responses using relative
changes may give more robust results than modeling
with the absolute values.
(a). Mean arterial blood pressure response to oxygen
uptake rate (in absolute value).
(b). Mean arterial blood pressure response to oxygen
uptake rate (in relative value).
Figure 1: Mean arterial blood pressure response to oxygen
uptake rate for the ten subjects.
Based on the above finding, we model CO, SV
and TPR to
2
OV
by modeling the percentage
changes in CO, SV and TPR with respect to their
corresponding rest values to percentage change in
2
OV
with respect to its rest value. We use CO%,
SV%, TPR% and
2
OV
% to represent their relative
values (expressed as percentage), respectively.
3 APPLICATION OF SVR FOR
MODELING
We selected radial basic function (RBF) kernels for
this study, that is
)
2
2
2
exp(),(
σ
i
xx
i
xxK
−
−=
where
σ
is
the kernel parameter,
i
x is the ith input support
value and
x
is the input value.
Detailed discussion about SVR, such as the
selection of regularization constant
C
, radius
ε
of
the tube and kernel function, can be found in (Gunn,
1997) (Vapnik, 1998).
In order to show the effectiveness of SVR, we
applied both SVR and traditional linear regression
(Least-Square linear regression (LS)) to investigate
the relationships between percentage change of
cardiovascular variables (CO%, SV% and TPR%)
and
2
OV
%.
3.1 The Relationship between CO%
and
2
OV
%
3.1.1 Model Identification
A SVR model was developed to estimate CO% from
2
OV
% (Table 1 and Figure 2). Although it is widely
accepted that there is a linear relationship between
cardiac output and oxygen consumption (Allor et al.,
2000) (Astrand et al., 1964) (Freedman et al., 1955),
(a). Estimation of percentage change in CO from
percentage change in
2
OV
using SVR.
(b). Estimation of percentage change in CO from
percentage change in
2
OV
using LS.
Figure 2: Comparison of estimation results of CO%
between using SVR and using LS.
BIOSIGNALS 2008 - International Conference on Bio-inspired Systems and Signal Processing
42
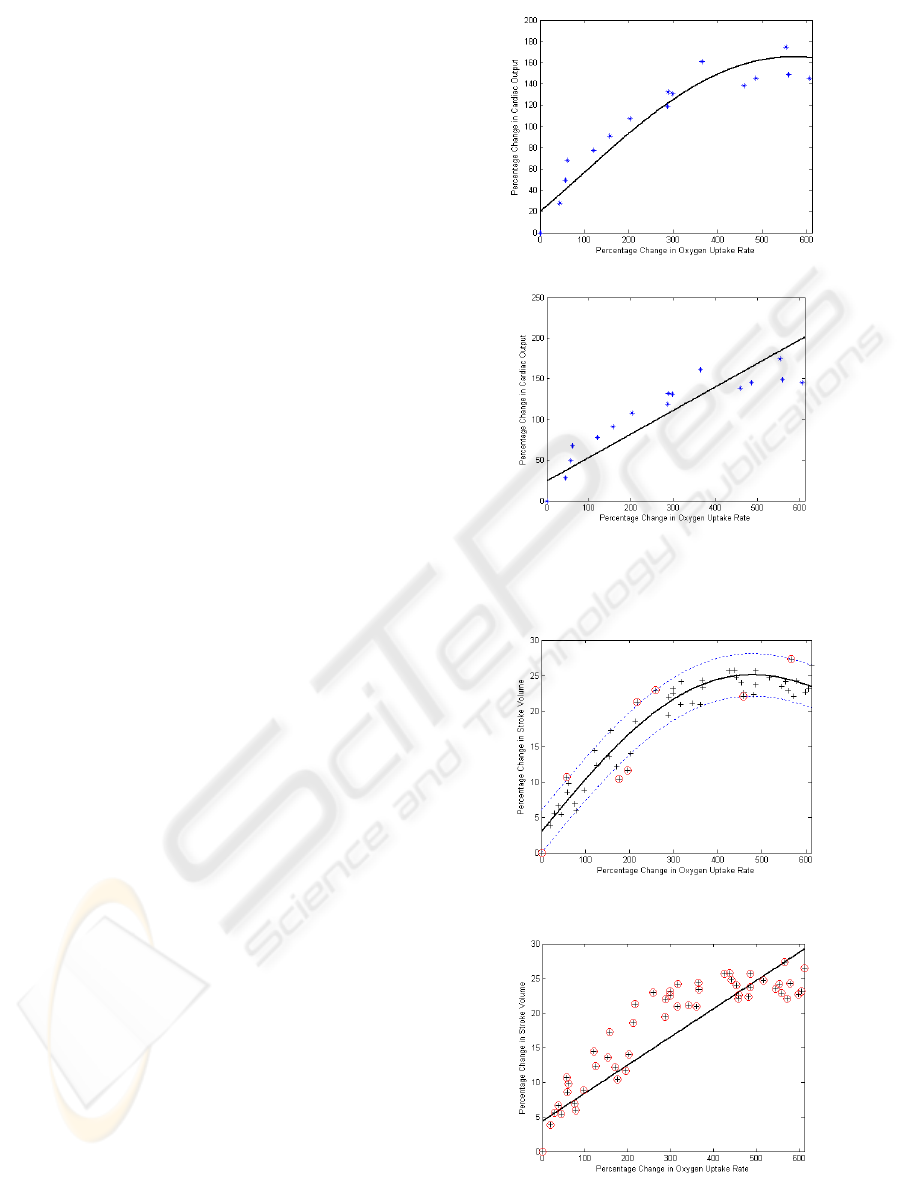
their relationship can be better described by the
nonlinear SVR model in terms of reducing the errors
(MSE) from 418 to 171 (Table 2), an improvement
of 59% comparing with that of LS method
The results in Table 1 also show the efficiency of
SVR. Unlike traditional regression method where
the solution of the model depends on the whole
training data points, in SVR, the solution to the
problem is only dependent on a subset of training
data points which are referred to as support vectors.
Using only support vectors, the same solution can be
obtained as using all the training data points. SVR
uses just 13% of the total points available to model
their nonlinear behavior efficiently.
3.1.2 Model Validation
To further evaluate the feasibility of this proposed
SVR model, the whole data set is divided into two
parts: the first part (70% of the data) is used to
design the model and the second part (30% of the
data) is used to test its performance. Because we do
not have large sample of data, we separated the data
set into two parts randomly five times. Each time we
use 70% of the data for training and the rest for
testing. We established the SVR model with the
three design parameters (kernel function, capacity
(
C ) and the radius of insensitivity (
ε
)) based on
the training set, and test its goodness on the testing
set. In Figure 3, we present the results for one of the
5 tests. As shown in Table 3, the averaged results
(MSE) for the 5 times testing for SVR is 245±15.
However, the averaged error for traditional linear
regression is as high as 521±19. It indicates that
SVR can build more robust models to predict CO%
from
2
OV
% using only a small training set. It also
demonstrates that SVR can overcome the over-
fitting problem, even though SVR has more model
parameters than the traditional linear regression
method.
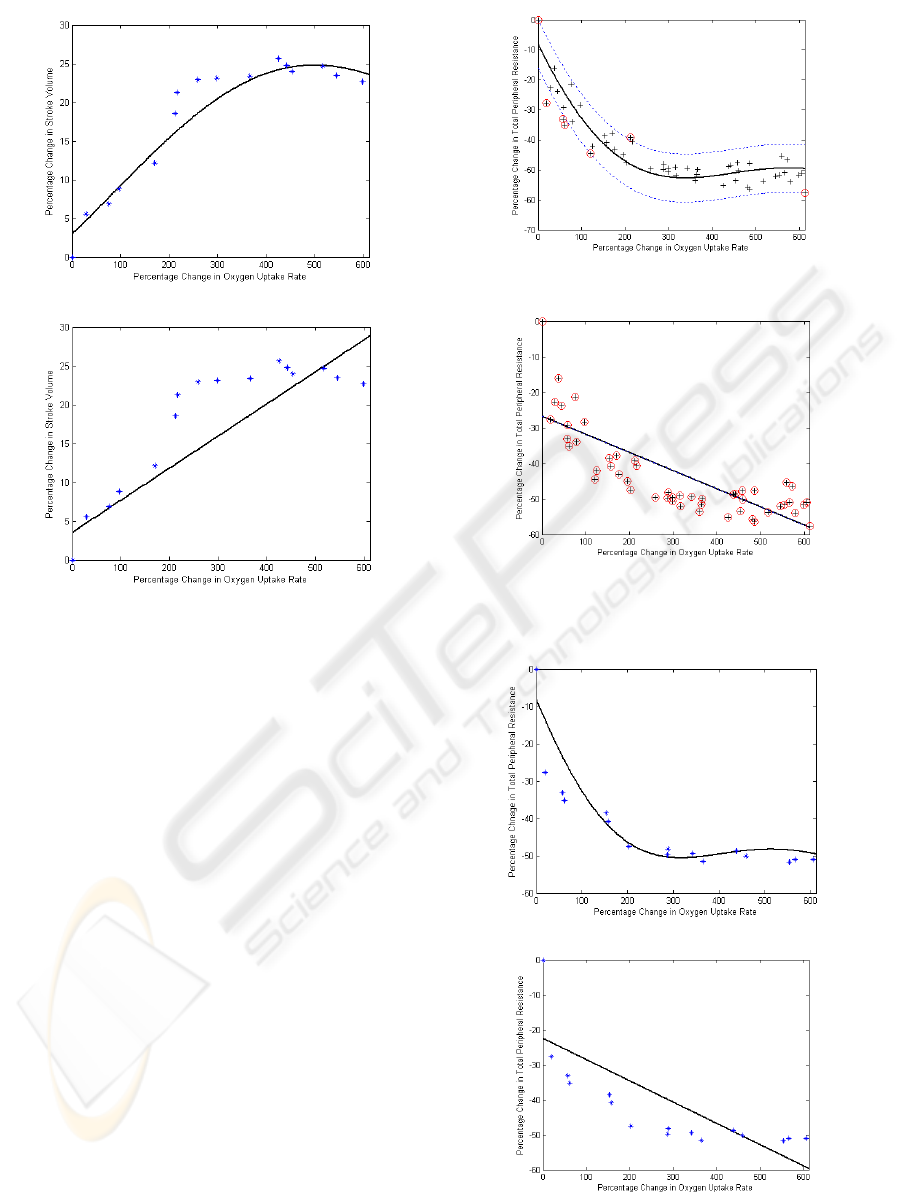
3.2 The Relationship between SV%
and
2
OV
%
Figure 4 shows the models for estimating SV%. The
SVR model gives more precisely estimation than the
LS does and decreases estimation errors (MSE) by
67% (Table 2).
The testing models are given in Figure 5 and the
testing errors are in Table 3. As indicated, the SVR
model decreases the testing error by 64%.
(a). Testing of SVR model.
(b). Testing of LS model
Figure 3: Comparison of models of CO% against %
change in oxygen uptake using SVR and using LS
methods.
(a). Estimation of percentage change in SV from
percentage change in
2
OV
using SVR.
(b). Estimation of percentage change in SV with percentage
change in
2
OV
using linear regression.
Figure 4: Comparison of estimation results for SV%
between using SVR and using LS.
NONLINEAR MODELING OF CARDIOVASCULAR RESPONSE TO EXERCISE
43
(a). Testing of SVR model.
(b). Testing of LS model.
Figure 5: Comparison of the testing results for Stroke
Volume using SVR and using traditional linear regression.
3.3 The Relationship between TPR%
and
2
OV
%
As shown in Figure 6, the SVR model describes a
rapid fall in TPR% at low workloads which remains
relatively constant even with increasing
2
OV
%. SVR
uses just 13% (Table 1) of the total points to get an
efficient nonlinear model. Compared with linear
regression, the SVR model decreases MSE from 151
to 30, an improvement of 80%.
The testing results for this SVR model and the
equivalent LS model are given in Figure 7 and Table
3, respectively. Both of these (Figure 7 and Table 3)
demonstrate that SVR outperforms the traditional
linear regression method by reducing testing errors
significantly, from 130 to 36.
(a). Estimation of percentage change in TPR from
percentage change in
2
OV
using SVR.
(b). Estimation of percentage change in TPR with
percentage change in
2
OV
using linear regression.
Figure 6: Comparison of the estimation results of TPR%
between using SVR and LS.
(a). Testing of SVR model.
(b). Testing of LS model.
Figure 7: Comparison of the test results of TPR% against
% change on Oxygen uptake using SVR and using LS.
BIOSIGNALS 2008 - International Conference on Bio-inspired Systems and Signal Processing
44

Table 1: Fitting data for the model of cardiovascular
variables and oxygen uptake rate using SVR.
Relation
CO% Vs
2
OV
%
SV% Vs
2
OV
%
TPR%
Vs
2
OV
%
Kernel RBF RBF RBF
Parameter σ = 200 σ = 500 σ = 500
Regularization
constant C
5000 5000 5000
ε-insensitivity 19 3 8
Support
vectors
number
8 (13.3%)
8
(13.3%)
8 (13.3%)
Estimation
error
171 5 30
Table 2: Comparison of the estimation errors (MSE)
between using SVR and using linear regression method
Relation
CO% Vs
2
OV
%
SV% Vs
2
OV
%
TPR% Vs
2
OV
%
SVR 171 5 30
LS 418 15 151
Table3: Comparison of the model fitting errors (MSE)
using SVR and linear regression methods (N=5).
Relation
CO% Vs
2
OV
%
SV% Vs
2
OV
%
TPR%
Vs
2
OV
%
SVR testing
error
245 ± 15 8 ± 2 36 ± 5
LS Testing
error
521 ± 19 22 ± 7 130 ± 12
4 CONCLUSIONS
This is the first time that SVR has been applied to
experimentally investigate the steady state
relationships between key central cardiovascular
variables and oxygen consumption during
incremental exercise. The impressive results
obtained prove that SVR is an effective approach
that can be recommended for the modeling of
physiological data.
ACKNOWLEDGEMENTS
The authors acknowledge project DP0452186/2003
funded by ARC (Australian Research Council).
REFERENCES
Allor KM, Pivarnik JM, Sam LJ et al (2000) Treadmill
economy in girls and women matched for height and
weight. J. Appl. Physiol 89: 512-516.
Astrand PO, Cuddy TE, Saltin, B et al (1964) Cardiac
output during submaximal and maximal work. J. Appl.
Physiol 9: 268-274.
Beck KC, Randolph LN, Bailey KR et al (2006)
Relationship between cardiac output and oxygen
consumption during upright cycle exercise in healthy
humans. J. Appl. Physiol 101: 1474 – 1480.
Drucker H, Burges C, Kaufman L et al (1997) Support
vector regression machines. In: Advances in Neural
Information Procession Systems, edited by M. Mozer,
M. Jordan & T. Petsche. Cambridge, MA. p. 155-161.
Fairbarn MS, Blackie SP, McElvaney NG et al (1994)
Prediction of heart rate and oxygen uptake during
incremental and maximal exercise in healthy adults.
Chest 105: 1365-1369.
Freedman ME, Snider GL, Brostoff P et al (1955) Effects
of training on response of cardiac output to muscular
exercise in athletes. J. Appl. Physiol 8:37-47.
Girosi F (1998) An equivalence between sparse
approximation and support vector machines. Neural
Computation, 20, 1455-1480.
Gunn SR (1997) Support Vector Macines for
classificationa and regression, Technical Report,
Department of Electronics and Computer Science,
University of Southampton.
Knobloch K, Lichtenberg A (2005) Winterhalter M,
Rossner D, Pichlmaier M,. and Philips R. Non-
invasive cardiac output determination by two-
dimensional independent Doppler during and after
cardiac surgery. Ann Thorac Surg 80: 1479-1483.
Kobayashi Y, Andoh Y, Fujinami T et al (1978)
Impedance cardiography for estimating cardiac output
during submaximal and maximal work. J. Appl.
Physiol 45: 459-462.
Reeves JT, Grover RF, Blount SG Jr et al (1961) Cardiac
output response to standing and treadmill walking. J.
Appl. Physiol 16: 283-288.
Reeves JT, Grover RF, Filley GF et al (1961) Circulatory
changes in man during mild supine exercise. J. Appl.
Phsiol 16: 279-282.
Richard R, Lonsdorfer-wolf E, Dufour S et al (2004)
Cardiac output and oxygen release during vintensity
exercise performed until exhaustion. Eur J Appl
Physiol 93: 9-18.
Rowell LB. Circulatory adjustments to dynamic exercise
(1986) In: Human circulation regulation during
physical stress. New York: Oxford University Press,
p. 213-256.
Rowland T, Popoeski , Ferrone L (1997) Cardiac response
to maximal upright cycle exercise in healthy boys and
men. Med Sci Sport Exer 29:1146-1151.
Su SW, Wang L, Celler BG (2006), Estimation of Oxygen
Consumption for Moderate Exercises by Using a
Hammerstein Model, In Proceeding of the 28th
Annual International Conference of the IEEE
NONLINEAR MODELING OF CARDIOVASCULAR RESPONSE TO EXERCISE
45

Engineering in Medicine and Biology Society, New
York, USA, September, pp. 3427-3430.
Su SW, Wang L, Celler BG, Savkin AV, and Guo Y
(2007). Identification and Control for Heart Rate
Regulation during Treadmill Exercise, IEEE
Transactions on Biomedical Engineering 54 (7): 1238-
1246.
Su SW, Wang L, Celler B et al (2005) Estimation of
walking energy expenditure by using support vector
regression. In Proceedings of the 27th Annual
International Conference of the IEEE Engineering in
Medicine and Biology Society (EMBS), pp. 3526–
3529, Shanghai, China.
Turley KR, Wilmore JH (1997) Cardiovascular responses
to treadmill and cycle ergometer exercise in children
and adults. J. Appl. Physiol 83: 948-957.
Valerity VG, Supriya BG (2003) Volatility forecasting
from multiscale and high-dimensional market data.
Neurocomputing, 55, 285-305.
Vapnik V (1998) Statistical learning theory. New York:
Wiley.
BIOSIGNALS 2008 - International Conference on Bio-inspired Systems and Signal Processing
46
