
A IMAGE PROCESSING METHOD FOR COMPARISON OF
MULTIPLE RADIOGRAPHS
Chen Sheng, Li Li and Wang Pei
College of Mathematics and Science, Shanghai Normal University, Guilin Road 100, Shanghai, China
Keywords: Image Processing, Look up table (LUT), Computer-aided diagnosis (CAD).
Abstract: Portable chest radiography is the most commonly ordered radiographic test in the intensive care unit (ICU).
In the ICU, a succession of portable images is usually taken over a period of time to monitor the progress of
a patient’s condition. A prompt diagnosis of any changes in the conditions of these ICU patients allows
clinicians to provide immediate attention and treatments that are required to prevent the conditions from
worsening and which could result in a treat to the patient’s life. However, because of differences in X-ray
exposure setting, patient and apparatus positioning, scattering, and grid application, for example, differences
in image quality from on image to the next taken at different times can be significant. The differences in
image quality make it difficult for clinicians to compare images to detect subtle changes. This paper
presents an image-rendering method that reduces the variability in image appearance and enhances the
diagnostic quality of these images. Use of the presented method allows clinicians to detect subtle
pathological changes from one image to the next, thus improving the quality of patient management in the
ICU.
1 INTRODUCTION
In the ICU, clinical evaluation can rely heavily on
diagnostic images such as portable chest
radiographic images. The successive diagnostic
images taken by a portable computed radiography
(CR) system are helpful for indicating significant
pathological changes of the patient, such as a
collapsed lung or and improper tube placement
within the patient.
However, image differences owing to different
exposure settings, or patient and apparatus
positioning, limit the accuracy of image comparison
in the ICU, even for those images obtained from the
same patient over a short treatment interval.
Obviously it constrains the ability of the clinician to
subtle changes that can be highly significant. An
important problem is allocating the output dynamic
ranges to display the clinically important part of the
input code values. The process of selecting the
relevant sub-range of input code values and
constructing the proper mapping function from the
input code values to the output display media is
termed a tone-scale adjustment. Using a tone-scale
method in CR images provides an optimal rendering
result (Lee and Barski, 1997). There are also other
methods (Barski and Metter, 1998) that provide
improvements in contract enhancement for
diagnostic imaging.
However, these methods do not address the
problem of consistent rendering between images of
the same patient taken at different times. Application
of such tone-scale techniques is not likely to provide
consistent rendering results, which makes accurate
changes assessment by the ICU clinician difficult.
In this paper, we present a region of interest
(ROI)-based lookup table (LUT) mapping method
for diagnostic images that provides a consistent
rendering result for images taken of the same patient
at different times. This will help the clinicians
compare images and track patient progress. First is a
background segmentation step when the background
of all the images (that may have different amounts of
background content or no background content) are
segmented. In the ROI selection step, the ROI region
is located. These are the images of the tissue parts
that are critical for clinicians to make a correct
diagnosis. Next, an LUT constructed for the pixel
values in the ROI. Then a toe-shoulder construction
step is taken, constructing a LUT for very dark and
very light regions. In the LUT mapping step, the
pixel values in the input images are mapped to the
corresponding pixel values in the output image.
228
Sheng C., Li L. and Pei W. (2008).
A IMAGE PROCESSING METHOD FOR COMPARISON OF MULTIPLE RADIOGRAPHS.
In Proceedings of the First International Conference on Bio-inspired Systems and Signal Processing, pages 228-231
DOI: 10.5220/0001060902280231
Copyright
c
SciTePress
The structure of this presentation is organized as
follows: in section2, we introduce why and how the
ROI is selected. In section3, the ROI-based LUT
construction method is presented. Section4 reports
the performance comparison result of the current
method and of baseline method. Finally, the
conclusion is drawn in Section 5.
2 AUTOMATED ROI SELECTION
After doing a background segmentation based on
ICU’s image histogram and difference histogram
(Kuhn, 1999), we get an appropriate threshold for
removing the background. A region-labeling
operation can be done to prevent over-segmentation.
Then we perform the automated ROI selection.
In ICU images, the position of the parts
necessary for the clinicians’ diagnosis varies. In
some cased, they will only take up a little part of the
image. The basic principle of automated ROI
selection is to identify the RIO in each image
automatically and adjust the image contrast values
within the ROI to a suitable range for each image, so
that comparison of one image to another is feasible.
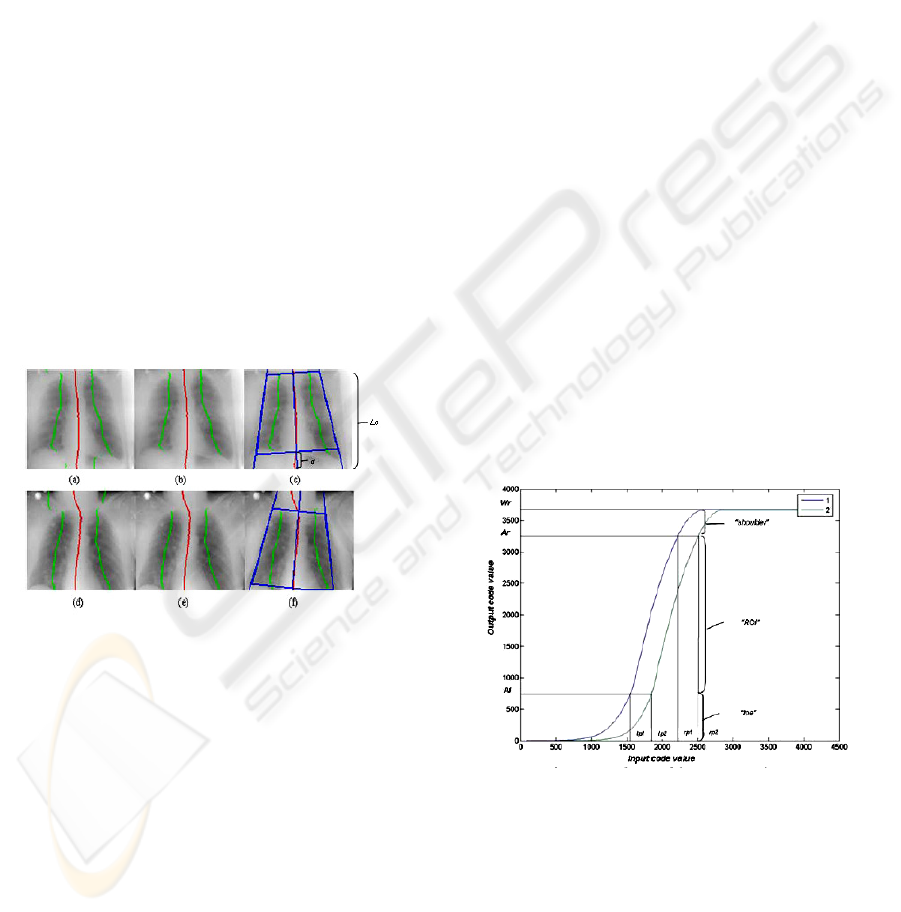
Figure 1: Automated region of interest selection; this is an
example of selecting similar regions of interest for two
images of the same patient.
ROI identification located key features (lung line,
spine line) in an image and allows the correlation of
two or more images accordingly. Figures1(c) and (f)
show two chest X-ray images of the same patient
with two automated regions of interest (ROI)
selected.
First we use a median filter to resize the image,
then a Gaussian filter for noise removal. Next, the
locations of the spine line and lung line are detected
(Amit and Mark, 2005). Fig.1 (a) and (d) show the
spine and lung line detection. We search for the
highest/lowest mean column value row by row.
Connecting these points, we validate the lung line
step (Fig.1 (b) and (e)), and combine and validate
similar lung line parts based on gray-level and
position.
With the approximate lung line and spine line
determined, a spine-line-fitting step can be executed.
This is performed by doing an iterative of the spine-
line-fitting step. We search all the rows between the
top and bottom of the lung lines. We then choose the
fitting result that has the lower mean residual form
these two. We then can get a trapezoid ROI for all
the images of the same patient based on the spine
line and the distance of the spine line to the lung
line.
3 ROI-BASED LUT
CONSTRUCTION
Once one or more ROIs have been identified, we can
do the ROI-based LUT construction step.
First we identify the primary area o the image
from the histogram data that is related only to the
ROI. Points lp and rp represent left and right points,
respectively, of the histogram data that is from the
main range (2.5%-95%) in the ROI. After that, for
each image, left points lp1 and lp2, and right points
rp1 and rp2, are obtained. The goal of next few steps
is to remap left points lp1 and lp2, and right points
rp1 and rp2, to the corresponding points A1 and A2,
in order to form consistent images in the output
images.
Figure 2: Lookup table construction.
Figure 2 shows how various portions of the image
are remapped for consistent rendering. We can map
the right point rp, obtained from the ROI of each
input image, to the same value Ar in the output
image that has been determined for the same patient.
However, to accommodate the difference in patient
position between two images of same patient, we
proposed to use Ar for each image. Here, the
A IMAGE PROCESSING METHOD FOR COMPARISON OF MULTIPLE RADIOGRAPHS
229
diaphragm in Fig.1 (a) is higher that that in Fig.1 (d).
This difference can be best expressed by means of a
proportion of distance d to column length Lc for
each image as illustrated in Fig.1.
Given these considerations, Ar can be calculated
using the following calculations to adjust the
difference in patient position:
() ()
101
;;
21
212211
≤≤−⋅+⋅=
+
⎟
⎟
⎠
⎞
⎜
⎜
⎝
⎛
⋅=+
⎟
⎟
⎠
⎞
⎜
⎜
⎝
⎛
⋅=
ttArtArAr
p
L
d
pArp
L
d
pAr
cc
(1)
Where
d
and column length
c
L
are illustrated in
Figure 1.
21
, pp
and
t
are empirical parameters.
In out method, features used to determine the
value
Al
include the difference
lprp −
, and the
value of
()
rencespinediffelprp /−
:
()()()
()()
AlAlAlAl
aapdarkaaAlAl
spuvspdv
lprp
pdark
cbxaxAllprpx
,maxmin,minmax
,min,max
;
4021
'
2'
=
−⋅+=
−
−
=
++=−=
(2)
AlAlaaaacba max,min,,,,,,,
4021
are empirical
parameters and
spuvspdv, (spine down-part value
and spine up-part value) are the main gray-level
range in the spinal region (10%-80%), which can be
detected automatically. Note that the A1 can be
justified differently by the ratio of
pdark
for each
image. Here we choose the same
Al for all the
images from the same patient.
After we get
ArAlrplp ,,,
for each image, the
LUT construction between
lp and rp to Al and
Ar
can be applied. The mapping from
[
]
rplp,
to
[]
ArAl,
is established based on the active rate (Lee,
2004) calculated in equation (3).
()
() ()
()
3
3
,,, 33
1
1
,,,
[]
[][]
ln 1 1
[]
[]
[][]
ln 1 1
[]
j
i
ij ROIimgij kui v j
t
it
rp
ilp
t
rp
it
rp
ilp
ilp
Huvij
Activity k
hk
Activity i t h i t
hi
ActNor i
Act i t h i t
hi
+
+
∈==−=−
=−
−
=
=−
−
=
=
=
⎛⎞
+⋅ +
⎜⎟
⎜⎟
++
⎜⎟
⎜⎟
⎜⎟
⎝⎠
=
⎛⎞
⎛⎞
+⋅ +
⎜⎟
⎜⎟
⎜⎟
⎜⎟
++
⎜⎟
⎜⎟
⎜⎟
⎜⎟
⎜⎟
⎜⎟
⎝⎠
⎝⎠
∑∑∑
∑
∑
∑
∑
() ( ) ()
1
1, ,,,,,1whenh imgij imguv hrHuvij
−
≤− ≤ =
∑
(3)
][kactivity
is the activity of intensity k and h(i) is the
number of the pixel at that intensity.
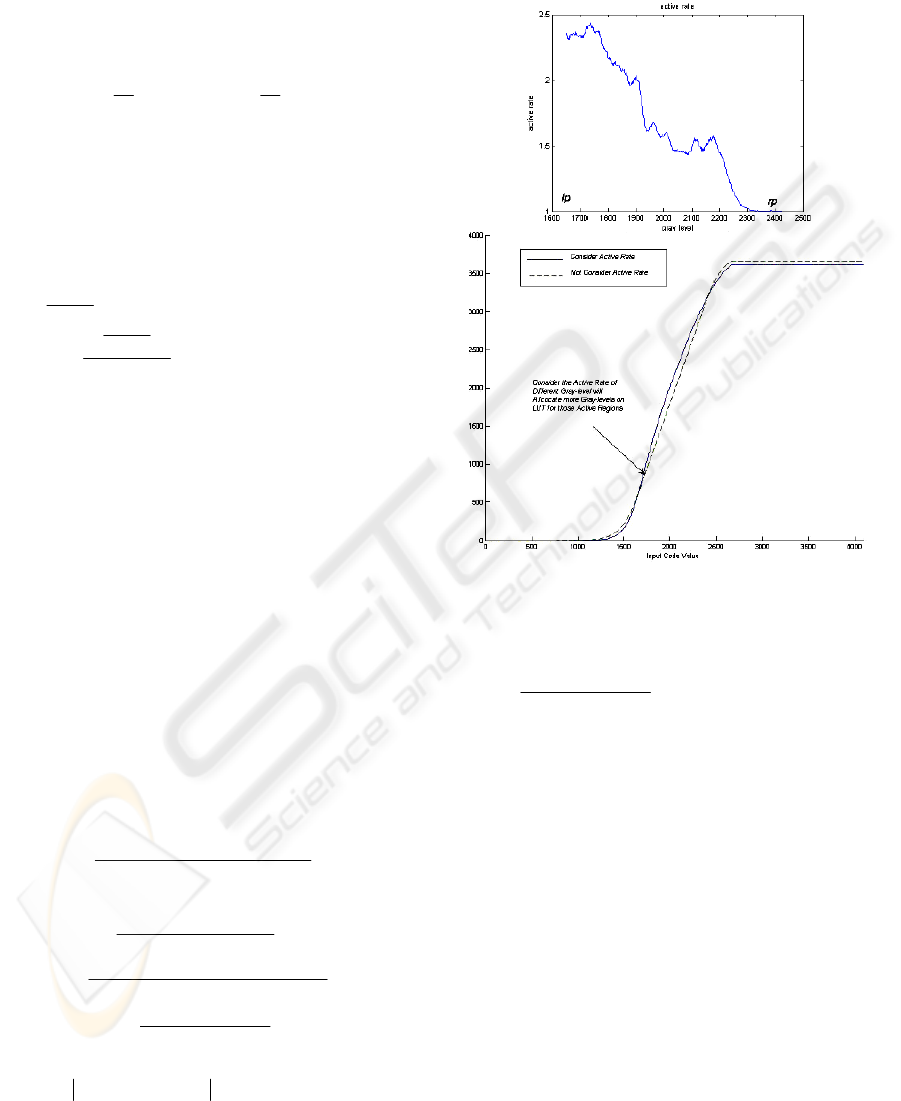
Figure 3 shows an ICU image’s active rate and
example of LUT construction using equation(4)
considering the active rate.
Figure 3: Active-rate in LUT construction.
(
)
( ) () ()( )
()()
0,10,
1
1
=≤≤
−
−−
+
−+=+
=
⎟
⎠
⎞
⎜
⎝
⎛
whenratioratioHere
lprp
ratioAlAr
ratioAlAriActNoriLUTiLUT
AllpLUT
(4)
In addition to mapping the ROI of the image, for
darker or brighter regions, a toe-shoulder LUT
construction step was performed for additional
mapping, such as the toe region and the shoulder
region in the LUT curve in Fig.3. The toe region was
constructed for mapping the dark area in the image
and the shoulder region was constructed for the
bright area in the image.
4 PERFORMANCE
We collected 83 portable X-ray images from 19
patients. There were two to nine images of each
patient. An experienced chest radiologist reviewed
all the images from the 19 patients and provided a
diagnosis that included the types of diseases detected
BIOSIGNALS 2008 - International Conference on Bio-inspired Systems and Signal Processing
230
and any change in a patient’s condition
(improved/worsened). We compare the presented
method with a baseline image enhancement
technique that is an image optimization technique
based on single image (Barski and Metter, 1998). An
evaluation of the images from the 19 patients was
performed in order to compare the overall
consistency in the image and the lung areas as well
as the ability to detect changes in patients’
conditions against the radiologist’s diagnosis.
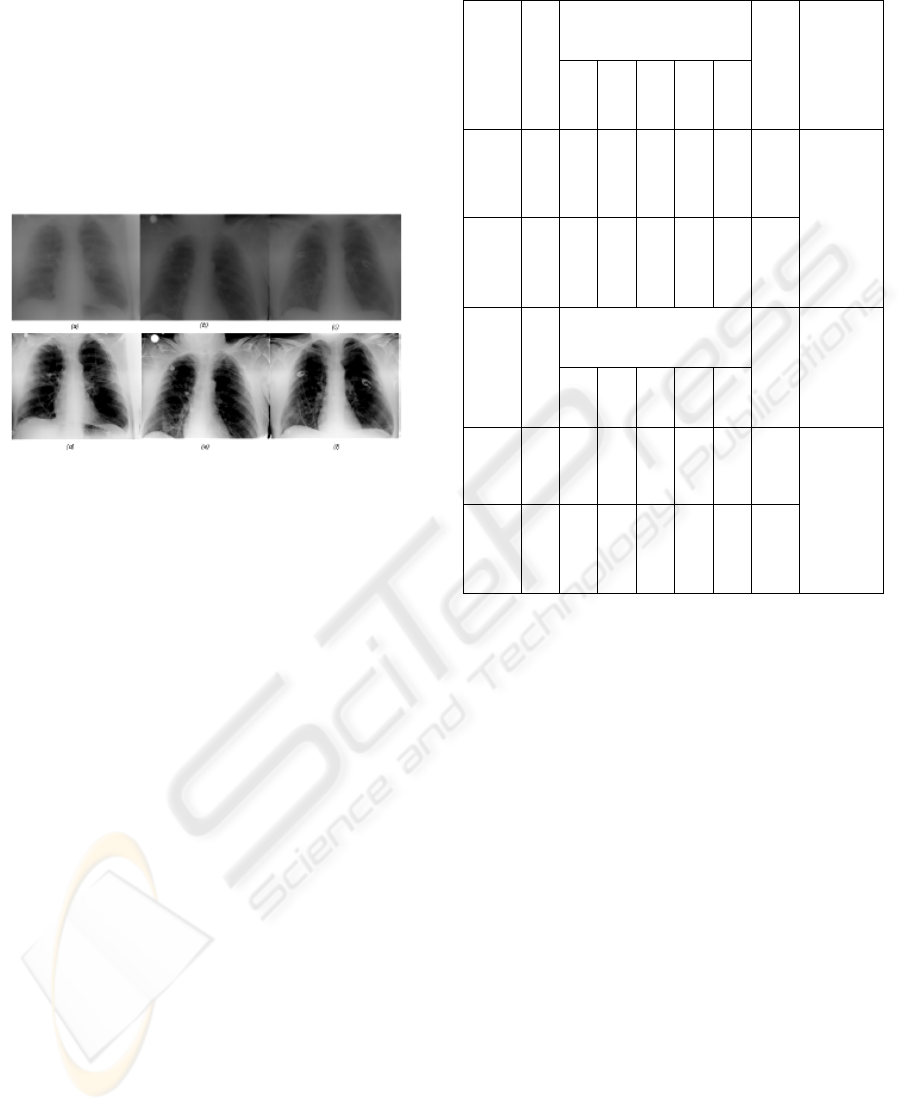
Figure 4: Processed image of the same patient. (a), (b),
and (c) are raw images of the same patient, and (d), (e) and
(f) are the processed result using the current method.
Figure 4 shows the processing result examples of a
patient’s ICU chest X-ray images. In the evaluation,
all of the processed images form each patient were
presented to a radiologist in the order of the
processed images form the baseline method first and
next the processed images from the presented
method. The radiologist gave a rating on a 5-point
acceptability scale where 1 is not acceptable and 5 is
outstanding in terms of the consistency rendering
effect demonstrated among the images presented for
diagnostic purposes. Table 1 is the evaluation result.
A t-test is also done to compare the baseline and
current methods.
5 ROI-BASED LUT
CONSTRUCTION
Our image-rendering technique reduces the
variability in the image appearance caused by the
differences in patient or apparatus positioning and
image acquisition parameters. The improved
consistency over the baseline image enhancement
technique can potentially improve the overall
workflow and patient management.
Thus, it is a method for enhancing diagnostic
images taken at different time in order to provide
consistent rendering for regions of interest.
Table 1: The evaluation result.
Score
Patient Number
5 4 3 2 1
Average
T-test
Current
Method
19 9 8 1 1 0 4.3
2
Baseline
Method
19 2 9 5 3 0 3.5
2
Accept
P-Value
=0.039
Score
Image Number
5 4 3 2 1
Average
T-test
Current
Method
83 42 30 9 2 0 4.3
5
Baseline
Method
83 27 34 17 4 1 3.9
9
Accept
P-Value
=0.0034
ACKNOWLEDGEMENTS
This paper is supported by Innovation Program of
Shanghai Municipal Education Comission.
REFERENCES
Amit. Singhal, Mark Bolin, Hui Luo, 2005. “Inducing
node specification in active shape models for accurate
lung-field segmentation.” Proc. SPIE, Vol. 5747, pp.
431-442.
G. Kuhn, 1999. “Method and apparatus for automatically
location region of interest in a radiograph.” U.S.
Patent. 5896463.
H. C. Lee, L. Barski, R. Senn, 1997. “Automatic tone
scale adjustment using image activity measure.” U. S.
Patent. 5633511.
H. C. Lee, 2004. Tone scale processing based on image
modulation activity. U. S. Patent 6717698.
L. Barshi. R, Van. Metter, 1998. “New automatic tone
scale method for computed radiography.” Proc. SPIE
Vol. 3335, pp. 164-178.
R. Van. Metter, D. Foos, 1999. “Enhanced latitude for
digital projection radiography.” Pro. SPIE, Vol. 3658,
pp. 468-483.
A IMAGE PROCESSING METHOD FOR COMPARISON OF MULTIPLE RADIOGRAPHS
231
