
AUTOMATED DETECTION OF SUPPORTING DEVICE
POSITIONING IN RADIOGRAPHY
Chen Sheng, Li Li and Ying Jun
College of Mathematics and Science, Shanghai Normal University, Guilin Road 100, Shanghai, China
Keywords: Gaussian Filter, Contrast-Limited Adaptive Histogram Equalization (CLAHE), Hough Transform, Tube.
Abstract: Portable X-ray radiographs are heavily used in the ICU for detecting significant or unexpected conditions
requiring immediate changes in patient management. One concern for effective patient management relates
to the ability to detect the proper positioning of tubes that have been inserted into the patient. These include,
for example, endo-tracheal tubes (ET), feeding tubes (FT), naso-gastric tubes (NT), and other tubes. Proper
tube positioning can help to ensure delivery or disposal of liquids and air/gases to and from the patient
during a treatment procedure. Improper tube positioning can cause patient discomfort, render a treatment
ineffective, or can even be life-threatening. However, because the poor image quality in portable AP X-ray
images due to the variability in patients, apparatus positioning, and X-ray exposure, it is often difficult for
clinicians to visually detect the position of tube tips. Thus, there is a need for detecting and identifying tube
position and type to assist clinicians. The purpose of this paper is to present a computer-aided method for
automated detection of tubes and identification of tube types. Use of this method may allow clinicians to
detect the tube tips more easily and accurately, thus improving the quality of patient management in the
ICU.
1 INTRODUCTION
Computer-aided diagnosis is designed to help
physicians improve the diagnostic accuracy of
radiological images and for detection of the disease,
and to explain the consistency, reduce the rate of
misdiagnosis, and cause less opportunity for eye
fatigue
. The chest CAD system (Brem and Baum,
2003) and the Mammography CAD system (Bram
and Bart, 2001) are both used in clinics. Clinical
results show two aspects: Medical diagnostic
radiology consults the CAD output and it is thus
easier to find more features, such as micro-
calcifications and the changes that have taken place
in the tiny structures, greatly improving the
efficiency and accuracy of diagnosis. We research
the method of tube automatic detection for
improving the quality of patient management in the
Intensive Care Unit (ICU) (Doi and MacMahon,
1999).
ICU patients, particularly those with heart and
lung diseases, rely on the existence of tubes to live
and be treated. In the intensive care setting, catheters,
tubes, and monitoring devices play an important role.
Proper placement of these devices is crucial to their
function Personnel are well aware of the need for
timely medical ICU care for patients, correct
placement of tubes, and the changes that need to be
made around these tubes’ positions. If the computer
can automatically identify the location of tubes and
their tips, and enhance medical images around tubes
to provide diagnosis, it is a clear and very important
improvement to their procedures.
ICU patients’ chest X-ray images can be fuzzy,
exhibit low contrast and noise, and contain many
different types of tube connections on the image,
such as the endo-tracheal tube, feeding tube, naso-
gastric tube, pulmonary artery, central venous
catheter, and other catheters required for the
treatment of a variety of medical conditions. These
bring a significant challenge to accurately detect
tubes and their tips. Figure 1 shows a general
original ICU chest image.
2 METHODS AND MATERIALS
We collected a database consisting of 107 portable
X-ray images from 20 patients using Kodak’s
computed radiography (CR) system. An experienced
420
Sheng C., Li L. and Jun Y. (2008).
AUTOMATED DETECTION OF SUPPORTING DEVICE POSITIONING IN RADIOGRAPHY.
In Proceedings of the First International Conference on Bio-inspired Systems and Signal Processing, pages 420-424
DOI: 10.5220/0001061004200424
Copyright
c
SciTePress
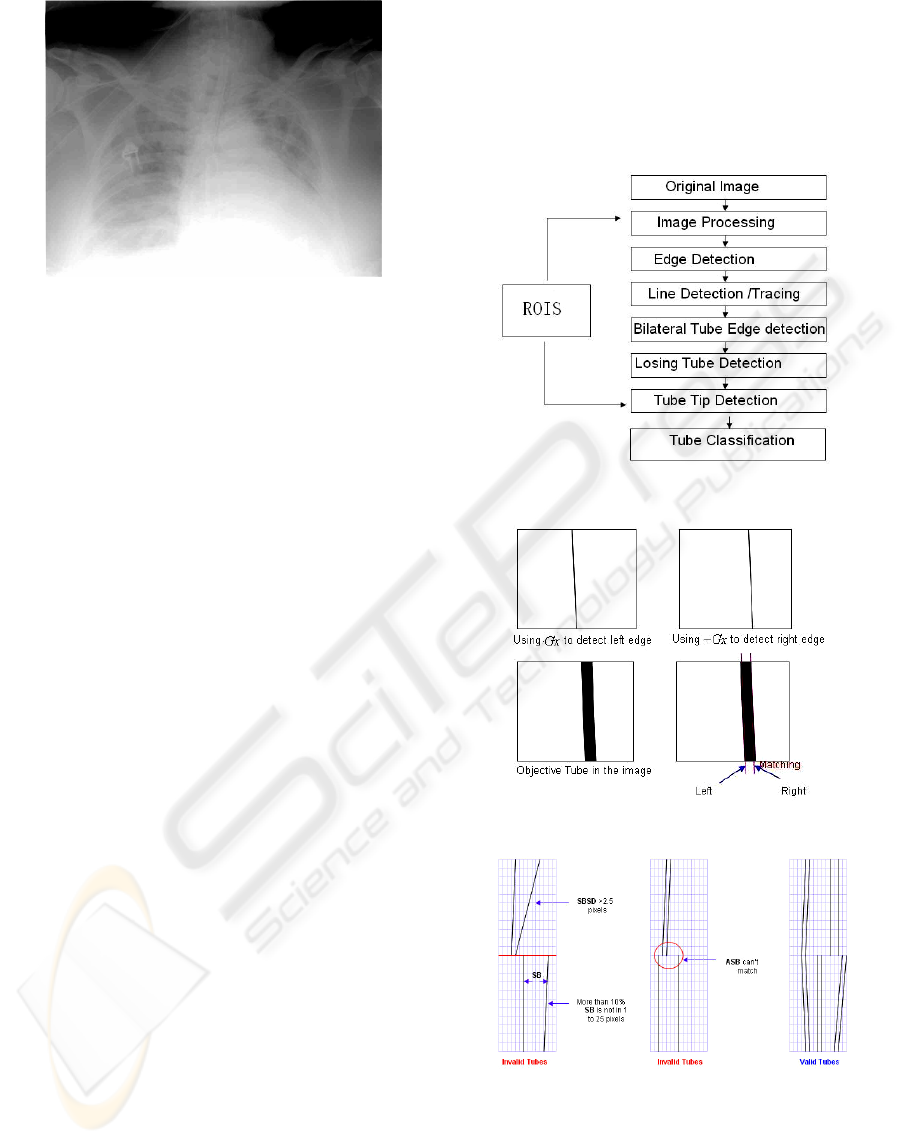
Figure 1: Original ICU chest X-ray image.
chest radiologist reviewed all the images from the 20
patients and provided a diagnosis for each image
including the types of tubes and locations of their
tips. The technique we developed here was
evaluated for the detection of the three commonly
used tubes in the ICU, the endo-tracheal tube, the
feeding tube, and the naso-gastric tube. In this
database, 33 images were identified to have endo-
tracheal tubes, 54 with feeding tubes, and 22 with
naso-gastric tubes. This technique will be used and
evaluated for the detection of other tubes/lines in the
future.
Figure 2 lists the steps used in the automated
detection method. In the image-processing step, the
contrast-limited adaptive histogram equalization
(CLAHE) (Pizer and Amburn, 1987) (Zuiderveld) is
used to enhance the contrast, and the anisotropic
filtering is used to remove the noise prior to the
generation of a gradient image. CLAHE can enhance
the contrast details of the regions and avoid noise
amplification as a result of histogram equalization in
a similar region. As with the general histogram
equalization, which can change the grey scale of the
image to enhance the contrast, its distinction is that
the operation region is a small region from which the
whole image is divided, and then merged together
again as the whole image and using bilinear
interpolation between two neighbourhood
intercropping to eliminate false results of the border
reduced by histogram equalization. The combination
of a canny filter (Parker, 1997 and Canny, 1986) and
Hough transform (Kamat and Ganesan, 1998) is then
applied to detect edges and lines on the tiles of an
enhanced gradient image. A whole gradient image is
divided into many tiles for performing Hough
transform. The tube in a small tile can be considered
a straight tube. The double-line/edge criteria are
applied to identify potential tube candidates by
paring a detected “left” edge with a “right” edge
(See Fig.3). Theoretically, the paired left and right
edges should have a fixed distance between them
and each should have a gradient with an opposite
direction (i.e., G, -G). Therefore, tubes’ edges
should be basically parallel so it can be determined
which tube is the valid one (See Fig. 4). Further, we
apply bilateral Hough transform to detect the
missing lines between potential tube candidates.
Figure 2: Tubes’ automatic detection flowchart.
Figure 3: Tube matching.
Figure 4: Determine the valid tube.
Note: SB is the abbreviation of Space Between.
SBSD is the abbreviation of Space Between
Standard Deviation. ABS is the average of SB.
AUTOMATED DETECTION OF SUPPORTING DEVICE POSITIONING IN RADIOGRAPHY
421
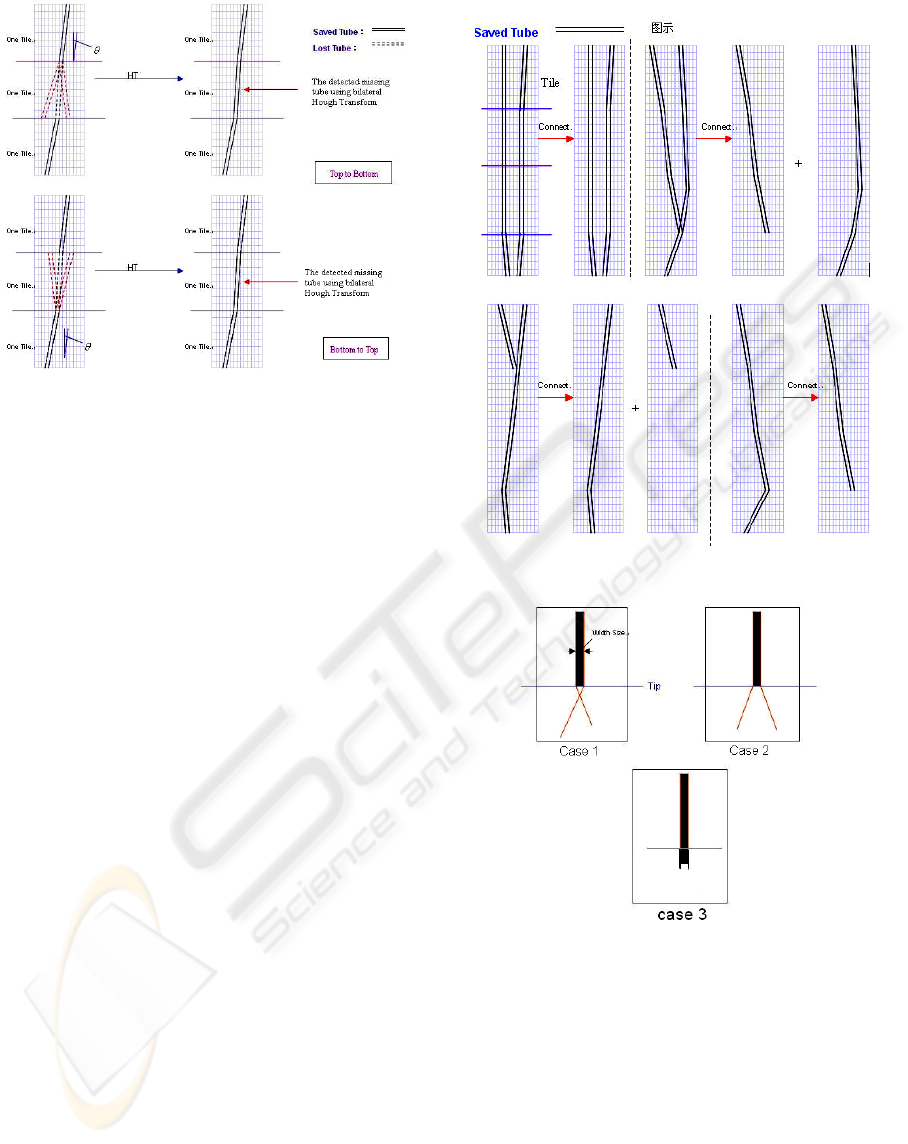
Figure 5: Bilateral Hough transform.
Figure 5 shows the detected missing/lost lines
between the two potential tubes identified in the
previous step. Bilateral HT: Using the tube’s grey
gradient (left is Gx and right is –Gx) to do bilateral
Hough Transform. The paired left and right edges
should have a fixed distance between the two edges
and each should have a gradient with an opposite
direction. The detected tube’s size is assumed as the
distance. Basing the detected tube’s position, we do
the bilateral Hough Transform to gradient image
from top to bottom, then from bottom to top. After
doing the bilateral Hough transform, we can locate
the missing tubes.
In a small tile each to be linked with at least the
boundary line is another small tile. In other words,
the starting point of the boundary line and the end
point of another boundary line must be in one pair of
neighbouring tiles. The connective tubes’ directive
angle difference should be in pi/24. The tubes on the
images are consistent. When detecting ET, only the
isolated tube in the region of interest (ROI) upper
part is valid. If a tube can connect with more than
two tubes, we will choose the tube that bears a closer
directive angle. See Fig. 6.
Tip detection is an important element of our
work. Combining the region’s information and
anatomic structure, we use our algorithm (See Fig.
7). The tubes’ edges should be crossing or the tube
size should be less than the defined size (i.e., ET,
NT: 3-10 pixels, FT: 15-25 pixels). (See Fig. 7:
Case 1-2). We use the proper bilateral Hough
Transform to stretch or shrink the tube for getting an
accurate tip (See Fig. 7: Case 3).
Figure 6: Tubes’ connection.
Figure 7: Tip detection.
After determining the tip, a classification step is
executed to provide a decision on apparent tube type
for the matched pairs of left and right edges.
Information such as the length of the line, the
location of the tube, and/or the tip relative to
anatomic structures is used for classifying the tube
types. The ROIs containing relevant anatomic
structures, such as lung, mediastinum, and stomach,
are identified and used to determine the relative
position of tubes in the image. These ROIs serve as
landmarks for tube detection and classification.
BIOSIGNALS 2008 - International Conference on Bio-inspired Systems and Signal Processing
422
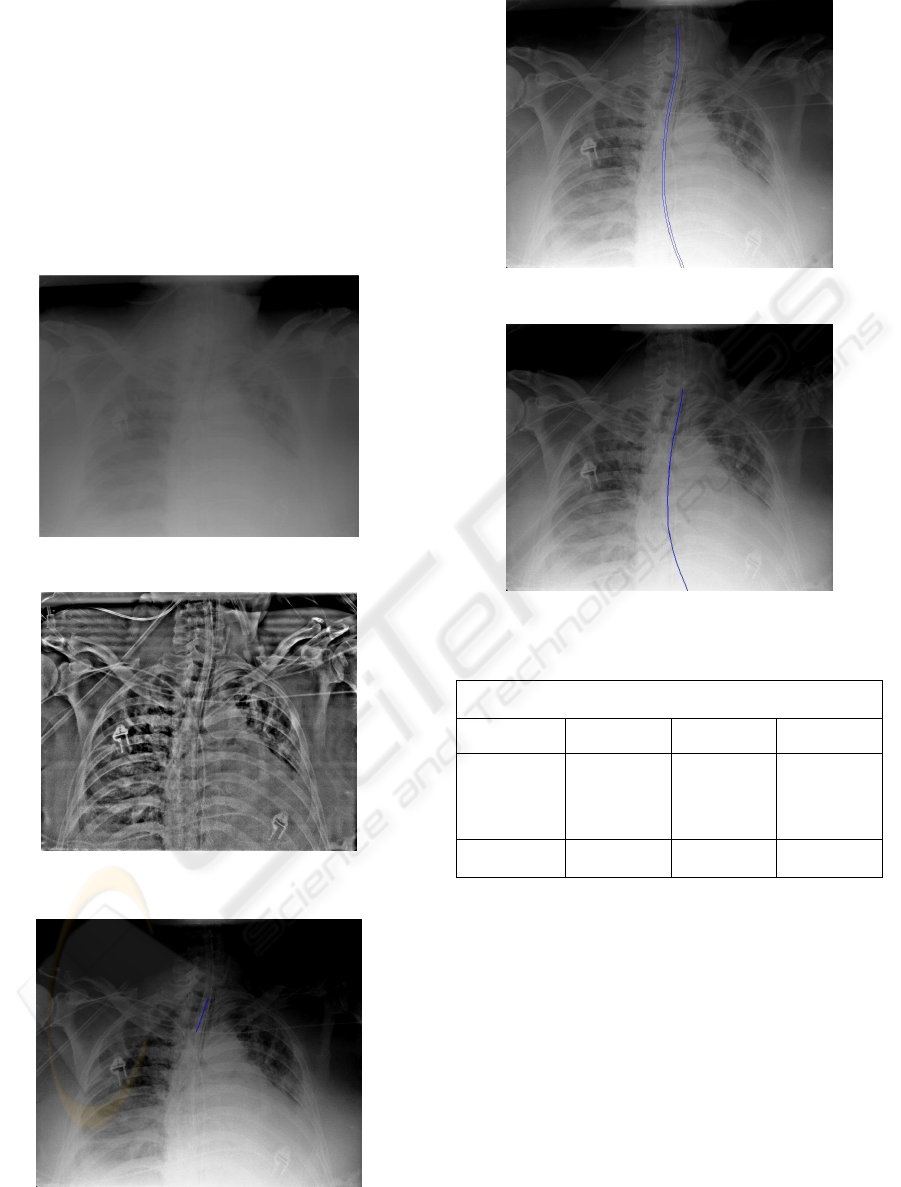
3 RESULTS
The detection result can be illuminated. See Fig.8-
12. We evaluated the performance of the technique
for ET, FT, and NT. Our preliminary results showed
that use of the presented technique correctly detected
the location for 94% of the 33 ET tubes, 82% of the
54 FT tubes, and 82% of the 22 NT tubes with no
false positive detection (See Table 1). The
performance is expected to improve when detection
results from the same patient are used.
Figure 8: The original X-ray chest image.
Figure 9: Image pre-processing (CLAHE)
Figure 10: ET detection
Figure 11: FT detection.
Figure 12: NT detection
Table 1: The result table.
107 images of 20 ICU patients, and the images were captured
by portable CR system of Kodak
ET FT NT
Tube amount 33 54 22
Detection
rate
94% 82% 82%
4 CONCLUSIONS
Our novel detection technique can accurately detect
the tubes in ICU images at a high sensitivity level. A
function of automated detection of tube placement
can potentially improve the overall workflow and
patient management in the ICU.
ACKNOWLEDGEMENTS
This paper is supported by Innovation Program of
Shanghai Municipal Education Comission.
AUTOMATED DETECTION OF SUPPORTING DEVICE POSITIONING IN RADIOGRAPHY
423

REFERENCES
J. Canny, 1986. “A computational approach to edge
detection.” IEEE Trans Pattern Analysis and Machine
Intelligence. Vol. 8, No. 6, pp. 679-689.
J. R. Parker, 1997. “Algorithm for image processing and
computer vision.” New York, John Wiley & Sons,
Inc., pp. 23-29.
K. Doi, H. MacMahon, S. Katsuragawa, 1999. “Computer-
aided diagnosis in radiology: potential and pitfalls.”
Euro. J. Radiology, pp. 97-109.
K. Zuiderveld. “Contrast limited adaptive histogram
equalization.” Graphics Gems IV, pp. 474-485.
R. F. Brem, J. Baum, M. Lechner, 2003. “Improvement in
sensitivity of screening mammography with computer-
aided detection: a multi-institutional trial.” Am. J.
Roentgenol, pp. 687-693.
S. M. Pizer, E. P. Amburn, J. D. Austin, R. Cromartie,
1987. “Adaptive histogram equalization and its
variations.” Computer Vision, Graphics, and Image
Processing (CVGIP), pp. 355-368.
V. G. Bram, M. H. Bart, 2001. Computer-aided diagnosis
in chest radiography: a survey.” IEEE Trans. Med.
Imag, Vol. 20, pp. 1228-1241.
V. Kamat, S. Ganesan, 1998. “A robust Hough Transform
technique for description of multiple line segments in
an image.” Proceedings of the 1998 IEEE
International Conference on Image Processing (ICIP-
98), Vol. 1, pp. 216-220.
BIOSIGNALS 2008 - International Conference on Bio-inspired Systems and Signal Processing
424
