
ANT COLONY INSPIRED METAHEURISTICS IN BIOLOGICAL
SIGNAL PROCESSING
Hybrid Ant Colony and Evolutionary Approach
Miroslav Bursa, Michal Huptych and Lenka Lhotska
Dept. of Cybernetics, Czech Technical University in Prague, Technicka 2, Prague 6, Czech Republic
Keywords:
Electrocardiogram Signal Processing, Evolutionary Algorithm, Ant Colony Optimization, Electroencephalo-
gram Processing, Biological Signal Processing.
Abstract:
Nature inspired metaheuristics have interesting stochastic properties which make them suitable for use in
data mining, data clustering and other application areas, because they often produce more robust solutions.
This paper presents an application of clustering method inspired by the behavior of real ants in the nature to
biomedical signal processing. The main aim of our study was to design and develop a combination of feature
extraction and classification methods for automatic recognition of significant structure in biological signal
recordings. The method targets the speed-up and the increase in objectivity of identification of important
classes and may be used for online classification, so it can be used as a hint in the expert classification process.
We have obtained significant results in electrocardiogram and electroencephalogram recordings, which justify
the use of such kind of methods.
1 INTRODUCTION
This study aims at design and development of fea-
ture extraction and classification methods for auto-
matic recognition of important patterns in biological
signal recordings. The doctors often work under pres-
sure (time and fatigue) and the error ratio of the expert
increases when working under high load (both psy-
chical and physical fatigue). Automated methods are
designed to speed up and objectify the identification
of relevant classes and may be used for online classi-
fication. However, they should be provided as a hint
to the doctor only, as they do not consider many other
aspects (medication, diagnosis, treatment, patient his-
tory, etc.).
With the oncoming boost in personal medical
electronics and portable monitoring technology, there
is still growing amount of data which must be pro-
cessed and evaluated by the physicians.
Nowadays, many data-mining algorithms with
still growing number of modifications exist, see for
example (Abraham et al., 2006) or (Panos M. Parda-
los, 2007). Such modifications aim at speeding up
the data mining process, increase its robustness and
stability. But even with rapidly increasing compu-
tational power of modern computers, the analysis of
huge databases is very expensive (in terms of com-
puter time and/or memory and therefore also finan-
cially). This is why scientists instantly search and
develop novel and robust techniques to analyze and
process large amount of data.
Biological signal processing workflow consists of
the following main processes: signal pre-processing,
signal transfer and/or storage, digital signal process-
ing and feature extraction, clustering of the similar
data (mainly in long-term recordings), signal inter-
pretation (classification) and expert validation. In the
majority of the processes mentioned, the ant-colony
inspired methods can be used with more or less suc-
cess (Bursa et al., 2006). Usually some kind of
suitable feature processing and filtering is also per-
formed.
1.1 Clustering
In many industrial, business and scientific areas we
can see still growing use of computers and com-
putational appliances, and a huge amount of vari-
90
Bursa M., Huptych M. and Lhotska L. (2008).
ANT COLONY INSPIRED METAHEURISTICS IN BIOLOGICAL SIGNAL PROCESSING - Hybrid Ant Colony and Evolutionary Approach.
In Proceedings of the First International Conference on Bio-inspired Systems and Signal Processing, pages 90-95
DOI: 10.5220/0001061700900095
Copyright
c
SciTePress
ous data must be stored, processed and evaluated.
Such data are often mixed from different sources,
containing many different data types, unusual cod-
ing schemes, and seldom come without any errors (or
noise). Datamining is not only an important scientific
area, but also an important tool in industry and busi-
ness and still gaining its importance in healthcare and
biomedical applications.
This is where data clustering can significantly
help. By clustering we mean constructing partitioning
scheme on the data set while minimizing the distance
inside each cluster (intra-cluster distance) and max-
imizing distance between clusters (inter-cluster dis-
tance). Note that a similarity (or distance) measure
must be specified in order to the clustering being ap-
plicable.
Data clustering, referred as cluster analysis
(Rousseeuw and Kaufman, 1990), numerical taxon-
omy, typological analysis, etc., is a common unsu-
pervised learning technique aimed at accumulation
of similar patterns into groups (clusters): partition-
ing of a data set into subsets (clusters), so that the
data in each subset (ideally) share some common as-
pect. Review of main clustering methods (partitioning
methods, hierarchical methods, density-based meth-
ods and grid-based methods) can be found in (Jain
et al., 1999).
If the final (correct) classification is not known,
different techniques for measuring cluster validity
exists: Dunn index (Dunn, 1974), Davis-Bouldin
index (Davies and Bouldin, 1979), Silouhette in-
dex (Rousseeuw, 1987), etc.
1.2 Electrocardiogram
The electrocardiogram (ECG) analysis is still one
of the most important non-invasive diagnostic tech-
niques used in patient diagnostics process.
Figure 1: Electrical recording of a heart action (an elec-
trocardiogram, ECG). The most important features are
marked. The graph shows amplitude dependency on time
(record samples).
With Holter ECG recordings (long-term ECG
recordings, lasting usually 24 and more hours), wear-
able medical electronics and patient auto-diagnostic
(and monitoring) appliances, also a huge amount of
data has to be transferred and furthermore processed.
In clinical praxis it is hardly acceptable for the
physician to accept longer than five minutes for
the patient long-term recording (Holter) to be pro-
cessed (Chudacek and Lhotska, 2006). Thus efficient
and robust algorithms must be used, opening wide
area of application for nature inspired methods and
artificial intelligence methods which can be used in
exploratory analysis.
1.3 Electroencephalogram
Electroencephalogram (EEG) is one of the most im-
portant methods for studying maturation degree of hu-
man brain. A newborn infant typically sleeps approx-
imately 70 % of an 24 hour interval. In adult sleep,
the characterization of recorded bioelectrical signals
is mainly performed using spectral frequency analy-
sis. In the case of newborns, different methods have
been often used (Scher, 2004), e.g. fractal analysis,
dimensional analysis and nonlinear analysis.
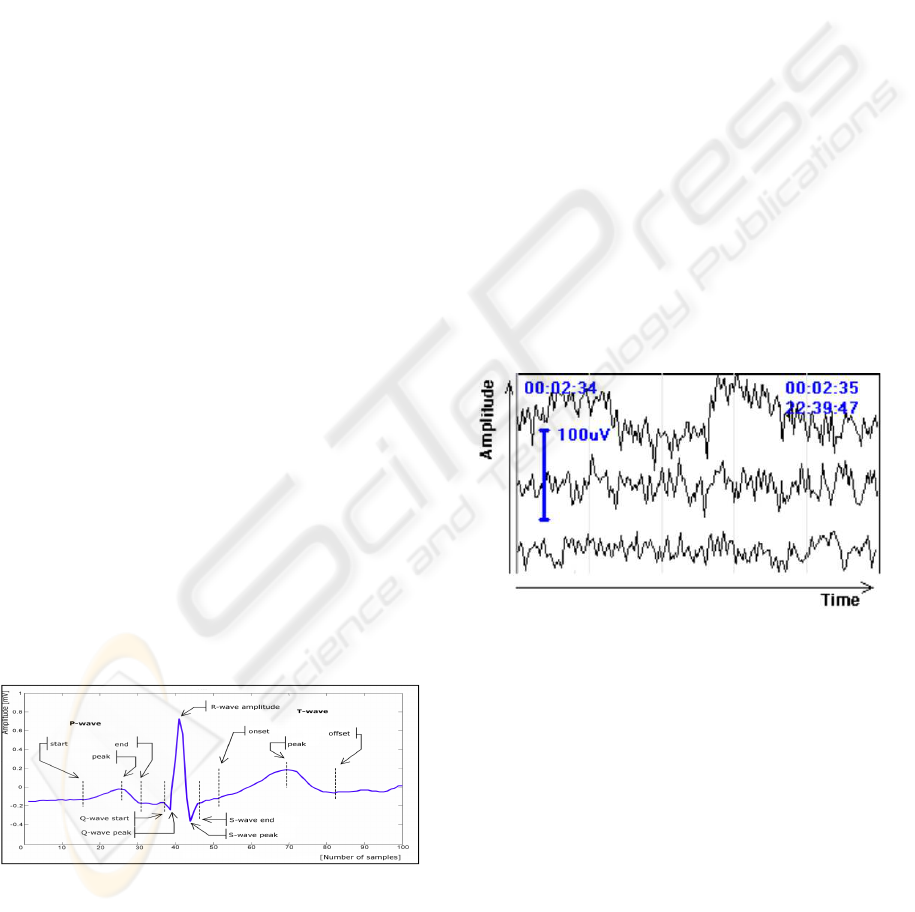
Figure 2: Electrical recording of human brain (an electroen-
cephalogram, EEG). Three channels are shown. The graph
shows amplitude dependency on time (record samples).
Active newborn sleep is characterized by irregu-
lar breathing, saccadic eye movements, small body
movements and twitches. In contrast to adult REM
sleep, peripheral motor pathways are not depressed
during active sleep in neonates, making movements
possible. During quiet sleep, breathing is regular, and
eye and bodily movements are absent. These states
have EEG correlates: EEG in quiet sleep shows ei-
ther continuous high-voltage low-frequency (HVLF)
activity or trace alternant, where HVLF activity al-
ternates with quiet periods in cycles of few seconds
duration. In active sleep, the EEG is relatively quiet
(Teofilo and Lee-Chiong, 2006).
ANT COLONY INSPIRED METAHEURISTICS IN BIOLOGICAL SIGNAL PROCESSING - Hybrid Ant Colony and
Evolutionary Approach
91

2 METHODS
2.1 Methods Inspired by Ant Colonies
The inspiration of the ant inspired algorithms comes
from the foraging behavior of real ant colonies
(Deneubourg et al., 1990) which has been observed
in nature and which has been studied by biology sci-
entists. The idea of ant colony technique for optimiza-
tion was introduced in the early 1990s by M. Dorigo
and the ant colonymetaheuristics has been thoroughly
studied (Dorigo et al., 1999).
The Ant Colony Optimization metaheuristic tech-
nique (Dorigo et al., 1999) is a model of the ant be-
havior used for combinatorial problems. This method
is inspired by the process the real ants use to con-
struct a path using chemical substance (pheromone).
A modification of Ant Colony Optimization can also
be used for dynamic optimization such as network
routing (R. O. Schoonderwoerd, 1996). Review of
ant colony inspired methods can be found for exam-
ple in (Dorigo and Blum, 2005).
The method for optimization in continuous space
has been also developed. It uses probabilistic den-
sity function with Gaussian kernel which represents
the spatial distribution of pheromone has been pro-
posed (Bilchev and Parmee, 1993), (Socha, 2004).
The method presented by K. Socha (Socha, 2004) is
the most related with ant-inspired techniques.
2.1.1 Ant Based Clustering
Also a method for data clustering inspired by ant
cemetery organization of some ant colonies has been
studied (Dorigo et al., 1999) and implemented. It
models the way the ants search the space and col-
lect similar objects together. For example, the Messor
sancta ants organize dead corpses into clusters; brood
sorting has been studied in ant colony of Leptotho-
rax unifasciatus. This approach has been modeled
(Lumer and Faieta, 1994), (Deneubourg et al., 1990)
to perform a clustering of data. It is very sensitive to
the similarity measure used (e. g. Euclidean distance,
etc.) and the range of agent perception. Note, that no
pheromone is used in this method. Also some meth-
ods using pheromone exist, namely A
2
CA (Vizine
et al., 2005).
Another approach can be seen the work of
J. Handl in (Handl et al., 2006) (an ATTA al-
gorithm), which introduce modified neighborhood
function (penalizing high dissimilarities), short-term
memory with lookahead (jumping ants), increasing
radius of perception, time-dependent modulation of
the neighborhood function. The work also introduces
modified threshold function for picking and dropping
the data. The work is followed by the work of Tan et
al. (Tan et al., 2006) which removes the ant metaphor
from the method and presents a deterministic version
of ant-clustering algorithm.
2.2 ACO DTree method
As described in (Abraham et al., 2006), nature in-
spired methods can be successfully used in data min-
ing process. The method ACO DTree (Bursa et al.,
2007) uses an evolutionary approach combined with
ant colony optimization approach. The ACO DTree
method works with a population of classifier trees
(a decision-tree like structure): a hierarchical bi-
nary structure of nodes where each node divides data
set into two parts using a single if-rule (e.g.
if
(feature(i) < value)
then
pass data left
else
pass data right
). The population is continuously
evaluated, new individuals are continuously added
and worst solutions removed. Only the best individ-
uals can contribute in pheromone laying process (in
compliance with (Dorigo et al., 1999)). New individ-
uals are inductively created using the pheromone ma-
trix, preferring important features (features selected
by the best individuals).
2.2.1 Decision Tree Construction
By a classification tree we mean hereby a tree-like
structure composed of similar nodes. Each node can
have left and right sub node. Each node is represented
by a decision rule with two parameters (feature index
feature
j
and decision value decVal) which can be de-
scribed in the following way for an item s
i
:
1 if (s(i).getFeature(j) < decVal)
2 classifyToLeftBranch
3 else
4 classifyToRightBranch
The same applies to the root node. The tree is
constructed as follows: first, a random feature index
is selected (for the root node). The decision value is
also chosen randomly. Then, for each subnode, its
subnode is created with certain probability (inversely
proportional to the level in the tree). The feature in-
dex is selected using the pheromone matrix: success-
ful edges are strongly preferred. The decision value is
determined randomly. The random selection of deci-
sion value does not present a problem, because even
the randomly selected values perform acceptable so-
lution. However, the population is then trained (the
decision values are optimized). See section 2.2.5.
By level in the tree we mean the distance from the
given node to the root node. Tree height is a maxi-
mum level in the tree. Depending on the classification
BIOSIGNALS 2008 - International Conference on Bio-inspired Systems and Signal Processing
92

tree, the data are divided into subgroups which should
have similar properties (minimization of intra-cluster
distance) and the classes should be different as much
as possible (maximization of inter-cluster distance).
This process is known as data clustering.
2.2.2 Decision Tree Evaluation
Each tree can be assigned a real number which can
be called fitness function. This number represents the
classification efficiency of the tree. In the presented
method this number is determined by the ratio of in-
correctly classified data over the total data in the class
(in this paper it is called error ratio). The goal of our
method is to obtain tree with the lowest error ratio on
the given dataset.
For method evaluation, the training data set is
used. The testing data set is used to evaluate the tree
on the unknowndata (data which have neverbeen pre-
sented to the tree). If the classification of the testing
data is not known, cluster validation techniques can
be used. See section 1.1 for more details.
2.2.3 Parameter Estimation
The following parameters are the most important pa-
rameters of the proposed method: population size,
number of new solutions added in each step, maximal
number of iterations, max. tree height, pheromone
lay/evaporate rate and the percent of ants which can
deposit pheromone (elitist ratio). The overall results
are better when the first four parameters increase, but
the computational time rises. For other parameters,
an optimum must be determined.
Based on the results of preliminary experiments,
population size and number of new solutions added
has been fixed to reflect the number of features
and 1/2 of the solutions respectively. These param-
eters actually increase/decrease the number of solu-
tions generated over time. Similar effect can be ob-
tained by adjusting the maximum iteration limit. Eli-
tist ratio (number of best solutions which can deposit
pheromone has been also fixed to the value of 1/2 of
the population (with minimum of 5).
2.2.4 Parameter Adaptation
In order to avoid premature convergence and main-
tain diversity in the population of solutions, adap-
tive techniques have been used. First, the pheromone
amount on the edge is limited and can be in the range
h0.05;1.05i, the evaporation rate and lay rate is adap-
tively changed to maintain an average pheromone
value over the whole pheromone matrix (if the av-
erage pheromone drops by 10 % the pheromone
lay rate is increased, similar policy is applied to
the pheromone evaporate rate; both the values are
bounded by the minimum and maximum value). This
could lead to saturation of pheromone values, thus
a countermeasure to maintain number of saturated
edges on the minimum is also used. The balanced
process diversifies the population and avoids getting
stuck in local minima.
As a measure to speed up the process and to in-
crease the preference of trees with lower height, the
maximum height parameter is continuously increased
with the iterations (at about 1/4 of total iterations the
parameter is increased up to its maximal value).
2.2.5 Tree Optimization
In the ACO DTree method we have presented an op-
timization strategy (local search) which optimalizes
the decision value of each node in the tree. Newly
added solutions are first optimized. This improvesthe
overall fitness of the population.
Also after certain period (experimentally deter-
mined 1/10 of total iterations), the population is re-
optimized (not the structure, but decision values in
the nodes). The method used is Particle Swarm Opti-
mization (Kennedy and Eberhart, 1995), but any other
kind of local search can be used. The use and degree
of the optimization has to be considered, because it
can lead to over-training of the tree: the tree adapts to
the training data set and performs badly on the valida-
tion (and testing) set, thus reducing robustness of the
solution.
3 DATA
This section describes data (biological signals), which
have been used in this study: Electrocardiogram
(EEG) and Electroencephalogram (EEG).
3.1 Electrocardiogram
Extracted features are the basic ECG parameters. In-
put signals are taken from a MIT-BIH database (Gold-
berger et al., 2000), which contains annotated records.
In (Goldberger et al., 2000), certain description of
the data can also be found (together with some ba-
sic anonymous description of the patients, their med-
ication and treatment). The classification into more
classes is nearly impossible due to lack of the data
(mainly abnormal heart action signal) in some sig-
nals. By using only PVC (Premature Ventricular Con-
traction) beat as abnormal heart actions, more records
ANT COLONY INSPIRED METAHEURISTICS IN BIOLOGICAL SIGNAL PROCESSING - Hybrid Ant Colony and
Evolutionary Approach
93

Table 1: The table shows results for the the ACO Dtree al-
gorithm for generating classification trees.
Task ACO Dtree
ECG Classification 97.11 %
EEG Classification 71.30 %
EEG Active/quiet sleep 96.38 %
EEG Noise removal 91.02 %
from the MIT-BIH database can be correctly pro-
cessed. Another approach can be to divide all heart
actions in two classes: normal and abnormal.
From the ECG signal, the following eight features
have been automatically extracted, see (Chudacek and
Lhotska, 2006): amplitudes of Q, R, S, positive T and
negative T wave, amplitude ratio of Q/R, R/S and R/T
waves. For processing, the features have been nor-
malized into the interval of h0.0;1.0i.
3.2 Electroencephalogram
All recordings used in this work contain eight EEG
channels (these are FP1, FP2, T3, T4, C3, C4,
O1, O2), Electrooculogram (EOG), Electromyogram
(EMG), Respiratory channel (PNG) and Electrocar-
diogram (ECG). All the data have been annotated by
an expert into four classes (wake, quiet sleep, active
sleep, movement artifact).
For accurate classification it is necessary to de-
termine and/or calculate the most informative fea-
tures. In our previous study a method based on power
spectral density (PSD) has been applied to each EEG
channel. Features derived from EOG, EMG, ECG
and PNG signals have been also used. The most in-
formative one is the measure of regularity of respira-
tion in PNG signal. The following methods, which
have been used for feature extraction, are in detail de-
scribed in (Gerla et al., 2006).
4 RESULTS
Using the presented method with Particle Swarm Op-
timization, we have obtained 97.11 % accuracy over
the training set (training set has been randomly se-
lected from the whole data set in the ratio of 66 %
and 33 % of training respective testing data vectors).
Using the EEG recordings of patients we obtained
an accuracy of 82 % in the artifact removal process.
The overall classification accuracy is 71.3 %.
The results are summarized in Table 1 and Table 2.
The ACO Dtree method outperformed the Random
Tree method in all cases.
Table 2: The table shows results for the WEKA Random
Tree algorithm for generating classification trees.
Task WEKA Rand. Tree
ECG Classification 96.53 %
EEG Classification 66.21 %
EEG Active/quiet sleep 95.37 %
EEG Noise removal 90.80 %
5 CONCLUSIONS
In this paper we have presented a hybrid method
which can be used for data partitioning, data clas-
sification and also feature selection. The method is
based on the hybrid combination of evolutionary al-
gorithm with ant colony optimization. This combina-
tion allows better convergence and leads to increased
robustness. The method has been compared with a
simple evolutionary algorithm, which does not use
pheromone and with Random tree generation method
(from the WEKA (Witten and Frank, 2005) toolkit).
The hybrid method outperformed the other method
in all cases. The method has been (after prelimi-
nary tests on smaller datasets) applied to the MIT-BIH
database with more than 80.000 records. The EEG
data contains about 450.000 instances.
Certain parameters of the method have been ex-
perimentally determined. The population size should
equal the number of features in the signal (the square
root of the size of pheromone matrix). PSO re-
optimization of the individuals is very important,
however with vigorous optimization, the advantage of
robustness is lost (the results on training data set are
excellent, but very poor on the testing data set).
Lower accuracy on the EEG set is manly due to
high amount of expert misclassification in the data
(the neurologists obtain classification consensus in
about 70 % of the cases).
The results show that the approach is suitable for
biological data clustering. The advantage is that it
produces clear structure with clinical use.
ACKNOWLEDGEMENTS
This research has been supported by the research pro-
gram No. MSM 6840770012 ”Transdisciplinary Re-
search in the Area of Biomedical Engineering II” of
the CTU in Prague, sponsored by the Ministry of
Education, Youth and Sports of the Czech Republic.
This work has been developed in the BioDat research
group
http://bio.felk.cvut.cz
.
BIOSIGNALS 2008 - International Conference on Bio-inspired Systems and Signal Processing
94

REFERENCES
Abraham, A., Grosan, C., and Ramos, V. (2006). Swarm In-
telligence in Data Mining (Studies in Computational
Intelligence). Springer.
Bilchev, G. and Parmee, I. C. (1993). The ant colony
metaphor for searchin continuous design spaces. Proc.
of AISB Workshop on Evolutionary Computing Lec-
ture Notes inComputer Science, pages 25–39.
Bursa, M., Huptych, M., and Lhotska, L. (2006). The use of
nature inspired methods in electrocardiogram analy-
sis. International Special Topics Conference on Infor-
mation Technology in Biomedicine [CD-ROM]. Pis-
cataway: IEEE.
Bursa, M., Lhotska, L., and Macas, M. (2007). Hybridized
swarm metaheuristics for evolutionary random for-
est generation. Proceedings of the 7th International
Conference on Hybrid Intelligent Systems 2007 (IEEE
CSP), pages 150–155.
Chudacek, V. and Lhotska, L. (2006). Unsupervised cre-
ation of heart beats classes from long-term ecg mon-
itoring. Conference: Analysis of Biomedical Signals
and Images. 18th International EURASIP Conference
Biosignals 2006. Proceedings., 18:199–201.
Davies, D. L. and Bouldin, D. W. (1979). A cluster separa-
tion measure. IEEE Transactions on Pattern Recogni-
tion and Machine Intelligence, 1 No. 2:224–227.
Deneubourg, J. L., Goss, S., Franks, N., Sendova-Franks,
A., Detrain, C., and Chretien, L. (1990). The dynam-
ics of collective sorting robot-like ants and ant-like
robots. In Proceedings of the first international con-
ference on simulation of adaptive behavior on From
animals to animats, pages 356–363, Cambridge, MA,
USA. MIT Press.
Dorigo, M. and Blum, C. (2005). Ant colony optimization
theory: A survey. Theoretical Computer Science Is-
sues 2–3, 344:243–278.
Dorigo, M., Caro, G. D., and Gambardella, L. M. (1999).
Ant algorithms for discrete optimization. Artif. Life,
5(2):137–172.
Dunn, J. C. (1974). Well separated clusters and optimal
fuzzy partitions. Journal of Cybernetics, 4:95–104.
Gerla, V., Lhotska, L., Krajca, V., and Paul, K. (2006).
Multichannel analysis of the newborn eeg data. IEEE
ITAB International Special Topics Conference on In-
formation Technology in Biomedicine. Piscataway:
IEEE.
Goldberger, A. L., Amaral, L. A. N., Glass, L., Hausdorff,
J. M., Ivanov, P. C., Mark, R. G., Mietus, J. E., Moody,
G. B., Peng, C.-K., and Stanley, H. E. (2000). Phys-
ioBank, PhysioToolkit, and PhysioNet: Components
of a new research resource for complex physiologic
signals. Circulation, 101(23):e215–e220.
Handl, J., Knowles, J., and Dorigo, M. (2006). Ant-based
clustering and topographic mapping. Artificial Life
12(1), 12:35–61.
Jain, A., Murty, M. N., and Flynn, P. J. (1999). Data cluster-
ing: A review. ACM Computing Surveys, 31:264–323.
Kennedy, J. and Eberhart, R. C. (1995). Particle swarm op-
timization. Proceedings IEEE International Confer-
ence on Neural Networks, IV:1942–1948.
Lumer, E. D. and Faieta, B. (1994). Diversity and adapta-
tion in populations of clustering ants. From Animals to
Animats: Proc. of the 3th Int. Conf. on the Simulation
of Adaptive Behaviour, 3:501–508.
Panos M. Pardalos, Vladimir L.Boginski, A. V., editor
(2007). Data Mining in Biomedicine. Springer.
R. O. Schoonderwoerd, e. a. (1996). Ant-based load balanc-
ing in telecommunications networks. Adaptive Behav-
ior 5, pages 169–207.
Rousseeuw, P. and Kaufman, L. (1990). Finding Groups
in Data: An Introduction to Cluster Analysis. John
Wiley & Sons.
Rousseeuw, P. J. (1987). Silhouettes: a graphical aid to
the interpretation and validation of cluster analysis. J.
Comp App. Math, 20:53–65.
Scher, M. S. (2004). Automated EEG-sleep analyses and
neonatal neurointensive care.
Socha, K. (2004). Aco for continuous and mixed-variable
optimization. Proceedings of ANTS 2004 Lecture
Notes in Comput Science, Springer, 3172:25–36.
Tan, S. C., Ting, K. M., and , S. W. T. (2006). Reproducing
the results of ant-based clustering without using ants.
CEC 2006. IEEE Congress on Evolutionary Compu-
tation, pages 1760–1767.
Teofilo, L. and Lee-Chiong (2006). SLEEP: a comprehen-
sive handbook. Johm Wiley & Sons, Inc., Hoboken,
New Jersey.
Vizine, A. L., de Castro, N. L., Hruschka, E. R., and Gud-
win, R. R. (2005). Towards improving clustering ants:
An adaptive ant clustering algorithm. Informatica 29,
pages 143–154.
Witten, I. H. and Frank, E. (2005). Data Mining: Practical
machine learning tools and techniques, 2nd Edition.
Morgan Kaufmann, San Francisco.
ANT COLONY INSPIRED METAHEURISTICS IN BIOLOGICAL SIGNAL PROCESSING - Hybrid Ant Colony and
Evolutionary Approach
95
