
ROBUST CENTROID-BASED CLUSTERING USING DERIVATIVES
OF PEARSON CORRELATION
Marc Strickert, Nese Sreenivasulu
Leibniz Institute of Plant Genetics and Crop Plant Research Gatersleben, Germany
Thomas Villmann
Clinic for Psychotherapy, University of Leipzig, Germany
Barbara Hammer
Institute of Computer Science, University of Clausthal, Germany
Keywords:
Centroid-based clustering, correlation, quantization cost optimization.
Abstract:
Modern high-throughput facilities provide the basis of -omics research by delivering extensive biomedical
data sets. Mass spectra, multi-channel chromatograms, or cDNA arrays are such data sources of interest for
which accurate analysis is desired. Centroid-based clustering provides helpful data abstraction by representing
sets of similar data vectors by characteristic prototypes, placed in high-density regions of the data space. This
way, specific modes can be detected, for example, in gene expression profiles or in lists containing protein
and metabolite abundances. Despite their widespread use, k-means and self-organizing maps (SOM) often
only produce suboptimum results in centroid computation: the final clusters are strongly dependent on the
initialization and they do not quantize data as accurately as possible, particularly, if other than the Euclidean
distance is chosen for data comparison. Neural gas (NG) is a mathematically rigorous clustering method that
optimizes the centroid positions by minimizing their quantization errors. Originally formulated for Euclidean
distance, in this work NG is mathematically generalized to give accurate and robust results for the Pearson
correlation similarity measure. The benefits of the new NG for correlation (NG-C) are demonstrated for sets
of gene expression data and mass spectra.
1 INTRODUCTION
Massive data sets with a high number of samples
and/or attributes create challenges in de novo data
analysis. Particularly, high-throughput biomedical
devices like mass spectrometers or gene expression
arrays generate thousands of data points in parallel
for which accurate data models are required in order
to faithfully reduce the data complexity and to facili-
tate the analysis.
Centroid-based data representations provide most
intuitive interpretations, because a centroid can be
regarded as noise-free prototype of its surrounding
cloud of data. Especially for many data vectors, cen-
troids can be much more easily assessed than re-
sults from hierarchical clustering, for example. Some
well-known clustering algorithms are freely avail-
able (de Hoon et al., 2004), implementing widely
used methods of Eisen et al. (Eisen et al., 1998).
As a matter of fact, self-organizing maps (SOM)
and k-means clustering are frequently used methods
for extracting a pre-defined number of centroids from
the data (Kohonen, 2001; MacQueen, 1967). While
centroids in k-means get specialized by an iterative
averaging procedure applied to data that they do cur-
rently represent, SOM is a cooperative model with
updates of the best-matching centroid and also of its
neighbors. Since SOM neighbors are related to lateral
centroids arranged on a grid structure, the SOM up-
date triggers a mapping of similar high-dimensional
data vectors onto similar positions of that usually low-
dimensional grid, often, a 2D-plane for visualization.
Due to topological constraints induced by the grid,
quantization accuracy, i.e. data representation, of the
SOM centroids is often not optimum (Villmann and
Claussen, 2006). Thus, if the dimension reduction
197
Strickert M., Sreenivasulu N., Villmann T. and Hammer B. (2008).
ROBUST CENTROID-BASED CLUSTERING USING DERIVATIVES OF PEARSON CORRELATION.
In Proceedings of the First International Conference on Bio-inspired Systems and Signal Processing, pages 197-203
DOI: 10.5220/0001062601970203
Copyright
c
SciTePress

feature of SOM is not needed, better representations
are obtained without grid structure. This can be real-
ized by a SOM-like algorithm called neural gas (NG)
that will be of interest here.
Data condensation requires similarity criteria in
order to gather related items. Besides Euclidean dis-
tance, Pearson correlation is one of the most often
used comparison criteria in biological studies. In
principle, a wide range of similarity measures, ex-
pressed as Minkowski metric or correlation, is avail-
able in self-organizing maps (SOM) and k-means.
There is a commonly overlooked problem con-
nected to similarity rating and model update, though.
SOM centroids, for example, are defined by their
closeness to data points, and it is thus straight-forward
to describe closeness by task-specific similarity mea-
sures. Yet, the SOM update rule ’make close cen-
troids more similar to the data’ is traditionally imple-
mented as a claim for identity: centroids are movedon
straight lines in Euclidean space, in portions depend-
ing on their closeness, towards presented data points.
There is thus a difference between the update rule
for a strict one-to-one correspondence of all centroid
components with those of the represented data vec-
tors, and the more relaxed desire of merely represent-
ing high similarity. Although, for vector pairs, iden-
tity is equivalent to maximum similarity, the situation
is different for a single centroid representing many
data points; then, similarity constraints do usually al-
low more degrees of freedom for the centroid place-
ment than strict identity constraints. Analogous con-
siderations apply to the k-means clustering method,
in which custom measures define data assignments
to centroids, but in which average data centroids are
strictly computed (by averaging) in Euclidean space.
The discrepancy between similarity computation
and subsequent update of data models can be circum-
vented by coupling the update procedure with ana-
lytic properties of the selected similarity measure. In
cost function frameworks the model parameters can
be adapted by optimization of similarity relationships.
Here, gradient-based optimization of centroid loca-
tions is discussed for Pearson correlation similarity.
Correlation is often used in biomedical analysis tasks.
It has got favorable pattern matching characteristics,
and it allows to calculate formal derivatives and can
be directly used in gradient methods such as the Hes-
kes variant of SOM (Heskes, 1999), neural gas (Mar-
tinetz and Schulten, 1991), and generalized learning
vector quantization (Sato and Yamada, 1995). The
subsequent derivative is integrated into the highly ac-
curate neural gas clustering method, for which supe-
rior performance is demonstrated for gene expression
data and mass spectrum data.
2 METHODS
Faithful data representation requires robust centroid
locations within the data. Self-organizing maps
(SOM) realize a cooperative centroid placement strat-
egy by iterative presentation of data points that trig-
ger further improvements of previously placed cen-
troids. A generalformulation of this simple procedure
is given in Algorithm 1.
Algorithm 1 SOM / NG centroid update
repeat
chose randomly a data vector x
k ←argmin
i
{d(w
i
,x)}
{ w
k
is closest centroid to data vector x }
for all m centroids j do
w
j
← w
j
+ γ ·h
σ
D(w
k
,w
j
)
·U(x,w
j
)
{ γ, h,σ,D,U: see text }
end for
until no more major changes
SOM Mode of Algorithm 1. Since SOM centroids
cooperate laterally on a grid structure, updates im-
ply spatial specialization with similar grid neigh-
bors. Grid dependencies between centroids k and j
are expressed by the neighborhood index D(w
k
,w
j
).
For example, rectangular 2D grids possess four di-
rect neighbors N
k
of non-boundary centroids with
D(w
k
,N
k
) = 1. The σ-range of neighborhood co-
operation is expressed by the decreasing function h
σ
,
with maximum value at h
σ
(0) = 1. Often a Gaus-
sian bell h
σ
(D) = e
−D
2
/σ
2
is put upon the grid, con-
tracted during update by shrinking σ → 0. In addition
to neighborhood characterization, the update strategy
of centroid w
j
facing data vector x is described by
U(x,w
j
). As said above, centroids are most often
moved on straight Euclidean lines towards the data
vector, i.e. by the term U(x,w
j
) = (x −w
j
), in small
steps depending on the update rate γ < 1.
NG Mode of Algorithm 1. The neural gas algo-
rithm works exactly the same as described in the pre-
vious SOM mode, except for one crucial exception:
the centroid neighborhood is no longer defined on a
pre-defined grid structure. Instead, the neighborhood
changes dynamically in course of data presentation.
The centroid closest to the currently presented data
vector x is assigned a rank of zero, the runner-up gets
a rank of one, and so forth. In general, the neighbor-
hood is defined by the ranks relative to only the data
vector: D(w
k
,w
j
) = D(w
j
) = rnk(x, w
j
) with
rnk(x,w
j
) =
{d(x,w
i
) < d(x, w
j
),i = 1...m}
.
BIOSIGNALS 2008 - International Conference on Bio-inspired Systems and Signal Processing
198

In contrast to SOM, the best-matching centroid w
k
does not induce a specialized structure on the grid
neighbors, and the rank-based neighborhood is al-
ways data optimum. Centroid update profits from
ranks, because they are useful for breaking ties, i.e.
for differentiation of very similar data. Ranks are ex-
ponentially wrapped by h
σ
(D) = e
−D/σ
, again σ →0
during update iterations. As for SOM, U(x,w
j
) =
(x −w
j
) and γ < 1.
Its is known that the NG algorithm asymptotically
realizes a stochastic gradient descent on the cost func-
tion (Martinetz et al., 1993):
E(W, σ) =
1
C(σ)
·
m
∑
j=1
n
∑
i=1
h
σ
(rnk
x
i
,w
j
)
·d(x
i
,w
j
).
(1)
The scaling factorC(σ) =
∑
m−1
i=0
h
σ
(i) is used for nor-
malization. In the limit σ →0, the NG mode of Algo-
rithm 1 leads to a centroid placement that minimizes
the total quantization error, defined by d(x
j
,w
i
), be-
tween m centroids and n data vectors. This property
does not hold for the SOM version. Even worse,
in general the mathematical optimization target of
SOM is undefined (Cottrell et al., 1994), unless the
costly modification proposed by Heskes is imple-
mented (Heskes, 1999).
The benefits of neural gas are: mathematical un-
derstanding of centroid specialization, high repro-
ducibility of results, neighborhoodcooperation for ro-
bustness against initialization, and easy implementa-
tion. Very importantly, the generic formulation of the
neural gas algorithm allows to create modifications
with respect to the choice of the data similarity mea-
sure. A minor drawback of NG is the sorting oper-
ation, i.e. a computing complexity of O (nlogn), re-
quired for rank calculation. Therefore, a fast batch
version of neural gas with quadratic convergence
based on Newton’s method has been proposed re-
cently (Cottrell et al., 2006), complementing the it-
erative online approach discussed here. The authors
do also present a method for clustering data only de-
fined by a similarity matrix. For its simplicity, we
stick to Algorithm 1 in the following, and we intro-
duce a derivation making full use of the analytic prop-
erties of Pearson correlation for an improved centroid
update rule.
Neural Gas Clustering with Pearson Correlation.
Pearson correlation is our focus of choice, because it
provides a certain degree of invariance to additive or
multiplicative effects induced by measuring devices
or biochemical probe concentrations. Thus, pattern-
based analysis is enhanced by choosing Pearson sim-
ilarity for data vectors and centroids, mathematically
described with abbreviation r(x,w) =
B
√
C ·D
by
r(x,w) =
∑
d
i=1
(x
i
−µ
x
) · (w
i
−µ
w
)
q
∑
d
i=1
(x
i
−µ
x
)
2
·
∑
d
i=1
(w
i
−µ
w
)
2
.
(2)
In principle, the covariance of x and w gets standard-
ized by the product of the individual variances of x
and w. However, due to dynamic centroid update,
there is no much use in making the implicit standard-
ization explicit by data preprocessing, such as z-score
transformation. Furthermore, in cases when correla-
tion is just a building block, like in the dissimilarity
measure (1−r)
p
(Zhou et al., 2002), it is much more
natural to think in terms of a self-contained equation
(Eqn. 2) than in terms of statically preprocessed data.
Correlation described by Eqn. 2 can be plugged
into the cost function Eqn.1 being optimized by gra-
dients along partial derivativesof E with respect to co-
ordinates of all centroids w. In general, these deriva-
tives indicate contributions of the k-th centroid com-
ponent of w to the distance or similarity measure.
For the squared Euclidean distance d
2
(x,w) =
∑
d
i=1
(x
i
− w
i
)
2
this corresponds to the previously
mentioned term U(x,w) = (x −w):
∂d
2
(x,w)
∂w
k
= −2·(x
k
−w
k
) ∝ U(x
k
,w
k
).
For Pearson correlation the derivative is
∂r(x,w)
∂w
k
=
(x
k
−µ
x
) −
B
D
·(w
k
−µ
w
)
√
C ·D
. (3)
Since the cost function should be minimized, cor-
relation r is turned by negative sign into a dissim-
ilarity measure. Therefore, the term U(x
k
,w
k
) =
−∂r(x,w)/∂w
k
is inserted into Algorithm 1 which
constitutes the new version of neural gas for
correlation-based centroid placement, NG-C for
short. It can be shown that this correlation-based up-
date rule yields a valid gradient descent also at the
boundaries of the receptive fields. A proof, origi-
nally for the Euclidean case, is provided by (Martinetz
et al., 1993), where a vanishing contribution of the
ranks was presented. Since the proof does not rely on
specific properties of the Euclidean metric, a direct
transfer to Pearson correlation is possible. Therefore,
Eqn. 1 is still a cost function that gets optimized by
the neural gas algorithm.
Usually, good convergence is reached after 50–
1000 repeated data cycles, depending of the size n of
the data set and the number m of centroids. Thereby,
the neighborhood range σ is exponentially decreased
from a starting size of σ = m to a small value of
σ = 0.001. This involves all prototypes strongly in
the beginning, contracting centroids towards the data
ROBUST CENTROID-BASED CLUSTERING USING DERIVATIVES OF PEARSON CORRELATION
199

’center’, and it leads to a fine-tuning of data-specific
centroids in the final phase.
3 RESULTS
The following three applications show the superior-
ity of NG-C clustering over traditional methods with
Pearson correlation. As demonstrated, cost function
optimization by NG-C provides better data represen-
tations and higher reproducibility of results.
3.1 Single Cluster Representation of
Gene Expression Data
A first proof of concept is given for the simple,
but illustrative task of finding only a single centroid
position. This points out structural differences be-
tween Euclidean- and correlation-based centroid up-
date. We use an exemplary 14-dimensional gene ex-
pression data set, where macroarrays were used to
cover 14 temporal developmental stages in the en-
dosperm tissue of developing barley grains, sampled
from day 0 after flowering in steps of two days to day
26. After quality-based filtering, 4824 highly reliable
genes were obtained. Conforming to standards, ex-
pression values were quantile normalized and log
2
-
transformed. However, for maintaining overall ex-
pression levels, z-score was not applied to the 14-
dimensional expression series. For illustration, the
set was further reduced to 344 genes of prominent
temporal up-regulation with more than 10 transitions
x
j
t
< x
j
t+1
.
Neural gas has been run with Euclidean update
U(x,w) = (x − w) and with updates based on the
derivative of correlation according to Eqn. 3. Both ap-
proaches have been re-run 50 times with random cen-
troid initialization. Each run has been carried out with
100 update iterations using γ = 0.001 for the approach
Euclidean and γ = 0.01 for the correlation-based one.
Neighborhood size σ does not have any influence and
even d is not important for data assignments, because
there is only one centroid to be assigned to. Thus,
only the effect of the derivative of d on the centroid
specialization is studied here.
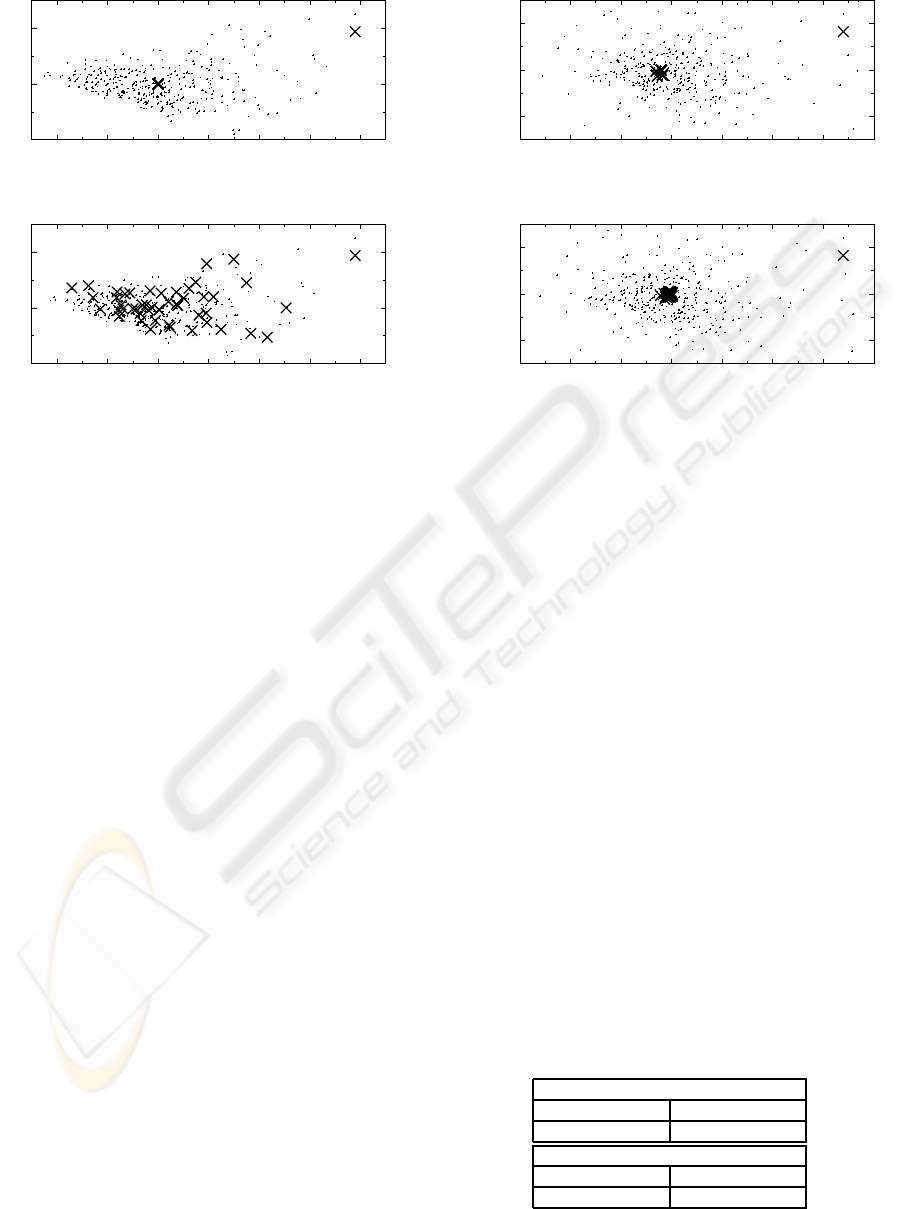
The results are displayed in the plot panel of
Fig. 1. The plots show the 14-dimensional expression
series together with their centroids, projected by PCA
and embedded by multi-dimensional scaling (MDS)
in two dimensions. PCA represents the Euclidean
view on the data, MDS the correlation-based view. To
summarize the displayed results, Euclidean update is
very stringent in both data views, the top left panel
indicating that all 50 centroids are almost perfectly
located in the center of gravity at point (0,0), which
is the k-means solution for k = 1. Complementary to
that, correlation-based update exhibits many degrees
of freedom in Euclidean view, but shows very high
specificity in the correlation view – which is exactly
what is has been designed for.
In addition to visual validation, which might suf-
fer from shortcomings of the built-in dimension re-
duction, quantization errors have been calculated. For
the average data vector, analog to the determinis-
tic k-means result with k = 1, an average correla-
tion of r = 0.96226 to the data vectors is found.
The Euclidean NG-update yields a result with an av-
erage correlation of the generated centroids of r =
0.96222±5.583·10
−5
, which is virtually the result of
the avarage vector, affected by minor update-specific
fluctuations. Correlation-based centroid update yields
the best results with an average correlation of r =
0.96403±8.173·10
−5
. In combination with the bot-
tom left panel in Fig. 1 it can be concluded that there
are non-unique solutions that can be reached only, if
Euclidean constraints are relaxed to updates operating
in correlation space. Despite of the small differences
for the presented data set, the results are quite fun-
damental, because they show that better solutions ex-
ist beyond averages. On a good mathematical basis,
similarity-specific updates induce less constraints on
the cost function and yield better data representations.
3.2 Clustering of Gene Expression Data
Mining for principal shapes in large lists of gene ex-
pression patterns is a central tool for the identifica-
tion of co-expressed genes. Neural gas with corre-
lation is used to meet this purpose for the data set
described in the last paragraph containing 4824 gene
expression levels at 14 time points. For comparison,
Eisen’s implementation of k-means and Gasch’s and
Eisen’s fuzzy k-means are taken as reference mod-
els (de Hoon et al., 2004). Both make use of Pear-
son correlation for creating sets of similar patterns for
centroid calculation, but they compute centroid po-
sitions in Euclidean space. Calculations were done
with 100 cycles for neural gas, i.e. 482,400 centroid
updates, and 100 cycles for the k-means models.
A number of 23 centroids was used in all mod-
els, because fuzzy k-means is, due to its built-in PCA,
limited to 3×#experiments+2=3×14+ 2 = 44 proto-
types of which only 23 were identified as unique by
fuzzy k-means (Gasch and Eisen, 2002). Contrary to
the k-means methods, unused prototypes do not occur
in NG-C, because of its neighborhood cooperation.
The exponential NG-C neighborhood influence is re-
alized as exponential decay from σ = 23 to σ = 0.001,
BIOSIGNALS 2008 - International Conference on Bio-inspired Systems and Signal Processing
200
-1
0
1
-2 -1 0 1 2 3 4
2nd principal component
1st principal component
PCA of gene expressions with NG-centroids from Euclidean update
Data
50 Centroids
-1
0
1
-3 -2 -1 0 1 2 3 4
MDS axis 2
MDS axis 1
Correlation-based MDS with NG-centroids from Euclidean update
Data
50 Centroids
-1
0
1
-2 -1 0 1 2 3 4
2nd principal component
1st principal component
PCA of gene expressions with NG-centroids from correlation update
Data
50 Centroids
-1
0
1
-3 -2 -1 0 1 2 3 4
MDS axis 2
MDS axis 1
Correlation-based MDS with NG-centroids from correlation update
Data
50 Centroids
Figure 1: Centroid specialization for single cluster representation. Top row: Euclidean update rule, bottom row: update based
on derivative of Pearson correlation. Left column: principal component plots, right column: multidimensional scaling of
(1−r) data relationships. In 50 individual NG runs, Euclidean updates (top row) show high specificity for both the Euclidean
data view (shown as PCA) and the correlation-based view (shown as MDS). Correlation-based updates (bottom row) exhibit
large diversity in Euclidean view (PCA) and high specificity in correlation view (MDS).
the update rate is set to γ = 0.001. Two quality criteria
are considered for model comparison: reproducibility
of the obtained centroids for different runs of the al-
gorithms and quantization accuracy.
Reproducibility of Clusters. One major aspect of
clustering is the consistency of the results. This has
been tested by running NG-C and k-means 10 times
from random starting configurations of the 23 cen-
troids. For fuzzy k-means the standard initialization is
fixed, which makes repeats unnecessary. Visual com-
parison is thus restricted to NG-C and k-means. An
informative comparison between both methods is dis-
played in Figure 2, created using the free TreeView
software. Both horizontal intensity bars contain the
23 centroids of 10 runs, i.e. 230 columns. Shades of
gray denote specific gene expression intensities. Pat-
terns of temporal up- and down-regulations present
in the underlying data set are nicely captured by cen-
troids of both models. The tic marks attached to the
bottom of the NG-C bar point out 23 prominent bands
that reflect a high reproducibility of the centroids con-
tained therein, independent of their random initializa-
tion. For k-means, displayed in the row above, the re-
sult is very different: an unspecific continuous range
of final states is obtained, which supports the experi-
ence of many users of k-means who complain about
the poor reproducibility of results.
Quantization Accuracy. Table 1 provides a summary
of the quantization accuracy of the found clusters.
For each run, the average correlation of expression
patterns with their corresponding centroids are mea-
sured, and the respective standard deviations are also
calculated. These two values are averaged over all
centroids. Finally, mean values for the 10 experi-
ments are determined and listed in Table 1. As a major
outcome, NG-C shows a superior data representation
over k-means and fuzzy k-means. The fuzzy k-means
is a little better than simple k-means, but its major dis-
advantage is the limitation to 44 centroids of which 21
are even unused. The good results of NG-C, however,
are not too much surprising, because neural gas has
been mathematically designed to optimize the goal of
Table 1: Average correlations between data samples and
their centroids for 10 independent runs of NG-C and k-
means. The deterministic result of the fuzzy k-means is
0.9335 ± 0.07216. In terms of quantization accuracy and
data assignment variability NG-C performs best. Both k-
means and its fuzzy k-means yield slightly worse quantiza-
tions, but fuzzy k-means covers data more homogeneously.
NG-C
mean std.-dev.
0.9516±0.0001 0.0573±0.0004
k-means
mean std.-dev.
0.9329±0.0017 0.0881±0.0038
ROBUST CENTROID-BASED CLUSTERING USING DERIVATIVES OF PEARSON CORRELATION
201
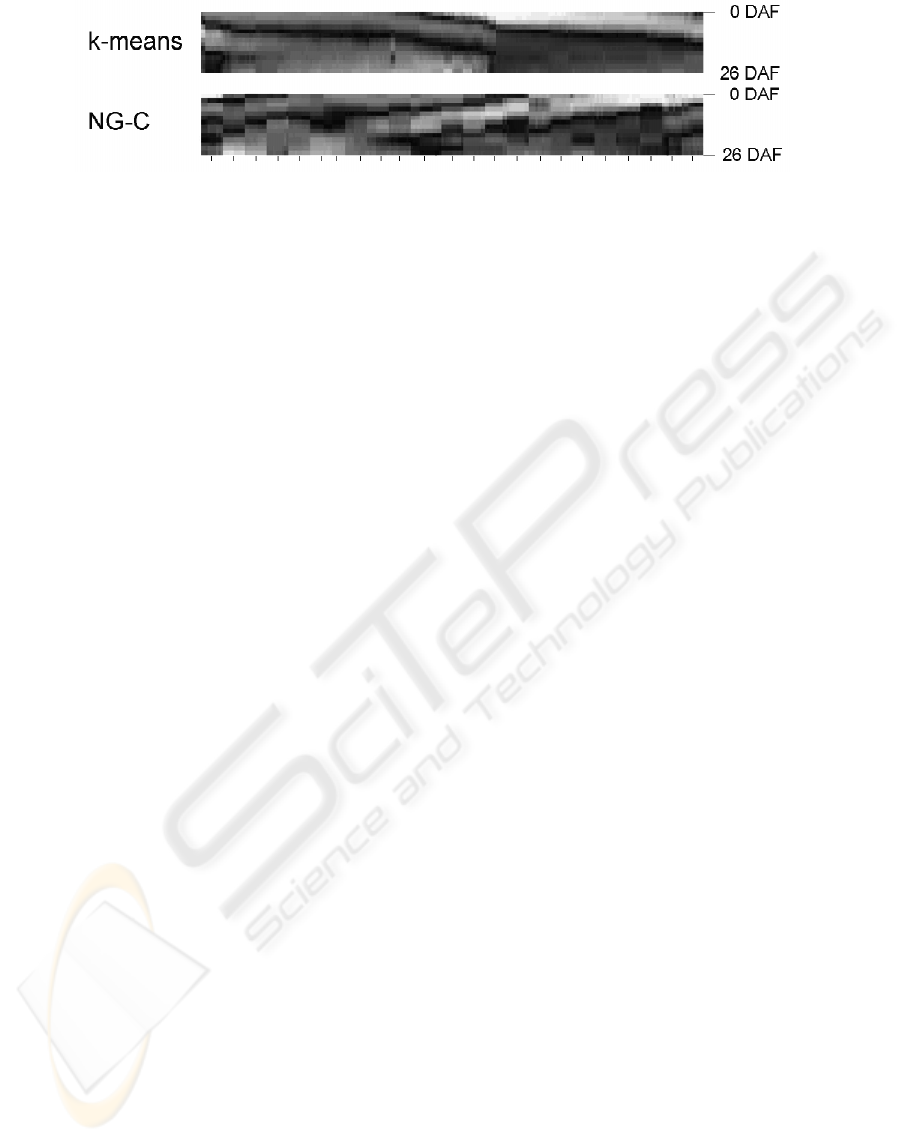
Figure 2: Cluster reproducibility for correlation-based neural gas (NG-C) and k-means. Both models, corresponding to the
upper and lower bar, were run 10 times with random initialization. For the considered number of 23 centroids this yields
a total of 230 centroids (gray columns) for comparison. While the final states of k-means cover a continuum of centroid
locations, exhibiting only one major break, the final states of NG-C are highly conserved and displayed as 23 characteristic
bands containing approx. 10 specific centroids.
maximum quantization accuracy (minimum quantiza-
tion error), while the k-means methods are acting on
assumptions about Euclidean data centers iteratively
assessed by averaging.
3.3 Clustering of Mass Spectra
The last application concerns clustering of mass spec-
trum data from a clinical cancer study with 1050 mass
spectra taken from sliced frozen tissue probes, us-
ing a linear MALDI-TOF MS, Autoflex, in a range
of 2000-10000Da (by courtesy of Bruker Daltonik
GmbH, Bremen). The data preparation protocol of
the measured spectra followed the default workflow
for baseline correction, alignment and peak picking.
Robust peaks with signal to noise ratio S/N > 5 were
used for further analysis, and only maxima of the ex-
tracted peaks were considered. This led to a high
quality data set of 1050 samples, each described by
32 peaks. Clustering assists in tasks of data inspec-
tion and hypothesis generation.
Neural gas is applied in two manners to address
the task of deriving tissue-specific spectrum centroids
from the 32-dimensional data: one with Pearson cor-
relation for centroids assignment, but with Euclidean
update, the other fully correlation-driven for both pat-
tern matching and update.
A small number of 11 clusters has been chosen
in order to force sparse representations and to make
the constraints of stringent Euclidean updates appar-
ent. Both approacheshavebeen trained in 10 indepen-
dent runs using 1000 data cycles, i.e. 1000 x 1050 it-
erations, starting with randomly initialized centroids.
Euclidean update was performed with an update rate
of γ = 0.01. A value of γ = 10
4
was used for the
correlation-based update. This large value compen-
sates for the very small variability of the derivatives
of correlations, which are caused by very similar mass
peak profiles.
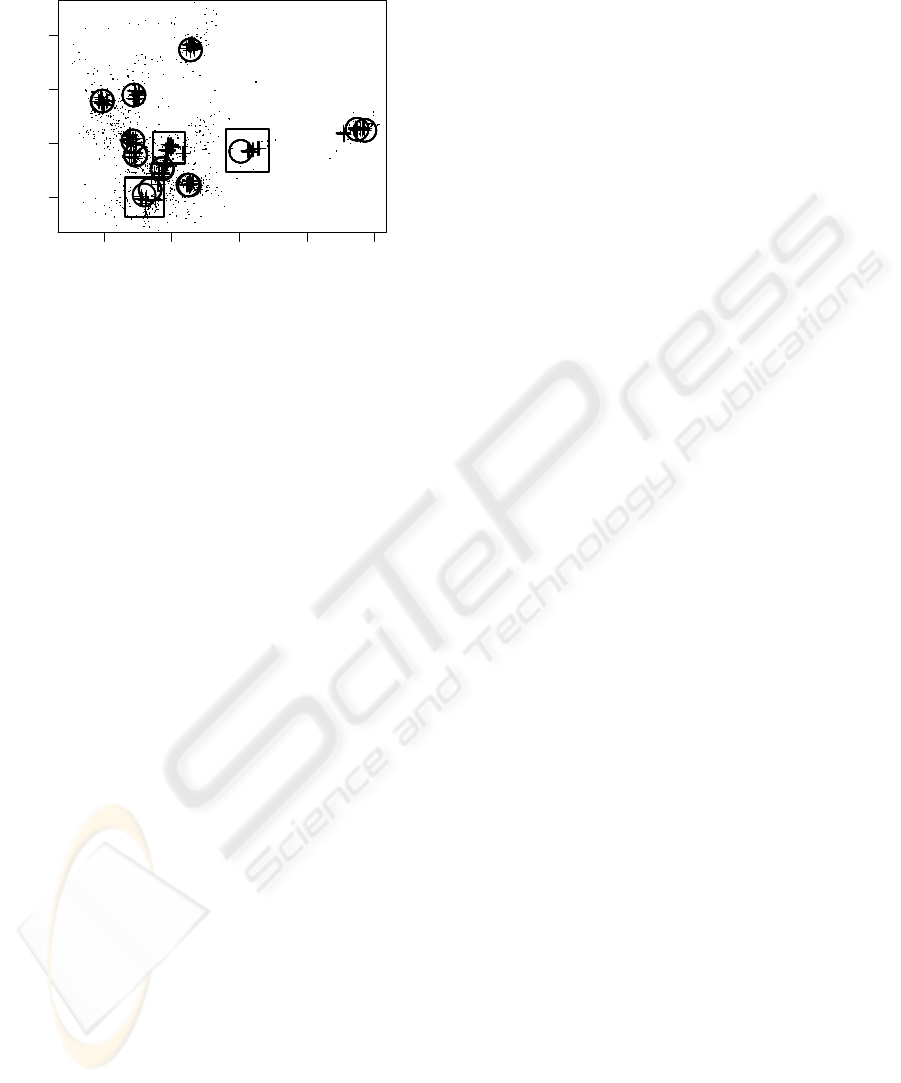
Both methods yield accurate data abstractions,
as shown in Fig. 3. The MDS visualization faith-
fully displays the correlation relationships of the 32-
dimensional centroids and the data. Since similar
scatter points correspond to highly correlated data
vectors, excellent reproducibility of the final con-
figurations and a good data coverage can be ob-
served. With respect to quantization, centroids from
Euclidean update correlate on average at a level of
r = 92.8106±0.0043 with the represented data. Up-
date by Pearson correlation yields an improvement to
r = 93.4854 ±0.0790 for the same number of pro-
totypes. The small standard deviation for Euclidean
update again points out (indirectly) the very strong at-
traction to the final centroid configuration, which is,
however, not optimum in terms of quantization accu-
racy (data representation), for which the correlation
update is clearly a better choice.
4 CONCLUSIONS
Based on the mathematical derivative of the Pear-
son correlation coefficient, we developed a new ap-
proach to maximize correlation in prototype-based
data models. Particularly, the derivative can be di-
rectly plugged into the update step of a generalized
version of the neural gas clustering method. Well-
reproducible high-quality clusters were obtained by
the new NG-C method. For the data clustered here,
k-means and fuzzy k-means, although offering corre-
lation similarity, are clearly outperformed by NG-C.
In general, correlation-based centroid matching com-
bined with Euclidean update, as usually realized in
k-means and SOM implementations, leads to sub-
optimal data representations.
Although Pearson correlation is one of the gold
standards in biomedical data analysis, the above con-
cept can be easily generalized by replacing the deriva-
tive of Pearson correlation by that of other suitable
similarity measures. This opens directions to process
BIOSIGNALS 2008 - International Conference on Bio-inspired Systems and Signal Processing
202
−1 0 1 2 3
−1 0 1 2
Embedded Data Set with NG Centroids
MDS axis 1
MDS axis 2
Figure 3: Visualization of data (small dots) and neural gas
(NG) centroids (circles and crosses). Centroids correspond
to 10 independent runs of NG, each run comprising 11 cen-
troids, for two different update rules. Circles correspond
to NG centroids obtained by Euclidean update; they do ex-
hibit an extremely high reproducibility. Crosses correspond
to centroids with correlation-based update; their final states
are less stringently fixed, but their quantization quality is
better (see text). In many cases, both update rules yield
similar final configurations, but the boxes highlight regions
with sytematic differences.
data from wide scientific fields where domain knowl-
edge needs to be carefully considered.
ACKNOWLEDGEMENTS
Thanks to Frank-Michael Schleif (University of
Leipzig) for the mass spectrum data and for fruit-
ful discussions. This work is supported by
the Ministry of Culture of Saxony-Anhalt, grant
XP3624HP/0606T.
REFERENCES
Cottrell, M., Fort, J., and Pag`es, G. (1994). Two or three
things that we know about the Kohonen algorithm. In
Verleysen, M., editor, European Symposium on Arti-
ficial Neural Networks (ESANN), pages 235–244. D-
facto Publications.
Cottrell, M., Hammer, B., Hasenfuss, A., and Villmann, T.
(2006). Batch and median neural gas. Neural Net-
works, 19(6–7):762–771.
de Hoon, M., Imoto, S., Nolan, J., and Miyano, S. (2004).
Open source clustering software. Bioinformatics,
20(9):1453–1454.
Eisen, M., Spellman, P., Brown, P., and Botstein, D. (1998).
Cluster analysis and display of genome-wide expres-
sion patterns. PNAS, 95(25):14863–14868.
Gasch, A. and Eisen, M. (2002). Exploring the conditional
coregulation of yeast gene expression through fuzzy
k-means clustering. Genome Biology, 3(11):1–22.
Heskes, T. (1999). Energy functions for self-organizing
maps. In Oja, E. and Kaski, S., editors, Kohonen
Maps, pages 303–316. Elsevier, Amsterdam.
Kohonen, T. (2001). Self-Organizing Maps. Springer-
Verlag, Berlin, 3rd edition.
MacQueen, J. (1967). Some methods for classification and
analysis of multivariate observations. In Proceedings
of 5-th Berkeley Symposium on Mathematical Statis-
tics and Probability, pages 281–297. University of
California Press.
Martinetz, T., Berkovich, S., and Schulten, K. (1993).
“Neural-gas” network for vector quantization and its
application to time-series prediction. IEEE Transac-
tions on Neural Networks, 4(4):558–569.
Martinetz, T. and Schulten, K. (1991). A “neural-gas” net-
work learns topologies. Artificial Neural Networks,
pages 397–402.
Sato, A. and Yamada, K. (1995). Generalized Learning
Vector Quantization. In Tesauro, G., Touretzky, D.,
and Leen, T., editors, Advances in Neural Information
Processing Systems 7 (NIPS), volume 7, pages 423–
429. MIT Press.
Villmann, T. and Claussen, J. (2006). Magnification con-
trol in self-organizing maps and neural gas. Neural
Computation, 18(2):446–469.
Zhou, X., Kao, M.-C., and Wong, W. (2002). Transi-
tive functional annotation by shortest-path analysis of
gene expression data. PNAS, 99(20):12783–12788.
ROBUST CENTROID-BASED CLUSTERING USING DERIVATIVES OF PEARSON CORRELATION
203
