
AUTOMATIC COUINAUD LIVER AND VEINS SEGMENTATION
FROM CT IMAGES
Dário A. B. Oliveira, Raul Q. Feitosa and Mauro M. Correia
Department of Electric Engineering, Catholic University of Rio de Janeiro, Rio de Janeiro, Brasil
Department of Computer Engineering, Rio de Janeiro State Universityl Brasil
Unigranrio and National Cancer Institute-INCA, Rio de Janeiro, Brasil
Keywords: Medical Imaging, Liver Segmentation, Vessel Segmentation, Computed Tomography.
Abstract: This paper presents an algorithm to segment the liver structures on computed tomography (CT) images
according to the Couinaud orientation. Our method firstly separates the liver from the rest of the image.
Then it segments the vessels inside the liver area using a region growing technique combined with
hysteresis thresholding. It separates the vessels in segments without any bifurcation, and using heuristics
based on anatomy, it classifies all vessel segments as hepatic or portal vein. Finally, the method estimates
the planes that best fit each of the three branches of the segmented hepatic veins and the plane that best fits
the portal vein. These planes define the subdivision of the liver in the Couinaud segments. An experimental
evaluation based on real CT images demonstrated that the outcome of the proposed method is generally
consistent with a visual segmentation.
1 INTRODUCTION
By and large the CT data analysis is performed
visually by a radiologist. This is a time consuming
task, whose accuracy depends essentially on the ex-
perience of the analyst. Digital Image Processing
techniques can be used to develop methods that
automatically perform many of the tasks involved in
the CT analysis, improving productivity and the
overall accuracy.
The segmentation process is particularly arduous
in abdominal CT images because different organs lie
within overlaping intensity value ranges and are
often near to each other anatomically. Many
techniques have been proposed in the literature for
the analysis of abdominal CT scans. They can be
roughly divided in two main groups: model driven
and data driven approaches (Masutani et al, 2005).
The blood vessel definition is an essential step in
several medical imaging applications. They can be
used as reference to segment different organs and
structures in the human body. Kirbas et al (2004)
presented a review of vessel extraction, in which
many of the available techniques are described in
details.
This paper presents a data driven method to
segment the liver into the eight different regions
proposed by Couinaud (1957), using the hepatic and
portal veins position in the liver. It deals with the
case of low contrast and erroneous connection
between the hepatic and portal veins, as a
improvement proposed in previous work (Oliveira et
al., 2007).
The subsequent text is organised in the following
way. Section 2 presents segmentation method in
details, section 3 reports some results, and the main
conclusions are presented in section 4.
2 THE 3D SEGMENTATION
METHOD
The segmentation method consists of five main
steps:
a) segmentation of organs and muscle tissues,
b) segmentation of the liver,
c) segmentation of the vessels within the liver ,
d) classification of segmented vessels as hepatic
and portal veins, and
e) determination of Couinaud sectors.
249
A. B. Oliveira D., Q. Feitosa R. and M. Correia M. (2008).
AUTOMATIC COUINAUD LIVER AND VEINS SEGMENTATION FROM CT IMAGES.
In Proceedings of the First International Conference on Bio-inspired Systems and Signal Processing, pages 249-252
DOI: 10.5220/0001063202490252
Copyright
c
SciTePress
Details of each step are presented in the next
subsections.
2.1 Segmentation of Organs and
Muscle Tissue
Organs and muscles tissue are the main presence in
abdominal images. Typical grey values of these
tissues occur around the maximum (CM) of the grey
value histogram for the whole CT sequence.
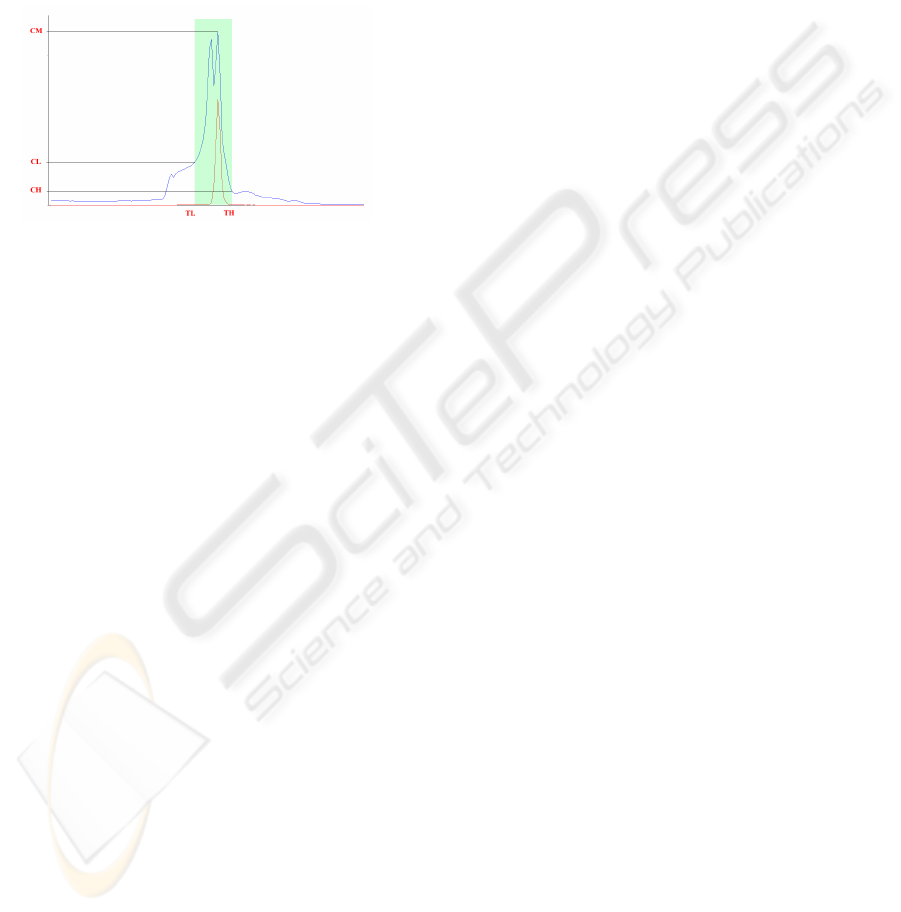
Figure 1: histogram for gray level range definition.
Figure 1 shows the histogram of a sample CT
exam, the range of intensities corresponding to
organs and muscles and the lower and upper limits
TL and TH defining this range.
Let CM be the maximum CT histogram count,
TM the corresponding intensity value, and CL and
CH the counts corresponding respectively to TL and
TH. It has been observed in our experiments that the
ratios RL=CL/CM and RH=CH/CM do not
significantly change from CT exam to CT exam. In
fact these ratios lied around RL=0.6 and RH=0.2
through all our experiments.
This regularity suggests the following procedure
to select the lower and higher threshold values:
a) Compute and smooth the histogram of the
whole CT exam;
b) Detect the maximum histogram count CM;
c) Multiply CM by factors RL and RH, and
obtain the count values CL and CH.
d) Search the smoothed histogram for the
intensity values TL and TH closest to TM
corresponding to CL and CH, such that
TL<TM and TH>TM.
2.2 Liver Segmentation
The next step consists in segmenting the liver.
Generally the liver appears as nearly homogeneous
areas on CT slices, i.e. its intensities are restricted to
a narrow grey value interval. This can be observed
in Figure 1, where the histogram of pixels belonging
to the liver is drawn in red over the histogram of the
whole CT sequence shown in blue.
The extreme values of this interval are
determined in the following way.
One image of the CT set where the liver is
present is selected as the main sample and passed as
an input parameter to the algorithm. Then, the
largest connected component of this slice located on
the upper-left side of the image (right side of the
human body), is identified and its mean value on the
original image is computed.
Using the pixels of organs and muscle tissue
previously segmented, a new grey level range is
determined following a procedure similar to the one
described in subsection 2.1. The histogram count
value corresponding to the liver mean value is used
as the maximum count value and the range limits are
calculated using as limiting ratios the value 0.8 for
both cases. The threshold values obtained this way
are applied to the regions selected in the previous
step.
A simple procedure extracts the liver from the
remaining objects. Starting on the main sample it is
executed on the next adjacent slice upward and
downward in the CT image set till all slices have
been processed. It consists of three main steps:
a) Select the biggest object in the collection;
b) If its centroid is in the upper left quadrant of
the CT image, go to step c, otherwise discard
this object from the collection and go back to
step a;
c) If the selected object is connected to another
object of an adjacent slice previously
classified as liver, classify it as liver,
otherwise discard the object from the
collection and go back to step a;
Clearly the first iteration does not pass through
step c and the object selected in step b is set as liver
directly.
2.3 Vessel Segmentation
Having segmented the liver, and considering only
the region delimited by this organ, we select a
threshold VH, such that the intensities above it
identify unambiguously the vessels inside the liver.
A second threshold VL (VL<VH) is further selected
such that intensities below it clearly indicate liver
parenchyma.
These two threshold values define three ranges
of pixel intensities, namely:
- the strong vessel range, defined by
intensities above VH,
- the weak vessel range, comprising
intensities between VL and VH, and
BIOSIGNALS 2008 - International Conference on Bio-inspired Systems and Signal Processing
250

- the liver tissue range, covering intensities
below VL.
The construction of the vessel tree is performed
by a region growing approach consisting of the
following basic steps:
a) Build the weak vessel object set defined by
the pixels with values above VL.
b) Build the strong vessel object set defined by
the pixels with values above VH.
c) Take the strong vessel set computed in the
preceding step as the initial vessel tree
estimate, and add to it all objects of the weak
vessel set connected to it.
d) Repeat the previous step using the current
vessel tree estimated until it stops growing.
We searched appropriate values for VL and VH
manually through many experiments using different
CT sequences. We observed that the histogram
counts for the manually selected values stayed at a
roughly constant ratio to the intensity corresponding
to the maximum count.
Considering NM the maximum liver histogram
count, and NL and NH the counts corresponding
respectively to VL and VH, the ratios rl=NL/NM and
rh=NH/NM do not significantly change from CT
exam to CT exam. These ratios were determined
experimentally as rl=0.5 and rh=0.2.
Based on this regularity the following procedure
is proposed to select the lower and higher threshold
values:
a) Compute and smooth the histogram of the
image region inside the liver;
b) Detect the maximum histogram count NM
and the corresponding intensity VM.
c) Multiply NM by the ratios rl and rh, and
obtain the count values NL and NH.
d) Search the smoothed histogram for the
intensity values VL and VH corresponding to
NL and NH, whereby both VL and VH are
greater than VM.
2.4 Classification of Portal and Hepatic
Veins
The hepatic and portal veins appear as separate three
dimensional objects in most CT exams. However,
sometimes these veins touch to each other on some
CT slice, what may lead to identifying them as a
single object. In such case the Couinaud
segmentation becomes not possible.
This subsection describes a method to correctly
segment the veins even when they touch in some CT
slice.
Firstly, the method separates the vessel objects
segmented previously in connected components,
hereafter called objects, performing the following
steps:
a) The first slice S1 containing any object is
labelled.
b) The area projected by each object in S1 on
the next adjacent slice S2 is verified. If it
intersects only one object, the same label is
set to the object in S2. If it intersects more
than one object, new labels are created for
each intersected object in S2.
c) Step b is repeated until all objects in the CT
sequence are labelled.
As result vessels segments are obtained whose
extremes are determined by bifurcations, as shown
in Figure 2-b.
A second procedure is performed to classify
these vessel segments as hepatic or portal vein.
Based on knowledge of the anatomy, the following
simple algorithm is proposed. It consists of six steps:
a) The first object identified on the top slice is
selected.
b) If it is divided in three other objects in the
next adjacent slice, it is classified as hepatic
vessel, otherwise it is discarded and other
object is selected on the top slice until this
condition is reached.
c) For each of the three objects identified as
hepatic branches, the next adjacent slice is
analysed. The object with the largest
intersection area is selected as continuation of
the respective hepatic branch.
d) Step c is repeated recursively for each hepatic
branch until no other segment can be merged
to the hepatic vessel tree. At the end of this
step, the major hepatic vessels have been
identified.
e) The vessel segments not assigned to the
hepatic vessel tree up to step d are examined
and the largest 3D connected component is
labelled as the portal vein.
f) Non classified segments which are connected
to the hepatic vessel tree are merged to it.
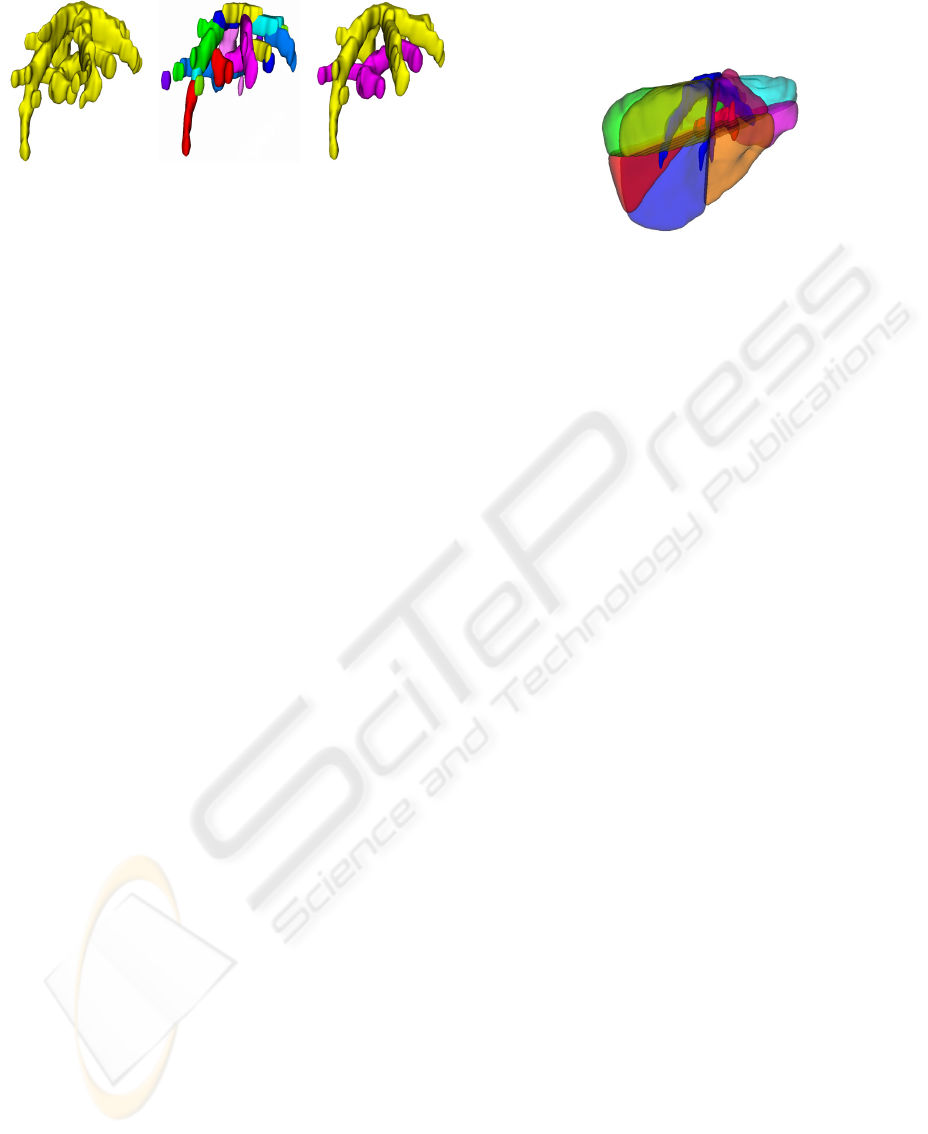
In figure 2-a the hepatic and portal veins are
shown as a single object because they touch on some
CT slice. Figure 2-b shows in different colours
several independent segments delimited by each
bifurcation identified during the classification
process. Figure 2-c shows the final result, where the
hepatic and portal veins appear as separated vessel
trees.
AUTOMATIC COUINAUD LIVER AND VEINS SEGMENTATION FROM CT IMAGES
251
b)
Figure 2: Vessel segmentation results – (a) the portal and
hepatic veins (b) the independent vessel segments
determined by bifurcations (c) the portal and hepatic veins
as separated vessel trees.
2.5 Segmentation of Couinaud regions
The Couinaud paradigm divides the liver into eight
independent segments each one having its own
vascular inflow, outflow, and biliary drainage.
Because of this division into self-contained units,
each can be removed without damaging those
remaining.
Our method estimates the subdivision of the liver
in the eight Couinaud segments, by fitting planes to
the portal vein, and to each of the hepatic vein
branches. To separate the three main branches of the
hepatic vein we apply the k-means algorithm on the
3 dimensional coordinates of the pixels identified in
the preceding step as belonging to the hepatic vein.
It is assumed that there are three clusters. A
restriction for singleton value is imposed so as to
guarantee that no cluster will be empty. This leads to
three different objects corresponding to each branch
of the hepatic vein.
Then, a least squares based procedure determines
the four planes that best fit the points of each branch
of the hepatic vein and the portal vein segmented
before. These planes divide the liver in the Couinaud
segments.
3 RESULTS
A software prototype implementing the proposed
method has been built for validation purpose. It also
implements both the surface and volumetric
visualization of the internal liver structures. It
receives as input the segmented structures of each
image slice and the thickness of the CT slices
available in the DICOM image file header.
Figure 3 shows an example of segmentation
result produced by the proposed procedure as a 3D
surface which can be visualized within our
prototype. It is possible to observe the hepatic vein
and the portal vein respectively in blue and red, and
the Couinaud segments in different colours are also
present. It can be observed that the Couinaud
segments are divided according to the veins
orientation.
Figure 3: 3D models of segmented liver structures.
Experiments performed on seven different CT
sequences have shown that the results produced by
the proposed method are consistent with the visual
perception of a specialist.
4 CONCLUSIONS
This work proposes an algorithm to segment the
liver in computer tomography (CT) images
according to the Couinaud classification.
Experiments conducted on a software prototype
of the proposed algorithm upon 7 CT produced
results consistent with the visual perception. The
method has the potential of becoming a useful tool
in various applications. It can be used to generate 3D
liver representations to aid visual diagnostic and
surgery planning. Shape attributes other than volume
may also be measured from the 3D model and
explored in Computer Aided Diagnostic
environments.
The assessment of segmentation accuracy is a
major concern in the continuation of this work.
REFERENCES
Couinaud, C. “Le Foie: Etudes Anatomiques et
Chirurgicales. Masson”. Paris. 1957.
Kirbas, C. and Quek, F. “A review of vessel extraction
techniques and algorithms.” ACM Comput. Surv. 36,
2 (Jun. 2004), 81-121. 2004.
Masutani Y., Uozumi K., Akahane M. and Ohtomo K.,
“Liver CT image processing: A short introduction of
the technical elements”, E. Journal of Radiology, Vol
58, Liver Lesions, Pages 246-251. 2006.
Oliveira, D.A.B., Mota, G.L.A., Feitosa, R.Q. and Nunes,
R.A., "A region growing approach to pulmonary
vessel tree segmentation using adaptive threshold".
CompIMAGE proceedings, pp. 319-324, 2006, Porto.
c)
a)
BIOSIGNALS 2008 - International Conference on Bio-inspired Systems and Signal Processing
252
