
AN EVALUATION OF THE RELAXATION EFFECT
OF MUSIC BASED ON THE RELATIONSHIPS BETWEEN THE
CONDITION OF PULSE AND MUSIC TEMPO USING THE EEG
AND HRV BASED INDICATORS
Genki Murayama*, Shohei Kato*, Hidenori Itoh* and Tsutomu Kunitachi**
*Dept. of Computer Science and Engineering, Graduate school of Nagoya Institute of Technology
Gokiso-cho, Showa-ku, Nagoya, 466-8555, Japan
**Dept. of Computer Science and Art, Daido Institute of Technology, 10-3 Takiharu-cho, Minami-ku, Nagoya, 457-8530, Japan
Keywords:
Music tempo, relaxation, EEG, HRV.
Abstract:
This paper attempt to investigate the relationships between relaxation effect of music and rhythm of human
body (in this paper fingerplethysmogram (so called ”pulse”) is adopted) using EEG and HRV based two relax-
ation indicators. We focus on following viewpoints: synchronization between pulse and music, the tendency of
pulse beat and pulse-music tempo ratio (µ). This paper reports the experimental results that the pulse decreas-
ing state is effective for EEG based indicator while HRV based indicator is high value at the pulse increasing
state. Furthermore, we classify subjects into 3 groups by the analysis of synchronization between pulse and
music tempo. This papar also reports the analysis of relationships between pulse-music tempo ratio (µ) and
relaxation effect under the classification.
1 INTRODUCTION
Nowadays, ”Kansei” (emotion, feelings) evaluation
has become more important keyword because many
products are used by human and its feeling effects
good or bad impression for the user. Many re-
searchers are now researching the design and another
factors bringing us better feelings. However, it is dif-
ficult to evaluate emotions because there are too many
variations in ”emotion” and there is no general way to
describe it. On the other hand, the objective way of
evaluating emotion is studied in many institutes using
bio signals. To evaluate the feelings, many indica-
tors are adopted. For example, brain wave is popular
one. Alpha wave of brain waves is usually adopted
as a indicator of relaxation. In the ”Kansei” eval-
uation, a study about relaxation effect is performed
flourishingly because many people needs relaxation
in this demanding society. We focused on the re-
laxation effect of music because we can get the mu-
sic relaxation easily sitting at the sofa in the house
and no any special equipment is needed. (T. Naka-
mura, 2002) described the relationships between the
tone of the sound and power spectrum of the alpha
wave using electroencephalography (EEG). On the
other hand, investigation on musical tempo and im-
pression change using subjective valuation has been
reported (K. Kurashima, 2004). In the other case, the
substance in saliva is used as a indicator of stresses.
Music research is also performed in many viewpoints
because music has so many elements: rhythm, tempo,
harmony, instrumental and more. Various researches
focused on the music tempo has been reported. For
example, synchronization between pulse and music
tempo is described in (M. Fukumoto, 2004). The pa-
per stated that synchronization effect is related to re-
laxation effect calculated from heart rate variability.
In this paper, we try to investigate the relaxation ef-
fect of music based on the relationships between the
rhythm of human body and music tempo in addition
to synchronization effect, and report many empirical
results about relaxation effect.
2 SUBJECT OF ANALYSIS
Relaxation indicators:
In this paper, we adopted electroencephalography
(EEG) and heart rate variability (HRV) to calcualte
relaxation indicators. EEG analysis was performed
using the HSK central rhythm monitor system devel-
314
Murayama G., Kato S., Itoh H. and Kunitachi T. (2008).
AN EVALUATION OF THE RELAXATION EFFECT OF MUSIC BASED ON THE RELATIONSHIPS BETWEEN THE CONDITION OF PULSE AND
MUSIC TEMPO USING THE EEG AND HRV BASED INDICATORS.
In Proceedings of the First International Conference on Bio-inspired Systems and Signal Processing, pages 314-319
DOI: 10.5220/0001063603140319
Copyright
c
SciTePress
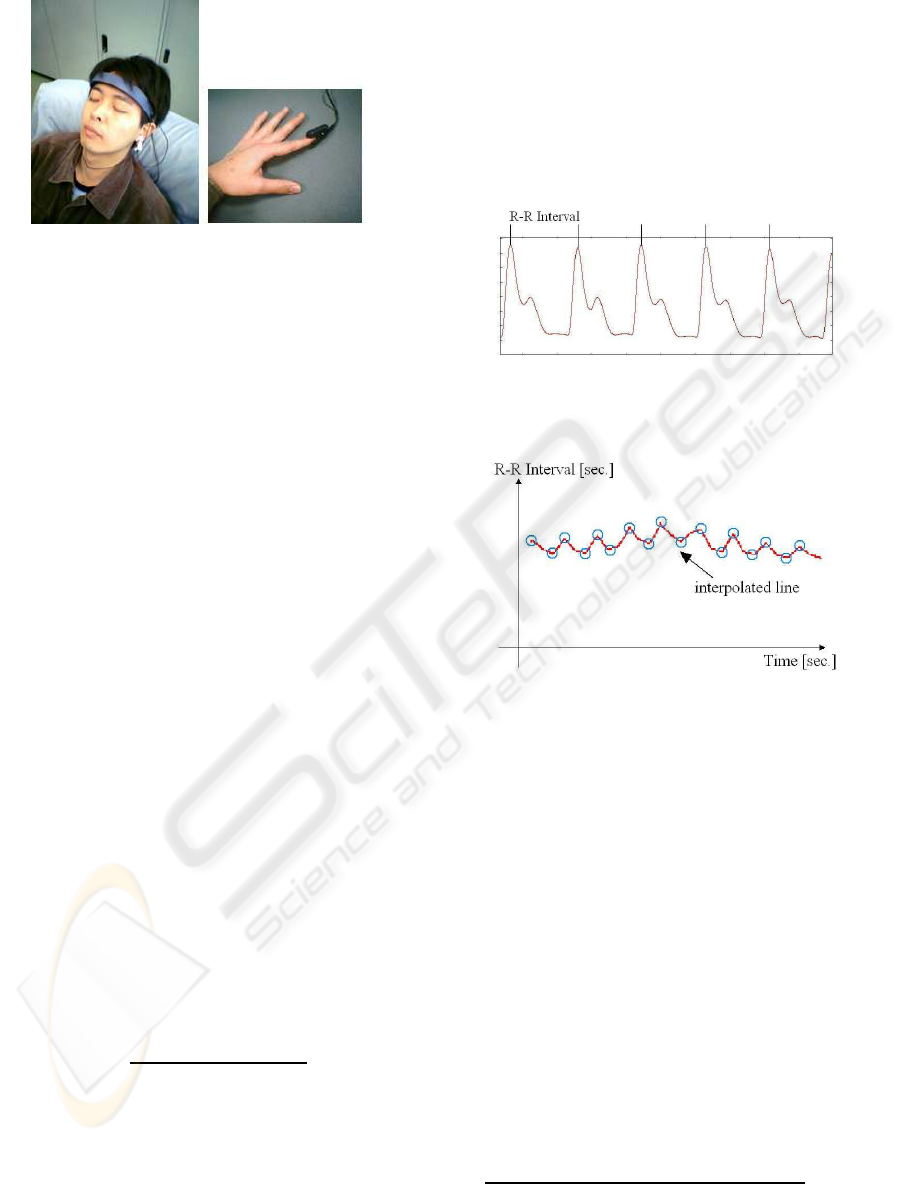
Figure 1: Brain wave and pulse sensor.
oped by Human Sensing Inc in Japan.
This equipment measures the Fp1 and Fp2 chan-
nels of the EEG and estimates the Comfortable-
Degree (CD) (Yoshida, 2000). Ordinarily, EEG is
measured with the International 10:20 method, but we
adopted the method described in (Yoshida, 2000) be-
cause it lightens a burden of the subject. We used the
content ratio of high frequency (HF) as the HRV indi-
cator calculated from the finger plethysmogram (sim-
ply called, pulse).
• Comfortable-Degree
We used Comfortable-Degree as an indicator of
relaxation at brain. This indicator is calcu-
lated from the frequency fluctuation of the brain
waves. Tomoyuki Yoshida tried to make a in-
dicator of comfortable-feelings (Yoshida, 2000).
He insisted that human psychological condition
changes every time if the physical situation was
same. So we have to evaluate the fluctuation of
the human emotion in an objective way. The re-
search groups performed the experiment that ex-
hibit many good or bad smells, sounds and musics
for the subject and investigated the fluctuation of
the alpha wave frequency. According to the result,
the gradient of the spectrum of brain waves in the
left frontal area is get closed to 1.0 in the situation
of comfortable. Conversely, that is get closed to
0 in the situation of uncomfortable. On the other
hand, the gradient of the spectrum of brain wave
in the right frontal area is get closed to 0 in the
condition of subject felt awakening. As a result,
the expression of comfortable degree is consisted
below.
CD(%) =
q
Fp1
slope
2
+ Fp2
slope
2
/2∗ 100, (1)
where F p1
slope
and Fp2
slope
mean the gradient of
the spectrum of alpha wave in Fp1 and Fp2 chan-
nel, respectively.
• Content Ratio of HF
Our heart beat is varying every time and R-R In-
terval (peak to peak) also changes every time.
Many researches focused on this phenomenon
clarified that the changes of R-R interval is re-
lated to autonomic nerve system (Task Force of
the European Society of Cardiology, 1996). This
evaluation method is called Heart Rate Variability
(HRV). The method is performed following steps.
– calculate R-R interval from pulse data (shown
in Figure 2).
Figure 2: A sample of pulse data.
– generate an interpolated R-R interval line
(shown in Figure 3).
Figure 3: Interpolated R-R line.
– Apply the Coarse Graining Spectral Analysis
(CGSA) (Y. Yamamoto, 1991)(Y. Yamamoto,
1993) to make the indicator of autonomic nerve
system clear.
– In CGSA method, FFT is performed to obtain
the frequency power spectrum.
– separate the spectrum into Low frequency
(From 0.024 Hz to 0.15 Hz) and High fre-
quency (From 0.15 Hz to 0.6 Hz).
We used Content Ratio of HF as an indicator of
relaxation at body. LF/HF is used as an indicator
of the sympathetic nervous system (SNS). Con-
tent ratio of HF, i.e., HF/(HF+LF), is used as an
indicator of the parasympathetic nervous system
(PNS) that is also used as a relaxation indicator
because parasympathetic nervous system is dom-
inant during relaxation. We calculated the content
ratio of HF by the HRV method from the pulse.
Relationships between pulse and music:
• Synchronization between pulse and music tempo
(Y. Kusunoki, 2003) stated the synchronization
phenomenon between pulse and music tempo
AN EVALUATION OF THE RELAXATION EFFECT OF MUSIC BASED ON THE RELATIONSHIPS BETWEEN
THE CONDITION OF PULSE AND MUSIC TEMPO USING THE EEG AND HRV BASED INDICATORS
315
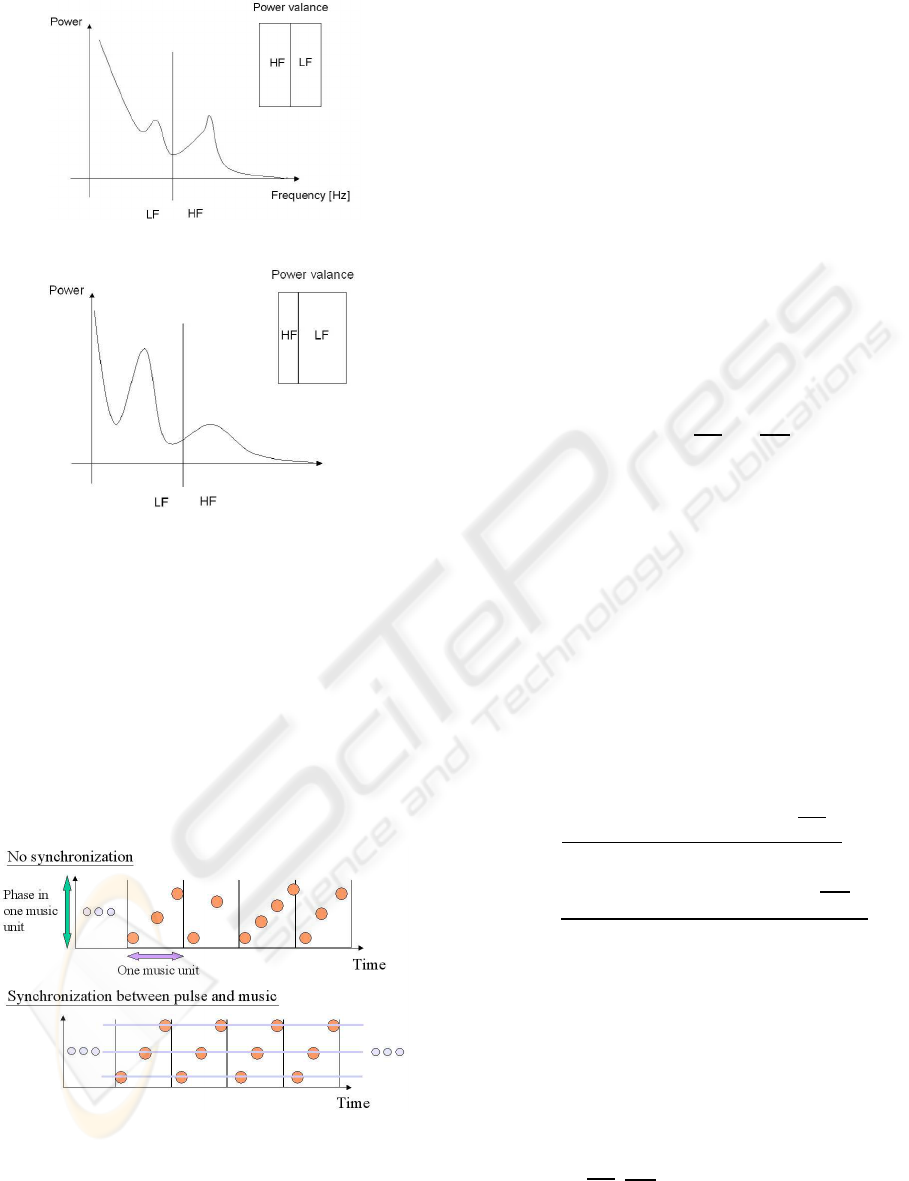
Figure 4: Spectrum of HF/LF valance (in rest).
Figure 5: Spectrum of HF/LF valance (in tilt).
(Later, it is simply called as ”synchronization”)
as a relationship between pulse and music tempo.
(M. Fukumoto, 2004) explained that synchroniza-
tion period is the period where the ratio between
heart rate and the number of music beats is kept
constant, and indicated that a total of the short
synchronization periods in the music experiment
were significantly larger than in the control exper-
iment. For example, a state that the subject’s pulse
beats 3 times while a certain music played in one
musical unit continues for a certain period of time
(see Figure 6).
Figure 6: Example of synchronization.
To analyze the synchronizationbetween pulse and
music tempo, we adopted the method described
in (Y. Kusunoki, 2003). The data (relaxation in-
dicator) obtained are classified into three groups:
no sound, no synchronization, pulse and music
synchronization. In addition to this classification,
no synchronization state is further more classified
into two groups; pulse beat increased and pulse
beat decreased.
• Pulse-Music Tempo Ratio
In this paper, we introduce a scale that is called the
pulse-music tempo ratio. By classifying the con-
dition of the subject from the pulse-music tempo
ratio, we can evaluate the relationships between
relaxation indicator and the state of the subject’ s
pulse and the tempo of music. Musical tempo T
in every minute is expressed by the sequence T
j
(j = t
m
,t
m+1
,...,M), where j is the minute with
music presence, t
m
is the starting minute of music
presence, and M is the total minutes of measure-
ment. Subject i’ s average value of each indicator
in the j-th minute is described as CD
i, j
and HF
i, j
.
The average value of each indicator in all listen-
ing terms is described as
CD and HF. Subject i’ s
average pulse beats in the j-th minute is described
as P
i, j
. Then, we denote the pulse-music tempo
ratio as µ
µ
µ
i
. The µ
µ
µ
i
value for subject i is calculated
every minute using the following equation:
µ
µ
µ
i
= {µ
i,t
m
,µ
i,t
m+1
,...,µ
i,M
}, (2)
where
µ
i, j
= P
i, j
/T
j
, (3)
For example, (Reinhaldt, 1999) reported that synchro-
nization is well observed in the 2:3 state of pulse and
music tempo ratio. In this case, 2:3 state of the pulse-
music tempo ratio corresponds to µ = 1.5.
Finally, we define the efficiency values τ
HF
and
τ
CD
for each indicator calculated from the following
equations:
τ
HF
(µ) =
Σ
N
i=1
Σ
M
j=t
m
{s(µ
i, j
,µ)comp(HF
i, j
,
HF)}
Σ
N
i=1
Σ
M
j=t
m
{s(µ
i, j
,µ)}
, (4)
τ
CD
(µ) =
Σ
N
i=1
Σ
M
j=t
m
{s(µ
i, j
,µ)comp(HF
i, j
,
HF)}
Σ
N
i=1
Σ
M
j=t
m
{s(µ
i, j
,µ)}
,
(5)
where N is the number of subjects, and
s(µ
1
,µ
2
) = {
1 (0 ≤ µ
1
− µ
2
< K)
0 otherwise
, (6)
comp(a,b) = {
1 (a > b)
0 otherwise
(7)
In this definition, τ is the ratio of the frequency
where each indicator (HF
i, j
, CD
i, j
) is higher than its
average value (
CD, HF ) to the frequency where µ
i, j
is classified into µ. Function s classifies the condition
of µ
i, j
into each value of the pulse-music tempo ratio
by the appropriate value K.
BIOSIGNALS 2008 - International Conference on Bio-inspired Systems and Signal Processing
316
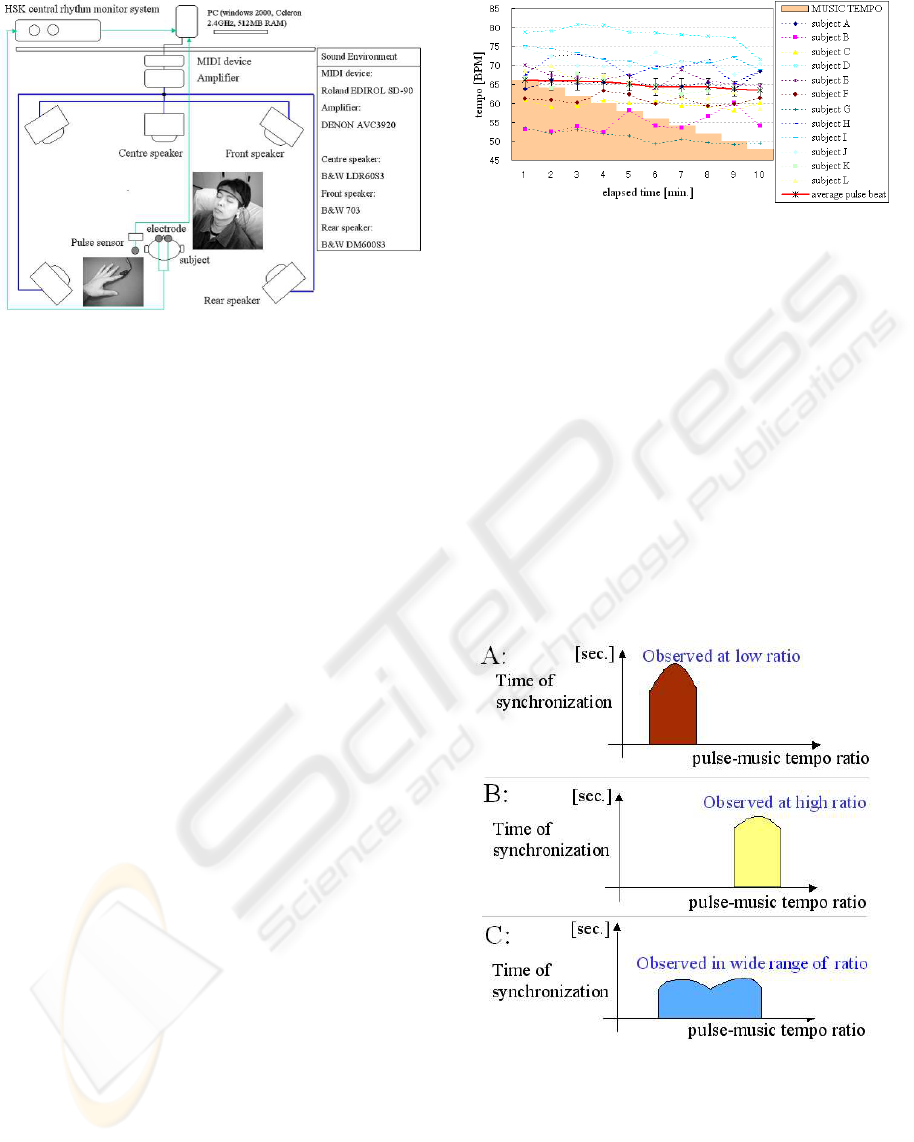
Figure 7: Experiment environment.
3 EXPERIMENT PROCEDURE
The subjects were 12 males in their 20s (N = 12).
During the experiment, the subjects sat on a sofa and
closed their eyes. The experiment consisted of two
parts. In the first 4 min, no sound was presented, and
then music was played for the next 10 min (t
m
= 5
and M = 14). The experimental environmentis shown
in Figure 7. We presented an MIDI (Musical In-
struments Data Interface) digital file ’Gymnopedie,
No.1 (E. Satie)’ as the musical stimulus, as used in
(M. Fukumoto, 2004), and the tempo of the music
was gradually decreased from 66 to 48 BPM every
minute. The filter of the EEG analysis system was ad-
justed to the following settings; low pass filter: 13 Hz,
high pass filter: 8 Hz. During the period of the experi-
ment, a finger plethysmogram (simply called ’Pulse’)
that sampled at 500 Hz was measured from a sub-
ject’s forefinger. The analog data obtained were trans-
lated to digital data and transferred to a PC through an
USB port. To detect the synchronization of musical
tempo and pulse, we adopted the method described
in (Y. Kusunoki, 2003). The output signal from the
MIDI device was transferred to the amplifier through
a fibre optical cable. The volume of sound was fixed
at a level that was not annoying for the subject.
4 RESULTS AND DISCUSSION
4.1 Analysis by Time
Measured average pulse tempo and presented music
tempo is shown in Figure 8. Figure 8 indicate that
the average value of pulse beat decreased 2.9 BPM in
all the listening term, while the change of pulse beat
includes the individual differences.
Figure 8: Music tempo and pulse tempo.
In next section we tried to analyze the relaxation
indicator for each state of the subject using the pulse-
music tempo ratio. According to the variance of the
obtained pulse-music tempo ratio (µ
i, j
), we consid-
ered K = 0.1 to be appropriate to classify µ
i, j
values
in this experiment.
4.2 Analysis by Synchronization
The experimental results have some different tenden-
cies of synchronization. So we classified observation
type of synchronization into 3 groups (shown in Fig.
9): observed at low ratio, observed at high ratio and
observed in wide range of ratio. In this paper ”ratio”
means the pulse-music tempo ratio.
Figure 9: Classification of synchronization.
Experimental result of synchronization were clas-
sified into 3 groups shown in from Fig. 10 to Fig. 12.
The number of person in each groups is following:
• group A(observed at low ratio): 4 subjects
• group B(observed at high ratio): 3 subjects
• group C(observed in wide range of ratio): 5 subjects
AN EVALUATION OF THE RELAXATION EFFECT OF MUSIC BASED ON THE RELATIONSHIPS BETWEEN
THE CONDITION OF PULSE AND MUSIC TEMPO USING THE EEG AND HRV BASED INDICATORS
317
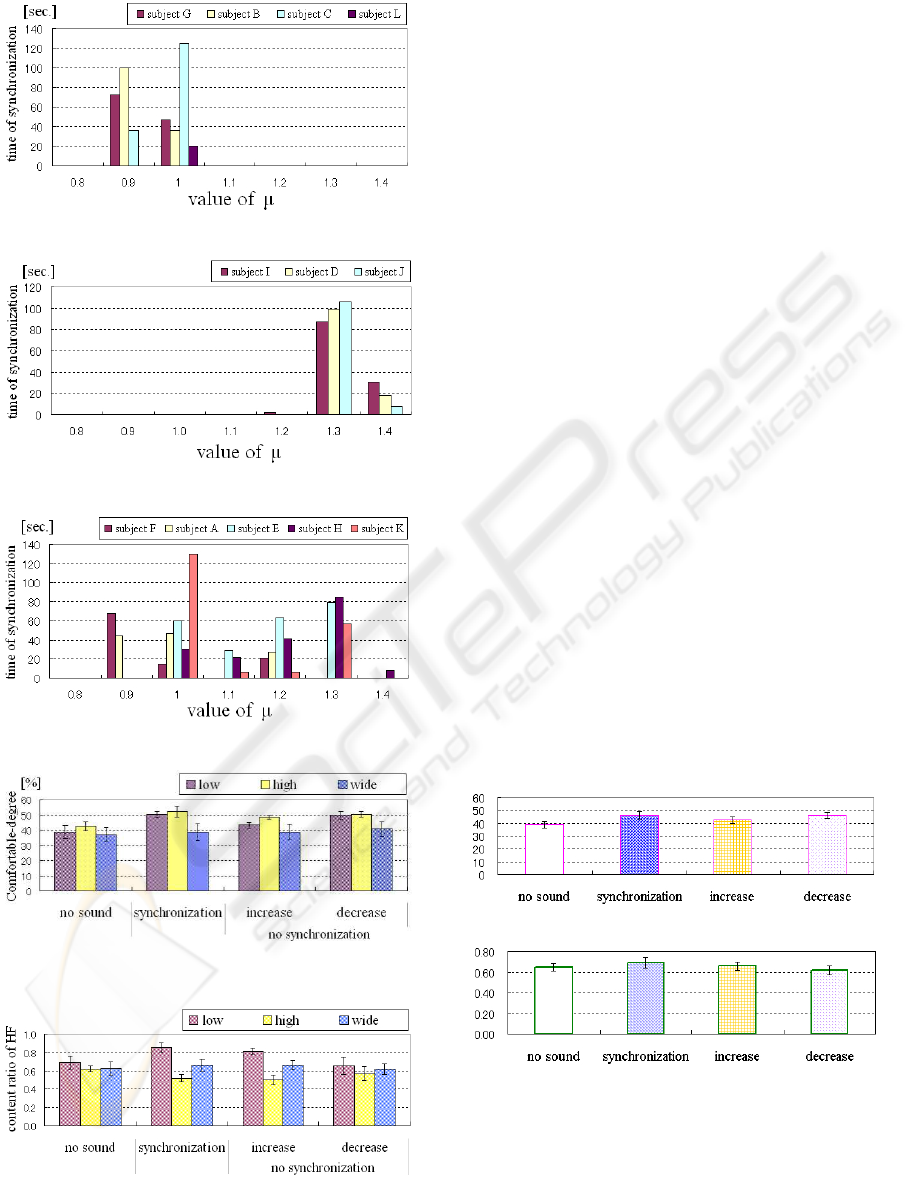
Figure 10: Synchronization observed at low ratio (type A).
Figure 11: Synchronization observed at high ratio (type B).
Figure 12: Synchronization observed at wide ratio (type C).
Figure 13: Synchronization and pulse tendencies and
changes of
CD (each groups).
Figure 14: Synchronization and pulse tendencies and
changes of
HF (each groups).
Synchronizationis observed in spread µ area as shown
in figures. There is no correlation between synchro-
nization occurrence and pulse-music tempo ratio. But
the pulse-music tempo ratio that synchronization is
well observed exists for each subject and the range
has large individual differences (see Fig. 10, 11 and
12).
Next we considered the tendency of the pulse beat.
In this paper, we adopted the gradient of the instan-
taneous pulse beats in every minute as an indicator
of the pulse beat tendency as well as synchroniza-
tion. Experimental result of Comfortable-degree and
content ratio of HF were classified into four groups:
no sound, tempo and pulse synchronization, pulse de-
crease at no synchronization, pulse increase at no syn-
chronization, shown in Fig. 13 and 14.
In Figure 13, the changes of Comfortable-degree in
type C (”observed in wide ratio” group) is smaller
than the other groups. The results in Figure 13 says
that Comfortable-degree is higher in both of syn-
chronization state and pulse decreasing state. Fur-
thermore, Comfortable-degreewith listening to music
(involves synchronization and no synchronization) is
higher than no sound state. As well as Comfortable-
degrees, Figure 14 indicates that the changes of con-
tent ratio of HF in type C group is smaller than any
other groups. On the other hand, content ratio of
HF is higher at the synchronization state same as re-
ported in (M. Fukumoto, 2004). Comparing two indi-
cators (Comfortable-degree and content ratio of HF),
the tendency of content ratio of HF is uneven with
Comfortable-degree. The relationships among relax-
ation effect and synchronization and pulse tendency
in all group is shown in Figure 15 and 16.
Figure 15: Sync. pulse tendency and
CD.
Figure 16: Sync. pulse tendency and
HF.
We first considered the variance of each relaxation
indicators. The result indicates that HF increases in
the synchronization state, that is same as the result of
each groups. However, the HF value in the no sound
state is higher than that in the pulse decreasing state of
no synchronization. On the other hand, Comfortable-
degree in both the synchronization and no synchro-
BIOSIGNALS 2008 - International Conference on Bio-inspired Systems and Signal Processing
318
nization was higher than that in the no sound state.
This result implies that decreasing of the pulse tempo
is as important as synchronization.
4.3 Analyze by Pulse-music Tempo
Ratio
In this section, we calculated µ
i
from the pulse tempo
P
i, j
for all subjects and the musical tempo T
j
, and the
frequencyratios τ
CD
and τ
HF
from the relaxation indi-
cators (HF
i, j
,CD
i, j
) for all subjects with the following
µ values (µ = 0.8,0.9,1.0,...,1.4).
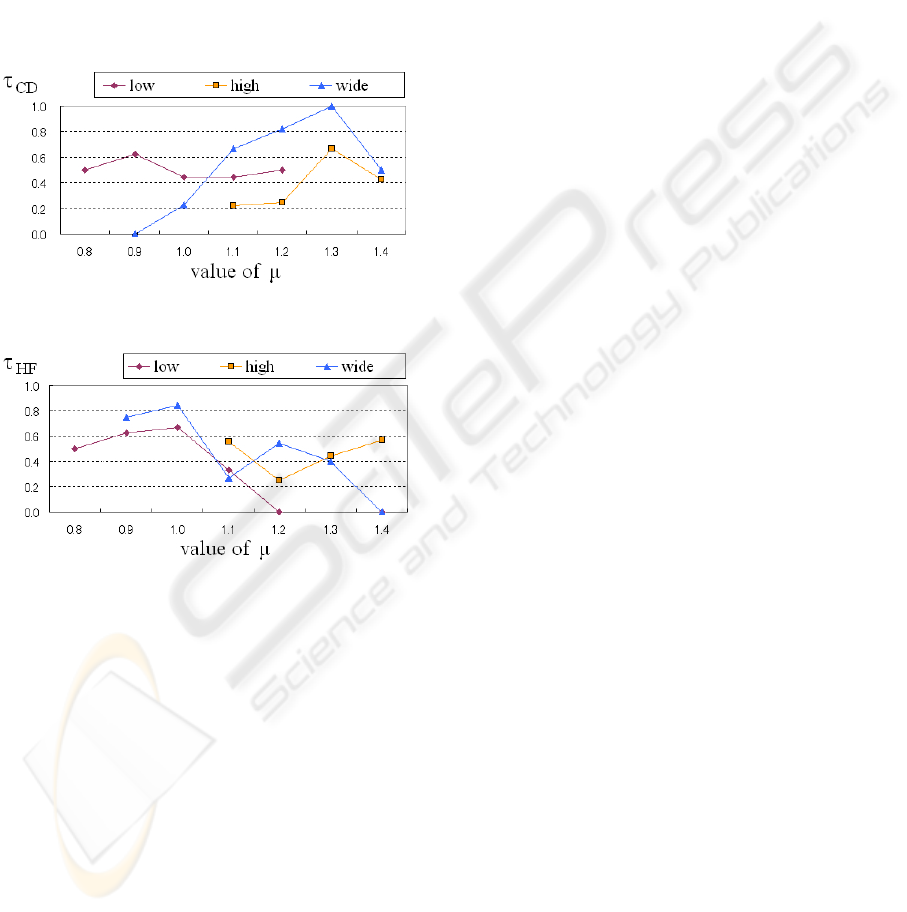
Figure 17: τ
CD
in each group.
Figure 18: τ
HF
in each group.
At first, the relationships between µ and τ
CD
,τ
HF
every groups (see Fig. 9) are shown in Figure 17
and Figure 18. The result in Figure 17 indicate that
the effect for Comfortable-degree in type A group
(”observed at low ratio”) changed constantly in ob-
served pulse-music tempo ratio. In the other groups,
Comfortable-degree was higher in the ratio around
µ = 1.3. In comparison with Comfortable-degree,
content ratio of HF was more effective in lower pulse-
music tempo ratio (around µ = 1.0).
5 CONCLUSIONS
In this paper we reported the relationships among re-
laxation effect, pulse tempo and musical tempo based
on two relaxation indicators. Experimental result in-
dicate that the pulse decreasing state is effective for
comfortable-degree calculated from brain waves as
well as synchronization state. On The other hand,
content ratio of HF calculated from pulse is high value
in pulse increasing state. In analysis of synchroniza-
tion, the tendency of synchronization occurrence is
classified into 3 types. The analysis of pulse-music
tempo ratio showed that each relaxation indicator has
optimum µ value. According to these result, we sug-
gest a new way of using music for relaxation. That is,
selectively presenting music with slower tempo than
the user’s pulse when the user wants the brain relax-
ation, or music with a tempo near to the user’s pulse
when the user wants body relaxation. If there is a
music music that has both two characteristics, that
kind of music is better for us. In the future work,
we will attempt to generate innovative music that de-
pending on the tempo of the user’ s pulse at the be-
ginning of music, the tempo of music is gradually de-
creased to µ = 1.3. We will study whether that kind
of music is effective for both content ratio of HF and
Comfortable-degree.
REFERENCES
K. Kurashima, e. a. (2004). Influence of varying music
tempos on musical perception and preference. Infor-
mation Processing Society of Japan (Special Interest
Groups of Music) Technical Report, 2004(111):125–
130. (in Japanese).
M. Fukumoto, e. a. (2004). Synchronization between tempo
of music and heart beat. Journal of Japan Society of
Kansei Engineering, 4(2):17–24. (in Japanese).
Reinhaldt, U. (1999). Investigation into synchronization of
heart rate and musical rhythm in a relaxation therapy
in patients with cancer pain. Research in Complemen-
tary Medicine, 6(3):135–141. (in German).
T. Nakamura, e. a. (2002). Influence of the tone for brain
wave. Information Processing Society of Japan (Spe-
cial Interest Groups of Music ) Technical Report,
2002(40):33–36. (in Japanese).
Task Force of the European Society of Cardiology, e. a.
(1996). Heart rate variability standards of measure-
ment, physiological interpretation, and clinical use.
European Heart Journal, 17(3):354–381.
Y. Kusunoki, e. a. (2003). A statistical method of detecting
synchronization for cardio-music synchrogram. IE-
ICE Trans. Fundamentals, E86-A(9):2241–2247.
Y. Yamamoto, e. a. (1991). Coarse-graining spectral analy-
sis. J. Appl. Physiol., 71:1143–1150.
Y. Yamamoto, e. a. (1993). Extracting fractal components
from time series. Physica D, 68:250–264.
Yoshida, T. (2000). 1/f like frequency fluctuation in frontal
alpha wave as an indicator of emotion. In Proceed-
ings of the 2000 Spring Conference of KOSES & In-
ternational Sensibility Ergonomics Symposium, pages
99–103.
AN EVALUATION OF THE RELAXATION EFFECT OF MUSIC BASED ON THE RELATIONSHIPS BETWEEN
THE CONDITION OF PULSE AND MUSIC TEMPO USING THE EEG AND HRV BASED INDICATORS
319
