
INVESTIGATION OF ENTROPY AND COMPLEXITY
MEASURES FOR DETECTION OF SEIZURES IN THE
NEONATE
Ehsan Chah
UCD School of Electrical, Electronic and Mechanical Engineering, University College Dublin, Dublin 4, Ireland
Barry R. Greene
Neonatal Brain Research Group, Dept. of Electrical Engineering, University College Cork, Ireland
Geraldine B. Boylan
Neonatal Brain Research Group and the Department of Paediatrics and Child Health, University College Cork, Ireland
Richard B. Reilly
UCD School of Electrical, Electronic and Mechanical Engineering, University College Dublin, Dublin 4, Ireland
and The Cognitive Neurophysiology Laboratory, St Vincent’s Hospital, Fairview, Dublin, Ireland
Keywords: Entropy, complexity, neonatal, seizures, EEG.
Abstract: The performance of three Entropy/complexity measures in detecting EEG seizures in the neonate were
investigated in this study. A dataset containing EEG recordings from 11 neonates, with documented
electrographic seizures, was employed in this study. Based on patient independent tests Shannon Entropy
was found to provide the best in discrimination between seizure and non-seizure EEG in the neonate.
Lempel-Ziv complexity and Multi-scale Entropy were second and third respectively, while Sample Entropy
did not prove a useful feature for discriminating seizure patterns from non-seizure patterns.
1 INTRODUCTION
Seizures are one of the few neurological conditions
in the neonate that require immediate medical
attention and represent the most distinctive sign of
central nervous system dysfunction (Volpe, 2001).
Neonatal seizures occur in 6% of low birth-weight
infants and in approximately 2% of all newborns
admitted to a neonatal ICU. An automatic neonatal
seizure detector would be a significant aid in
newborn monitoring given that expert EEG
interpretation is not available on a 24-hour basis.
The current state of the art in neonatal seizure
detection does not offer the reliability or robustness
necessary for use in a neonatal ICU. A multi-signal
approach has been proposed (Greene et al., 2007),
based on the extraction of pertinent features from
EEG and ECG signals. Choice of which features to
extract is an area of active research in neonatal
seizure detection.
The aim of this study was to compare the
applicability of four measures of signal entropy and
complexity, which measure the degree of regularity
or complexity in a single channel EEG, as possible
features for use in a neonatal seizure detection
system.
2 AUTOMATIC NEONATAL
SEIZURE DETECTION
The block diagram in Fig.1 describes the detection
method employed in this study to compare
17
Chah E., R. Greene B., B. Boylan G. and B. Reilly R. (2008).
INVESTIGATION OF ENTROPY AND COMPLEXITY MEASURES FOR DETECTION OF SEIZURES IN THE NEONATE.
In Proceedings of the First International Conference on Bio-inspired Systems and Signal Processing, pages 17-22
DOI: 10.5220/0001063900170022
Copyright
c
SciTePress
complexity and entropy measures. Initially, the EEG
channel was processed, extracting features or
parameters to facilitate subsequent discrimination in
a pattern classifier between seizure and non-seizure
EEG.
EEG Si gnal Cl ass i f i er
Feat ur e
Ex t rac t i o n
Sei zure/ Non- Sei zure
Figure 1: Detection method block diagram.
The focus of this study was on the feature
extraction phase, with entropy and complexity being
the feature extracted.
3 DATA SET
The dataset for this study comprised multi-channel
EEG recordings from 11 babies from two different
test centers. Recordings from Kings College
Hospital, London (8 babies) were made on
Telefactor Beehive Video EEG machine and
sampled at 200Hz. Recordings from the Unified
Maternity Hospitals, Cork (3 babies) were on a
Viasys NicOne Video EEG machine and sampled at
256Hz.
Table 1: Data set.
Patient
Num of
seizure
segments
Num of
non-
seizure
segments
Total recording
time in minutes
1 30 43 73
2 44 21 65
3 51 24 75
4 55 44 99
5 7 15 22
6 10 22 32
7 31 33 64
8 26 39 65
9 22 26 48
10 16 13 29
11 21 15 36
Electrographic seizures in each multi-channel
recording were labeled such by an expert in neonatal
EEG (author GBB).
Recordings for each patient were then split into
1-min single channel segments either containing
seizure or non-seizure EEG. Only EEG channels that
were determined (by the electroencephalographer) to
contain definite seizure activity were included in the
analysis.
The data set employed was 608 min i.e. 10.13
hours, containing 5.22 hours of seizure EEG and
4.92 hours of non-seizure EEG. Table 1 summarizes
the dataset for this study.
4 ENTROPY MEASURES
Four entropy/complexity measures were compared,
namely Multiscale Entropy, Sample Entropy,
Shannon Entropy and Lempel-Ziv complexity.
Entropy and complexity are dependent on signal
properties and each method quantifies randomness
or complexity of a signal from a different
perspective.
4.1 Sample Entropy
Sample Entropy (SampEn) is the negative natural
logarithm of an estimate of the conditional
probability that sub-series (epochs) of length m that
match point-wise within a tolerance r also match at
the next point (Richman and Moorman, 2000).
SampEn =
A
B
ln
(1)
where B is the total number matched m patterns,
and A is the total number of matched m+1 patterns.
4.2 Multiscale Entropy
Multiscale Entropy (MSE) (Goldberger et al., 2000)
is a modified version of Sample Entropy and
quantifies the degree of regularity or conversely
randomness.
MSE calculation involves two main procedures:
firstly the data (x) of length N is divided into smaller
segments of length τ
, and then the series of average
of each data segment is computed and used to obtain
the “coarse-graining” series y
j
(τ)
.
∑
+−=
=
τ
τ
τ
τ
j
ji
ij
xy
1)1(
)(
1
(2)
Where j can take values between:
τ
N
j ≤≤1
(3)
BIOSIGNALS 2008 - International Conference on Bio-inspired Systems and Signal Processing
18

SampEn is calculated from this coarse graining
series
.
4.3 Lempel-Ziv Complexity
Lempel-Ziv (LZ) (Lempel and Ziv, 1976) quantifies
complexity of a time series, by observing a number
of unique sequences in a given dataset. One
dimensional time series X(t) is converted into series
P(n) of ones and zeros by comparing it to threshold
T
d.
Then the transformed series is scanned from left
to right and number of unique sequences c(n) is
computed.
Let
)(log
)(
n
n
nb
α
=
(4)
Where n is the length of P and α is the size of
alphabet, in zero-one conversion α = 2, .then the
normalized LZ complexity =
)(
)(
nb
nc
(5)
4.4 Shannon Entropy
Shannon Entropy (ShEnt) (Shannon, 1948) has been
defined as a measure of uncertainty of a signal or
degree of orderliness of the data.
ShEnt =
∑
=
−
n
i
ii
pp
1
log
(6)
Where p
i
is an estimate of the probability density
function. A histogram of the signal with k bins is
constructed and from this the probability distribution
can be estimated.
Entropy measures MSE, SampEnt, and LZ
complexity all use sequences of data to determine
complexity or regularity of the signal. Shannon
entropy considers only signal amplitude in order to
measure degree of regularity.
5 METHODS
To assess the applicability of each of these
measures, a detection system was implemented, as
shown in Fig. 1.
Data acquired from the recording equipment was
processed to extract each measure. Calculation of
each entropy/complexity measure assumes that the
number of data points is large, i.e.
∞⎯→⎯N . The
International Federation of Clinical
Neurophysiology (IFCN) recommends that 10 sec is
the minimum electrographic seizure duration if the
EEG background is abnormal (De Weered, 1999).
This suggests a maximum deployable window
length. A longer duration window may result in the
detector missing short duration seizures. The length
of the window was chosen to be 10 sec, similar to a
study by Gotman (Gotman et al., 1997), the window
employed in this study was non-overlapping.
To assess the utility of each entropy feature, a
Linear Discriminant (LD) classifier model was
employed in this study. An LD classifier model finds
the best linear combination that separates between
two or more classes using Fishers discriminant ratio.
Cross fold validation is used to provide an
estimate of the potential utility of these complexity
and entropy based features when employed in a
patient independent seizure detection system. The
classifier model is trained on (n-1) patients and
tested on the n
th
patient. Each fold contains all
features from a single patient i.e. given 11 patients,
thus fold 1 corresponds to Patient 1 and fold 2 to
Patient 2 etc. Four features are extracted from each
10s EEG epoch.
Experiments were carried out to determine the
optimum values of parameters used in SampEnt and
MSE calculations:
5.1 Sample Entropy Parameter r
For SampEnt a tolerance value for accepting
matches, r, must be chosen. In literature (Costa et al,
2005) it is common to have parameters m = 2 and r
between 0.1 and 0.2. in this study m = 2 and r = 0.2
were chosen.
5.2 Multi-Scale Entropy Parameters
In Multi-scale Entropy (MSE) two parameters, scale
τ and tolerance r must be chosen.
5.2.1 Scale τ
Scaling is averaging data points in non-overlapping
windows of size τ. In other words when using
scaling we reduce the number points on which
Sample Entropy is calculated, i.e. when using τ = 10
with a window size of 10 sec (2000 data points)
SampEnt is calculated for 200 points only. In this
study parameters m and r were fixed (m=2, r =0.2)
and the scale τ = 10 was chosen.
INVESTIGATION OF ENTROPY AND COMPLEXITY MEASURES FOR DETECTION OF SEIZURES IN THE
NEONATE
19

5.2.2 Tolerance For Accepting Matches r
In this study r = 0.2 was chosen.
5.3 Lempel-Ziv Complexity
Parameters
In biomedical signal processing it is common to
convert a time series into a series of ones and zeros
by comparing it to a threshold T
d.
T
d
is commonly
chosen
as the median of the signal (Aboy et al.,
2006), thus in this study EEG signals were
transformed into 1’s and 0’s by comparing it to the
median of the signal. Converting to a binary
sequence has the advantage of being simple to
implement in hardware and software and
computationally less expensive.
5.4 Shannon Entropy Parameters
The histogram method was used in order to calculate
Shannon Entropy. The histogram count was
constructed with
nk = bins, where n is the total
number data points in each window.
6 PERFORMANCE MEASURES
The performance of each of the complexity and
entropy based features employed in this study were
determined using the following measures: Accuracy,
Sensitivity, Specificity and ROC curve area.
Accuracy (Acc) is the percentage of each 10 s
EEG epoch correctly classified by an epoch based
seizure detector.
Sensitivity (Sens) is defined as the percentage of
labeled 10s seizure EEG epochs correctly classified
as a seizure epoch by the classifier.
Similarly, specificity (Spec) is the percentage of
labeled 10s non-seizure EEG epochs correctly
identified as non-seizure epochs by the detection
method.
A receiver operating characteristic curve (ROC)
(Zweig and Campbell, 1993) is a plot of sensitivity
versus specificity for different thresholds.
Trapezoidal numerical integration is used to
calculate the area under the curve, this area gives an
indication of how well a given feature discriminates
between seizure and non-seizure epochs. An area of
1 corresponds to a perfect discrimination, while a
ROC area of 0.5 is a result of a random
discrimination. The closer the ROC area value is to
unity the better the discrimination between classes.
7 RESULTS
To obtain an estimate of the patient independent
performance of the measures the classifier was
trained on the data available and then tested on a
data recorded from a patient that was not included in
the training.
The results in Table 2 shows that Shannon
Entropy (ShEnt) gives the best performance out of
the four entropy/complexity measures, however
combining different entropy measures improves the
detection scheme.
Table 2: Patient independent results.
Entropy
/complexity
Acc
(%)
Sens
(%)
Spec
(%)
ROC
Area
ShEnt
69 71 66 0.73
LZ
64 68 58 0.67
MSE
57 58 56 0.59
SampEnt
55 66 43 0.53
Combination
of all four
measures
73 75 71 0.80
Table 3: Performance of individual patients.
Patient Acc (%) Sens (%) Spec(%)
1 79 79 78
2 71 75 63
3 63 59 75
4 69 69 67
5 44 45 43
6 51 53 50
7 97 99 94
8 80 91 74
9 87 98 78
10 52 57 47
11 82 83 81
Table 3 shows the individual performances of
each patient in the dataset when all four
entropy/complexity measures are combined and fed
to the classifier.
BIOSIGNALS 2008 - International Conference on Bio-inspired Systems and Signal Processing
20
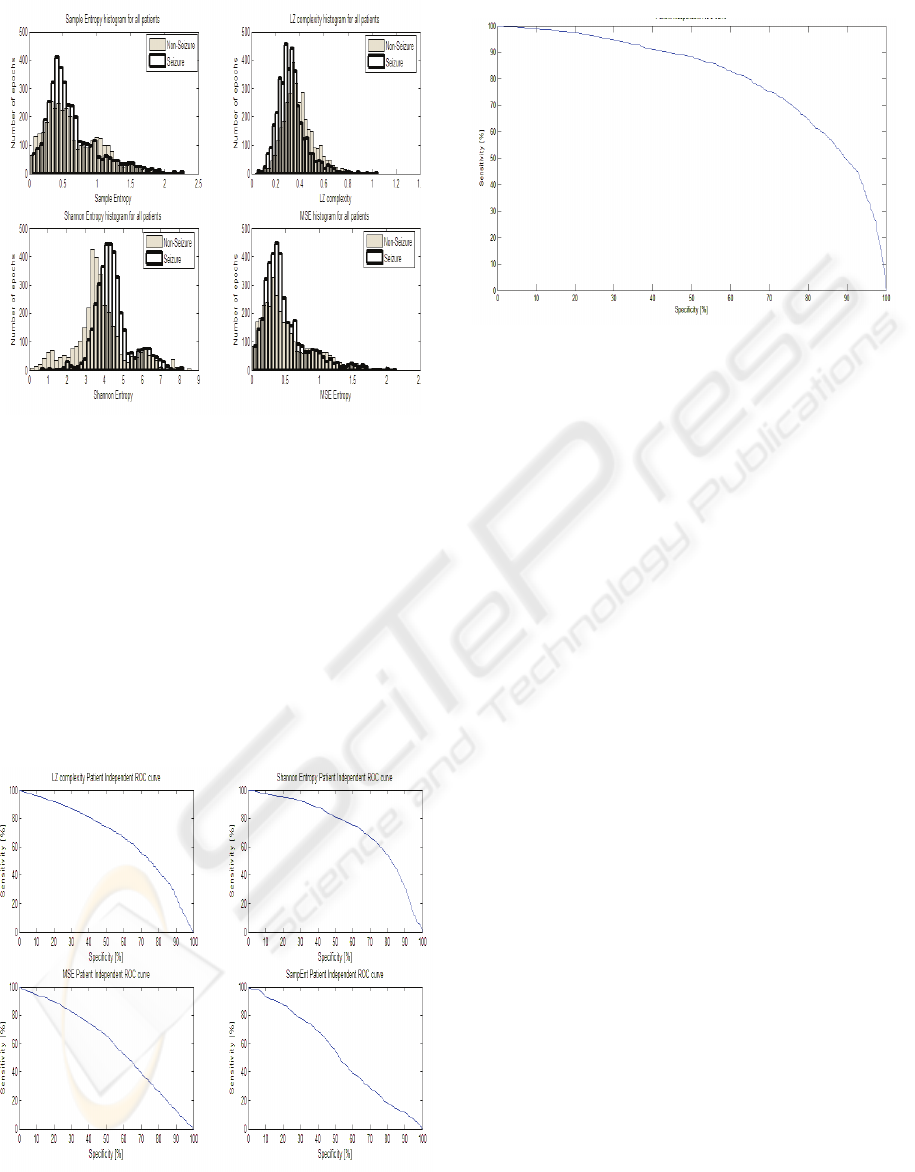
Figure 2: Histogram of entropy features (all patients
combined).
Figure 2 shows histograms for each
entropy/complexity measures for all patients
combined, providing a graphical comparison on how
these measures discriminate between seizure and
non-seizure EEG segments.
The histograms show that the best separation
between seizure and non-seizure EEG epochs
through the application of Shannon Entropy to EEG
data, the next best feature can be seen to be the
Lempel-Ziv complexity, and thus these measures
contribute the most in overall detection scheme.
Figure 3: Patient independent ROC curves for individual
features. ShEnt Roc area 0.73, LZ ROC area 0.67, MSE
ROC area 0.59, SampEnt ROC area 0.53.
Figure 4: Patient independent ROC curve (all features
combined) ROC area 0.8.
From the ROC curves in Fig. 3 it can be
observed that SampEnt does not provide a good
discrimination. We can omit Sample Entropy from
the feature extractor in the patient independent test
and obtain equal results based on the remaining
three entropy measures.
8 DISCUSSION
In this study four Entropy/complexity measures
were applied to neonatal seizure EEG. Results
indicate that Shannon Entropy gives better
performance than other entropy/complexity
measures in discriminating seizure EEG from non-
seizure EEG.
The main reason Shannon Entropy outperforms
other entropy measures in neonatal seizure is
probably due to the fact that Shannon Entropy
considers amplitude of the signal when calculating
entropy and so is suitable for detecting high
amplitude seizures.
The poorest performing entropy measure applied
in this study was Sample Entropy. The patient
independent results showed that if Sample Entropy
is omitted from the feature extractor, equal results
are obtained from the three remaining entropy
measures.
The results also showed that combining different
entropy and complexity measures (with the
exception of SampEn) improved the overall
detection system Acc by 4% compared to the system
when ShEnt is extracted alone. The results also
show that Sample Entropy gives the lowest Acc
results of 55% and a ROC area of 0.53 which is not
much better than a random detection. Thus we
INVESTIGATION OF ENTROPY AND COMPLEXITY MEASURES FOR DETECTION OF SEIZURES IN THE
NEONATE
21

conclude that SampEn does not provide a good
discrimination.
From Fig. 2 is can be observed that while Sample
Entropy and Lempel-Ziv complexity values decrease
as a seizure is occurring, Shannon Entropy and
Multi-Scale Entropy increase as a seizure is taking
place. Similar behavior of entropy measures were
reported in (Costa et al., 2005) for ECG analysis and
(Ferenets et al., 2006) for EEG analysis. Ferenets et
al explain that ShEnt “is indifferent to the time order
of the signal”, while SampEnt and LZ are dependent
on the order of signal thus this might explain the
behavior mentioned above.
In a recently reported EEG based detection
method (Greene, 2006) six features were extracted,
one being Spectral Entropy. The patient specific
results reported in (Greene, 2006) showed that the
best performing feature was line length, while
Spectral Entropy and Non-linear Energy were
second best performing features. Therefore, it would
be beneficial to investigate if adding Spectral
Entropy to the list of features extracted in this study
will improve the overall performance of the
detection method.
In this study, the total amount of data employed
was 10.13 hours. In order to attain a clinically
relevant performance estimate for the method
proposed, a much larger data set would be required.
Using the features, with the parameter values chosen
from this study, on a new larger dataset containing
multi-channel continuously recorded EEG, would
further validate the effectiveness of these measures
in neonatal seizure detection.
9 CONCLUSIONS
The conclusion drawn from this study is that out of
the four entropy/complexity measures investigated.
Shannon entropy provides the best discrimination
between seizure and non-seizure EEG in the
neonate.
ACKNOWLEDGEMENTS
B. R. Greene was supported by Science Foundation
Ireland (SFI/05/PICA/1836).
REFERENCES
Aboy, M., Hornero, R., Abasolo, D., Alvarez, D., 2006.
Interpretation of the Lempel-Ziv Complexity measure
in the context of biomedical signal analysis. IEEE
Transactions on Biomedical Engineering, 53(11), p.
2282-2288.
Costa, M., Goldberger, A. L., Peng, C. K., 2005.
Multiscale Entropy Analysis of Biological Signals.
Physical Review, E;71:021906.
De Weered, A. W., Despland, P. A., Plouin, P., 1999.
Neonatal EEG. The International Federation of
Clinical Neurophysiology. Electroencephalography
Clinical Neurophysiology, 52, p. 149-157.
Ferenets, R., Lipping, T., Anier, A., Jantii, V., Melto, S.,
Hovilehto, S., 2006. Comparison of entropy and
complexity measures for the assessment of depth of
sedation, IEEE Transactions on Biomedical
Engineering, 53(6). p. 1067-1077, JUNE.
Goldberger, A. L., Amaral, L.A N., Glass, L., Hausdorff,
J. M., Ivanov, Mark, P. C. R. G., Mietus, J. E.,
Moody, G. B., Peng, C., Stanley, H. E., 2000.
PhysioBank, PhysioToolkit, and PhysioNet,
Components of a New Research Resource for
Complex Physiologic Signals. Circulation
101(23),e215-e220.
Gotman, J., Flanagan, D., Zhang, J., Rosenblatt, B., 1997.
Automatic seizure detection in newborns: methods and
initial evaluation. Electroencephalography and
clinical Neurophysiology, 103, p. 356-362.
Greene, B., Boylan, G., Reilly, R., de Chazal, P.,
Connolly, S., 2007. Combination of EEG and ECG for
improved automatic neonatal seizure detection,
Clinical Neurophysiology. 118, 1348-1359.
Greene, B. R., 2006, Quantification and classification of
Electrophysiological Markers of Seizure in the
Neonate. PhD thesis, University College Dublin,
National University of Ireland.
Lempel, A., Ziv, J., 1976. On the complexity of finite
sequences. IEEE Transactions on Information
Theory, IT-28(1), p. 75-81.
Richman, J. S., Moorman, J. R., 2000. Physiological time-
series analysis using approximate entropy and sample
entropy. American Journal of Physiology - Heart
Circulatory Physiology, 278(6). H2039-H2049.
Shannon, C. E., A mathematical theory of communication.
1948. Bell System Technical Journal, 27. p. 379-
423.
Volpe, J. J., 2001. Neurology of the newborn. 4
th
ed.
Philadelphia PA.: Saunders.
Zweig, M., Campbell, G., 1993. Receiver-Operating
Characteristic (ROC) plots: a fundamental evaluation
tool in clinical medicine. Clinical Chemistry, 39(4), p.
561-577.
BIOSIGNALS 2008 - International Conference on Bio-inspired Systems and Signal Processing
22
