
CARDIAC MAGNETIC FIELD MAP TOPOLOGY QUANTIFIED
BY KULLBACK-LEIBLER ENTROPY IDENTIFIES PATIENTS
WITH HYPERTROPHIC CARDIOMYOPATHY
A. Schirdewan, A. Gapelyuk, R. Fischer, L. Koch, H. Schütt, U. Zacharzowsky
R. Dietz, L. Thierfelder
Medical Faculty of the Charité, Franz-Volhard-Klinik, Helios Klinikum-Berlin, Wiltbergstr. 50, D-13125 Berlin, Germany
N. Wessel
Department of Physics, University of Potsdam, Am Neuen Palais 10, D-14415 Potsdam, Germany
Keywords: Patient screening, Cardiac magnetic field mapping, Kullback-Leibler entropy; Hypertrophic
cardiomyopathy.
Abstract: Hypertrophic Cardiomyopathy (HCM) is defined clinically
by the growing/thickening of especially the left
heart muscle. In up to 70 % of cases, there is a family history of this condition. The individual risk for
affected patients strongly varies and depends on the individual manifestation of the disease. Therefore, an
early detection of the disease and identification of high-risk subforms is desirable. In this study we
investigated the capability of cardiac magnetic field mapping (CMFM) to detect patients suffering from
HCM (n=33, 43.8 ± 13 years, 13 women, 20 men; vs. a control group of healthy subjects, n=57, 39.6 ± 8.9
years; 22 women, 35 men; vs. patients with confirmed cardiac hypertrophy due to arterial hypertension,
n=42, 49.7 ± 7.9 years, 15 women, 27 men). We introduce for the first time a combined diagnostic approach
based on map topology quantification using Kullback-Leibler (KL) entropy and regional magnetic field
strength parameters. The cardiac magnetic field was recorded over the anterior chest wall using a
multichannel-LT-SQUID system. We show that our diagnostic approach allows not only detecting HCM
affected individuals, but also discriminates different forms of the disease. Thus, CMFM including KL
entropy based topology quantifications is a suitable tool for HCM screening.
1 INTRODUCTION
Hypertrophic cardiomyopathy (HCM) is a primary
inherited cardiac muscle disorder characterized by
hypertrophy, usually in the absence of other loading
conditions, such as hypertension. In the general
population, familial hypertrophic cardiomyopathy
(FHCM) is the most common cardiovascular genetic
disorder with a prevalence of about 1 in 500 adults.
HCM is caused by mutations in several cardiac
sarcomeric contractile protein genes. So far
mutations in 11 different genes, including the
cardiac ß-myosin heavy chain (ß-MHC), myosin-
binding protein C (MyBP-C), cardiac troponins T
and I, α-tropomyosin, myosin light chains and, more
recently, titin and actin genes, have been identified
(Seidman 1998, Thierfelder 1994). Histo-
pathological hallmarks of HCM are myocyte
hypertrophy with disarray and increased cardiac
fibrosis, leading to electrical remodeling processes
in the myocardium (Maron, 2004). The clinical
course of the disease is heterogeneous. Clinical
presentation of HCM ranges from minimal or no
symptoms to the development of the most serious
complications, including atrial fibrillation, heart
failure, and sudden death, often at a young age and
in the absence of previous symptoms (Spirito, 1989).
One of the strongest predictors of disease
progression to heart failure and finally death is the
existence of a hemodynamic obstruction of the left
ventricular outflow tract during systole, which per
convention is defined by a pressure gradient ≥30
mmHg measured by continuous wave doppler
echocardiography. Therefore, it is of clinical
importance to distinguish between the obstructive
(HOCM) and non obstructive (HNCM) form of the
disease. Familial hypertrophic cardiomyopathy is
445
Schirdewan A., Gapelyuk A., Fischer R., Koch L., Schütt H., Zacharzowsky U., Dietz R., Thierfelder L. and Wessel N. (2008).
CARDIAC MAGNETIC FIELD MAP TOPOLOGY QUANTIFIED BY KULLBACK-LEIBLER ENTROPY IDENTIFIES PATIENTS WITH HYPERTROPHIC
CARDIOMYOPATHY.
In Proceedings of the First International Conference on Bio-inspired Systems and Signal Processing, pages 445-452
DOI: 10.5220/0001064504450452
Copyright
c
SciTePress

the most common structural cause of sudden cardiac
death in individuals aged less than 35 years,
especially in competitive athletes. Thus, an early
recognition of the disease is useful for risk
assessment and starting drug therapy and non-
pharmacological treatment options to prevent
prognostic fatal heart failure and mortality. The
detection of affected patients remains still
challenging. Genetic testing allows accurate
diagnosis of HCM and its causing mutations, but has
some limitations. First, DNA screening is not part of
routine clinical evaluation, and identifies the
mutation actually only in 50-60 % of patients.
Secondly, as shown by DNA genotype-phenotype
correlation studies, the disease expression varies not
only between unrelated individuals but also within
the same family. At present, clinical screening and
risk stratification includes medical history, clinical
examination, 12-lead ECG at rest and under physical
exercise, Holter-ECG, echocardiography and cardiac
magnetic resonance imaging. Follow-up
examinations should be encouraged in affected
patients on a 12-18 month basis. For their first
degree relatives annual evaluations are
recommended in the adolescence period and every 5
years beyond the age of 18.
Noninvasive electrophysiological diagnosis in
patients suffering from HCM is usually done by
electrocardiography, rarely by body surface potential
mapping studies. However, information content
from ECG signals seems to be limited and not
disease specific (Maron, 1990). As an alternative to
electrocardiography, magnetocardiography can be
used for a study of cardiac electrophysiological
phenomena, especially myocardial electrical
remodeling processes. Changes in myocardial
electrical properties were shown to be associated
with the development of hypertrophic
cardiomyopathy (Fananapazir, 1989). Multi channel
cardiac magnetic field mapping (CMFM) reflects the
magnetic fields generated by the myocardial
electrical currents occurring during the cardiac
cycle. CMFM signals have several advantages: (1)
they are little influenced by the tissues between skin
and heart; (2) they are sensitive to tangential
currents that arise in the border zones of cardiac
tissue with different electrophysiological properties;
(3) they consider the track of electrical vortex
currents; and (4) their properties make it possible to
accurately localize intracardiac sources (Fenici,
2003).
We therefore investigated the capability of
CMFM to detect patients suffering from HCM,
including those who have a very mild phenotype or
are asymptomatic. The purpose of the study was to
develop a CMFM based diagnostic approach to
improve screening/diagnosis of HCM. We
introduced the calculation of Kullback-Leibler
entropy as a parameter to quantify the topology of
cardiac magnetic field distribution. We use the term
map topology as a synonym for the two-dimensional
distribution of cardiac magnetic field strength. Note
that this term is therefore independent from field
strength amplitudes. The mathematical method, first
described by Kullback and Leibler in 1951, provides
a value of the similarity between two probability
distributions (Kullback).
We further analyzed, whether a combination of
KL based topology quantification with regional field
strength parameters improves the discrimination
power of the automatic diagnostic algorithm.
Our study was done to address three questions:
1. Can CMFM distinguish between HCM
individuals and healthy control subjects or patients
with cardiac hypertrophy of other causes?
2. Is it possible to discriminate between the two
main phenotype subgroups of HCM; patients with
(HOCM) and without (HNCM) obstruction of the
left ventricular outflow tract?
3. How do CMFM based classification algorithms
perform, when prospectively applied for screening in
HCM families with known genetic status?
2 METHODS
2.1 Patients
Thirty three patients (HCM, n=33, 43.8 ± 13 years,
13 women, 20 men) affected by hypertrophic
cardiomyopathy were recruited from our hospital
based cardiomyopathy-outpatient center. The
diagnosis was confirmed by complex diagnostic
tests including echocardiography and magnetic
resonance imaging established on evidence-based
guidelines. HCM was diagnosed by the presence of a
non-dilated and hypertrophied left ventricle in the
absence of another cardiac or systemic disease (e.g.
hypertension or aortic stenosis) capable of producing
the magnitude of hypertrophy observed. Nineteen
patients suffered from the obstructive form and 14
patients from hypertrophic non obstructive
cardiomyopathy.
The total number of subjects in the control group
(NoHCM) was n=99. We recruited a healthy
volunteers group from an occupational health center.
The 57 healthy volunteers (age 39.6 ± 8.9 years; 35
men and 22 women) had normal findings in
BIOSIGNALS 2008 - International Conference on Bio-inspired Systems and Signal Processing
446
echocardiography, bicycle ergometry, ECG and
Holter-ECG for many years. No control subject had
a history of cardiac diseases or symptoms. Forty two
patients with essential arterial hypertension (HYP,
n=42, 49.7 ± 7.9 years, 15 women and 27 men) were
also included in this study, fulfilling the following
criteria: known hypertension on pharmacological
therapy; echocardiographicly estimated left
ventricular hypertrophy (Framingham heart study
classification FHC 1-2); no prior clinical
manifestation or angiographic documentation of
coronary artery disease; no evidence of prior
myocardial infarction. The NoHCM group consists
of both healthy volunteers and hypertensives
(together n=99) to get a more realistic control group
for familiar HCM screening.
Two families with genetically proofed HCM (ß-
MHC, α-Tropomyosin; 4 HNCM, 1 HOCM, 22
family members in total) were investigated
prospectively to check the accuracy of the MFM
screening tool.
Our internal review board approved the study
and written informed consent was obtained.
2.2 Magnetocardiographic
Measurements
The cardiac magnetic field was recorded over the
anterior chest wall using a seven channel magnetic
measurement system (Cryoton Ltd, Moscow) based
on low temperature Superconducting Quantum
Interference Device (LT-SQUID), coupled with an
axial second order gradiometer (baseline 5.5 cm,
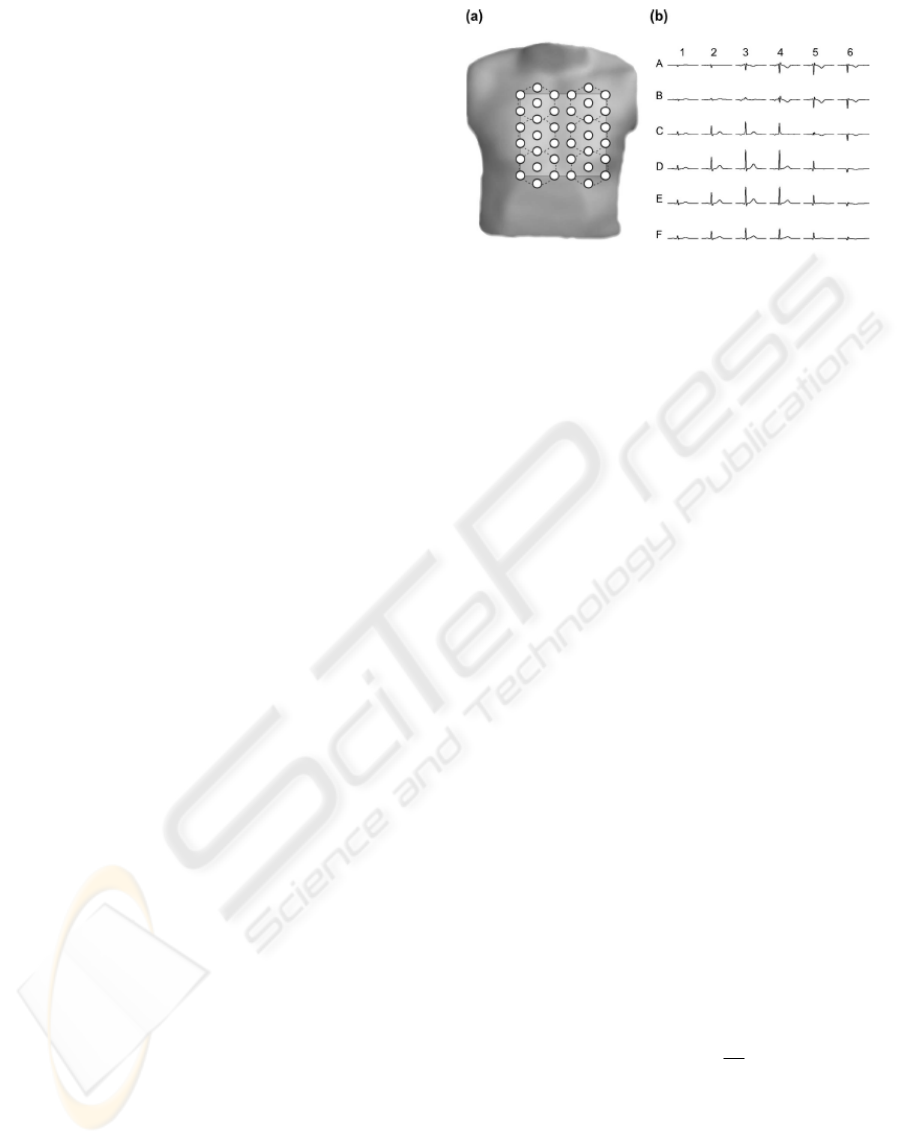
pickup coil diameter 2 cm). The component of the
magnetic field perpendicular to the chest wall was
registered in a 38 point grid (Fig. 1a). To improve
the signal to noise ratio all measurements were done
in a magnetically shielded room (VAC Akb3b) with
a shielded factor better than 10000 at 10 Hz. Typical
system performance in this environment was 7 fT in
unit band. The measurements were done sequentially
at six measurement positions (Fig. 1a) to cover a
mapping area of 20x20 cm. Recording time was 30
seconds per point with an acquisition rate of 1000
Hz and a bandwidth of 0.01 – 130 Hz. The ECG lead
II was recorded simultaneously as a time reference
signal for further processing. Thereafter, signal
averaging techniques and offset corrections were
applied. Averaged data were then transformed from
irregular measurement grid to the regular 6x6 point
grid (20 cm width and height) using thin-plate-spline
surface. Fig.1b shows averaged cardiac magnetic
Figure 1: The layout of cardiac magnetic field map
(CMFM) measurement: (a) CMFM measurement grid
based on a seven channel system. The dashed lines denote
six sequential measurement positions. (b) Cardiac
magnetic field waveforms transformed into a regular grid
(6x6) corresponding to the light grey square in panel (a).
signals for the regular grid. The strength of the
cardiac magnetic field was in the range of 10 – 100
pT (picotesla, 10-12 Tesla). The MFM amplitude
depends on the distance between measurement plane
and patient heart. To compensate this effect we
normalized magnetic field strength by the mean
absolute value during QRS averaged over 36 points
of rectangular grid.
2.3 Cardiac Magnetic Field Map
Quantification
After averaging we obtained 1000 samples for each
of the 36 measurement positions (Fig 1b), leading to
1000 different CMFM. Thus, the dimensionality of
measured data is very high and therefore, we have to
reduce it. One solution we present here is based on
the concept of Kullback-Leibler entropy to quantify
the topology of each map. Suppose that Q={Q
i
}
(i=1,..,36 – the number of measurement positions; 1:
A1, …, 6: A6, 7: B1, …, 12: B6, …36: F6 in Fig 1b)
is a given reference well-behaved probability
distribution (all Q
i
>0) and that P={P
i
} (i=1,..,36) is
some trial probability distribution. The difference of
information content of P compared to the reference
distribution Q is quantified by the Kullback-Leibler
entropy
i
i
i
i
Q
P
PP,QKL ln )(
36
1
∗=
∑
=
(1)
The Kullback-Leibler (KL) entropy can be
considered as a kind of distance between the two
probability distributions, though it is not a real
distance measure because it is not symmetric. In our
study, KL entropy was used to quantify differences
in topology between magnetic field maps of a single
subject compared with a reference maps. For each
CARDIAC MAGNETIC FIELD MAP TOPOLOGY QUANTIFIED BY KULLBACK-LEIBLER ENTROPY IDENTIFIES
PATIENTS WITH HYPERTROPHIC CARDIOMYOPATHY
447
time point, the group mean CMFMs of subjects
without HCM was used as a reference map. To
quantify topology independent from amplitudes,
each CMFM was normalized to get a probability
distribution. For maps very similar to the reference
we obtain a KL entropy value near zero, differences
in topology lead to higher KL entropy values.
For each time point between the onset of QRS
and the offset of T-wave, KL values describing
differences in topology were calculated. In order to
avoid inadequate comparisons due to interindividual
differences in QRS and STT duration, we limited the
considered time intervals to the shortest QRS and
STT lengths in the study population. To identify sub
segments with the highest differences in KL values
between compared groups, we calculated the
discriminant index (DI) for every time point as
follows: the absolute differences of mean KL values
in both groups were divided by the standard
deviation of all cases. Mean KL values during QRS
and STT subintervals with a DI value greater than
0.8 were considered as classification parameters
KLQRS(DI>0.8) and KLSTT(DI>0.8).
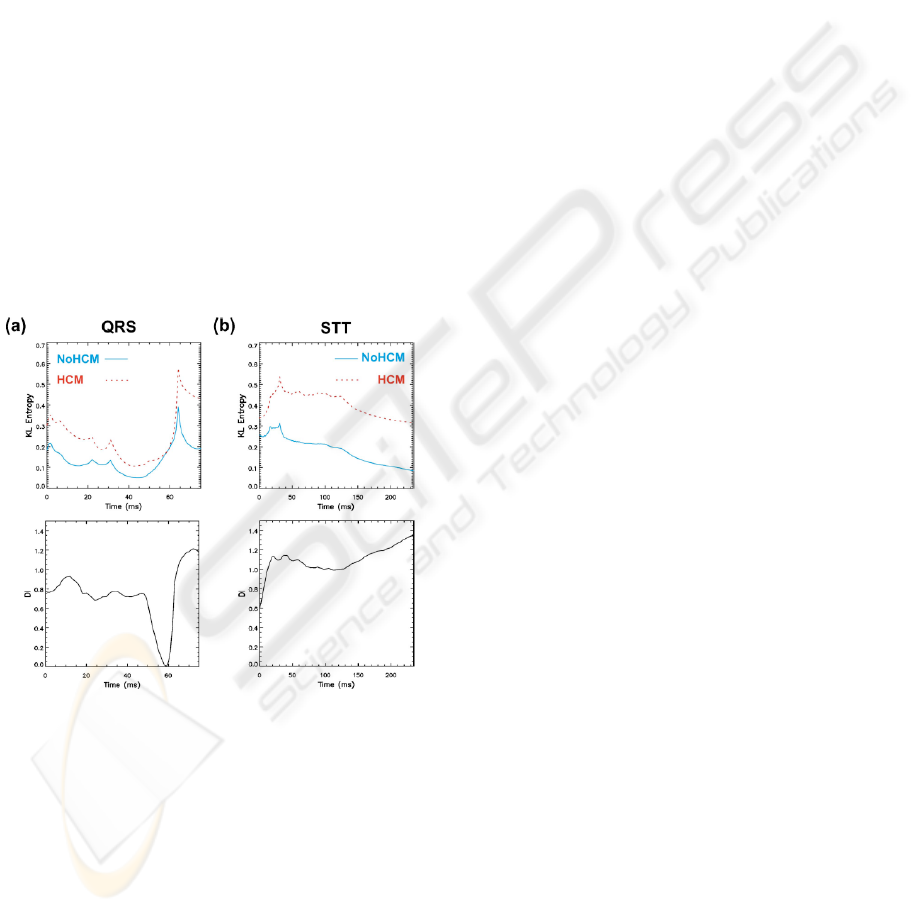
Figure 2: Mean group Kullback-Leibler (KL) entropy
values over time during QRS (a) and STT (b). NoHCM
group values are denoted with solid (blue) lines and HCM
group values with dashed (red) lines (reference maps:
NoHCM group). Lower panels give discriminant index
(DI) values during QRS (a) and STT (b) intervals
respectively: KL values for time intervals where DI was
higher than 0.8 (dashed lines) are considered for
KLQRS(DI>0.8) and KLSTT(DI>0.8) calculation.
To assess regional differences in magnetic field
strength, which cannot be captured by topology, we
calculated 36 regional parameters (QRSA1-F6, for
positions see Fig. 1b) as mean values of magnetic
field strength during QRS complex. Data processing
was performed in two steps: classification rules were
determined, firstly to discriminate between groups
with and without HCM, and secondly to
discriminate patients with different forms of HCM.
For each step classification performance was tested
for KL parameters, regional features and then for
their combinations. Finally, the best set of predictors
was prospectively applied to identify members of
HCM families affected by the disease.
3 RESULTS
Discrimination of HCM Individuals from Healthy
Control Subjects and Patients with Cardiac
Hypertrophy of other Causes (NoHCM). The
mean KL values of the HCM and NoHCM groups
during QRS and STT interval are given in Fig. 2
(upper panels), with the corresponding DI values in
the lower panels. Only the beginning and parts of the
second half of the QRS are discriminating (DI>0.8)
for these groups, whereas for STT almost the whole
segment is distinctive. These subintervals were used
to calculate KLQRS(DI>0.8) and KLSTT(DI>0.8).
Mean values of these parameters differed
significantly between the two groups (Tab. 1). LDA
based on these two features yielded a sensitivity of
78.8 % and specificity of 86.9 % (Tab. 1) with an
overall correct classification rate of 84.8 %. Next,
we estimated discrimination power of regional
parameters based on mean values of magnetic field
strength in each grid position. Forward stepwise
discriminant analysis was performed to select the
best two feature set: QRSB3 and QRSF3. QRSB3
was positive in the NoHCM and negative in the
HCM group (Tab. 1, p < 10-8). For QRSF3 mean
values of both groups were comparable and not
significantly different. However, this parameter was
automatically selected by LDA because it provides
orthogonal information to QRSB3 to separate both
groups. The overall classification rate based on these
two regional parameters was lower than with KL
based: The specificity of 85.9 % was comparable
with KL features but the sensitivity of 66.7 %
(cross-validated only 63.6 %) was substantially
lower (Tab. 1).
BIOSIGNALS 2008 - International Conference on Bio-inspired Systems and Signal Processing
448
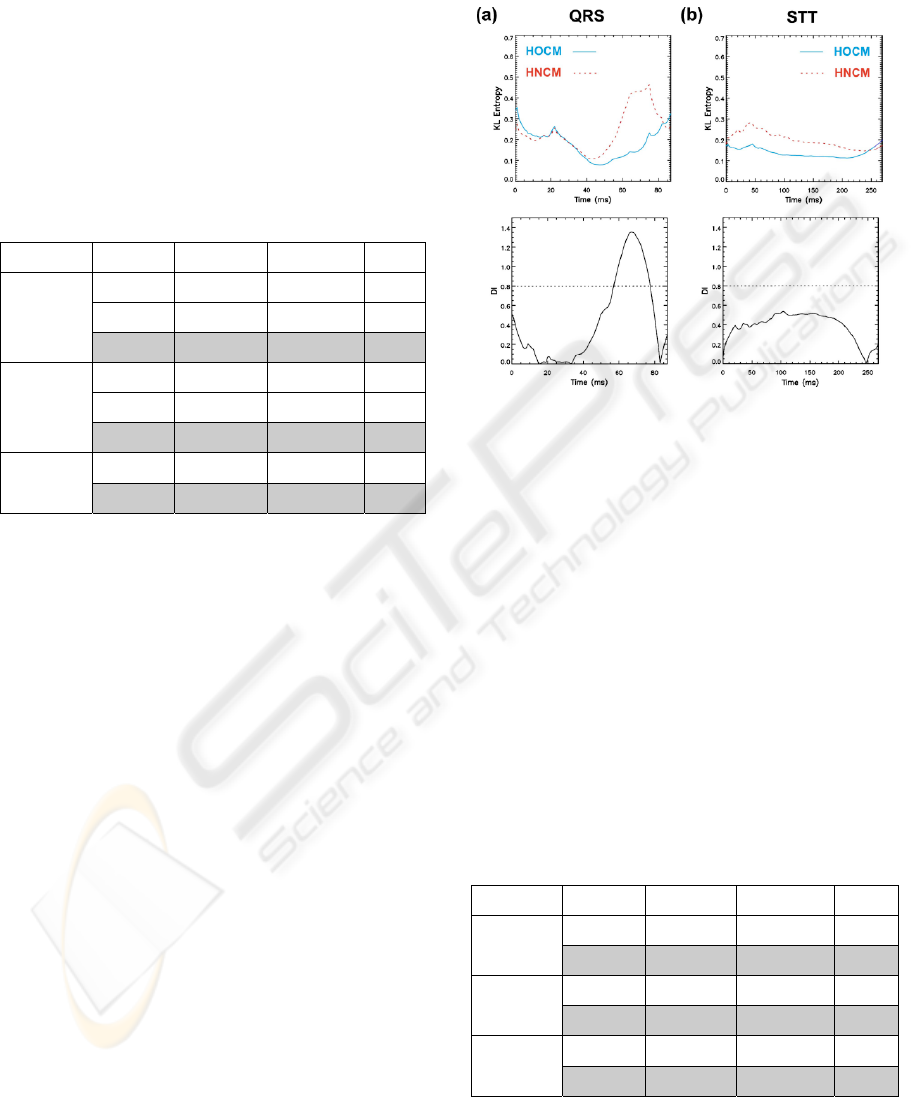
Table 1: Descriptive statistics of patient groups without
HCM (NoHCM) and with HCM as well as their
separability. Data are given as mean values ± SE and
percentage of correctly classified (CC) cases. If ‘leave one
out’ crossvalidated results of discriminant function
analysis differ from the original results, they are shown in
parentheses. P-values were obtained with the Mann-
Whitney-U-test (univariate cases) and the Wilks-Lambda
test (linear discriminant function). Three classification
approaches were used: (a) KL: based on Kullback-Leibler
entropy mean values for QRS and STT time intervals
where discriminant index (DI) was higher than 0.8, (b)
Regional: based on selected regional parameters, (c)
KL+Regional: based on selected KL and regional
parameters.
NoHCM HCM P - value
KL
QRS(DI>0.8)
0.14 ± 0.007 0.27 ± 0.019 4.8*10
-10
KL
STT(DI>0.8)
0.11 ± 0.015 0.33 ± 0.03 1.1*10
-10
KL
CC 86.9 % 78.8 % 3.9*10
-17
QRS
B3
0.45 ± 0.07 -0.59 ± 0.14 7.8*10
-9
QRS
F3
0.7 ± 0.05 0.68 ± 0.12 0.34
Regional
CC 85.9 % 66.7 % (63.6 %) 6.2*10
-12
QRS
A6
* -0.46 ± 0.02 -0.37 ± 0.06 0.44
KL+Regional
CC 88.9 % 84.8 % 6.9*10
-19
As a last step, we combined KL and regional
features and applied forward stepwise LDA to find
the best set of three parameters. This set included the
KL parameters KLQRS(DI>0.8), KLSTT(DI>0.8)
and the regional parameter QRSA6. The mean
values of the latter parameter again did not
significantly differ between both groups, but the
combination of these three parameters improved the
overall classification rate from 84.8 % to 87.9 %
(sensitivity: 84.8 %, specificity: 88.9 %, area under
ROC curve: 0.94). The correct classification rates
for the subgroups included were 98.2 % in normal
subjects, 76.2 % in hypertensive patients, 85.7 % in
patients with HNCM and 84.2 % in patients with
HOCM.
Discrimination of Obstructive from non
Obstructive Forms of HCM. For this analysis, KL
entropy was calculated using the averaged maps of
the HOCM group as the reference. The mean KL
values of HOCM and HNCM groups during QRS
and STT interval are given in Fig. 3 (upper panels),
with the corresponding DI values in the lower
panels. Obviously, the only informative part to
separate HOCM from HNCM is the time interval
between 57 and 77 ms of the QRS (DI>0.8). Mean
values of KLQRS(DI>0.8) differed significantly
(p<10
-4
) between both groups (Tab. 2). Using only
this parameter, 78.8 % of patients were correctly
classified (78.9 % from HOCM group and 78.6 %
from HNCM group).
Figure 3: Mean group Kullback-Leibler (KL) entropy
values over time during QRS (a) and STT (b). HOCM
group values are denoted with solid (blue) lines and
HNCM group values with dashed (red) lines (reference
maps: HOCM group). Lower panels give discriminant
index (DI) values during QRS (a) and STT (b) intervals
respectively: KL values for time intervals where DI was
higher than 0.8 (dashed lines) are considered for
KLQRS(DI>0.8) calculation.
Table 2: Descriptive statistics of patients with HNCM and
HOCM as well as their separability. Data are given as
mean values ± SE and percentage of correctly classified
(CC) cases. If ‘leave one out’ cross-validated results of
discriminant function analysis differ from the original
results, they are shown in parentheses. P-values were
obtained with the Mann-Whitney-U-test (univariate cases)
and the Wilks-Lambda test (linear discriminant function).
Three classification approaches were used: (a) KL: based
on Kullback-Leibler entropy mean values for QRS where
discriminant index (DI) was higher than 0.8, (b) Regional:
based on selected regional parameters, (c) KL+Regional:
based on selected KL and regional parameters.
HNCM HOCM P - value
KL
QRS(DI>0.8)
0. 4 ± 0.04 0.16 ± 0.03 5.1*10
-5
KL
CC 78.6 % 78.9 % 3.8*10
-5
QRS
F5
0.67 ± 0.28 2.26 ± 0.34 2*10
-3
Regional
CC 71.4 % 63.2 % 1*10
-3
QRS
A3
* -0.73 ± 0.3 -1.31 ± 0.3 0.08
KL+Regional
CC 100 % (92.9 %) 94.7 % (89.5 %) 1.5*10
-7
Next, we estimated discrimination power of regional
parameters, which were calculated for the same time
CARDIAC MAGNETIC FIELD MAP TOPOLOGY QUANTIFIED BY KULLBACK-LEIBLER ENTROPY IDENTIFIES
PATIENTS WITH HYPERTROPHIC CARDIOMYOPATHY
449

interval (57-77 ms of QRS). Forward stepwise
discriminant analysis found QRSF5 to be the best
discriminating parameter (Tab. 2). Overall
classification rate using QRSF5 was 66.7 % (63.2 %
patients from the HOCM group and 71.4 % from the
HNCM group were correctly classified). Again,
regional parameters demonstrated a lower
classification power.
As the last step, we combined KL and regional
parameters and performed a forward stepwise LDA.
KLQRS(DI>0.8) and QRSA3 were selected. Overall
classification rate for this parameter set was 97 %
(94.7 % of HOCM and 100 % of HNCM patients
were correctly classified, area under ROC curve:
0.97).
Prospective Screening of Two HCM Families.
Application of the two classification algorithms
based on the selected sets of combined KL and
regional features yielded a correct classification of
all 22 family members. This was true not only for
detection of HCM affected individuals (5 out of 22
family members), but also for discrimination
between different forms of the disease (1 HOCM vs.
4 HNCM).
4 CONCLUSIONS
This study investigated the capability of CMFM to
detect patients affected by HCM. The most
important findings are, that a KL based topology
quantification of cardiac magnetic field distribution
discriminates HCM from non HCM and
distinguishes between different forms of HCM
(HOCM and HNCM), and that a combination with
regional field strength parameters improves the
discrimination results to a level relevant for clinical
application.
Discrimination of HCM Individuals from Healthy
Control Subjects and Patients with Cardiac
Hypertrophy of other Causes (NoHCM). Both the
large variability of the disease expression and the
resulting complexity of the CMFM raise difficulties
for the magnetophysiologic diagnostic evaluation of
HCM. The present paper proposes a new
diagnostical approach based on CMFM. Different
analysis techniques are currently used for evaluation
of cardiac magnetic field maps. This includes for
example the estimation of changes in magnetic field
orientation through the cardiac cycle and the
calculation of QRS-ST-T wave integrals (Van
Leeuwen, 2006). We applied for the first time the
methodology of Kullback-Leibler entropy for
analysis of CMFM to investigate the diagnostic
information content in topology related to the status
“HCM affected or not”. As we could show, KL
values increase with the deviation of map topology
compared to the reference field distribution. The
idea to use relative entropy measures to classify
medical data had already successfully been applied
to EEG, HRV and MRI-analyses. Using the KL
approach, we found significant differences in map
topology during QRS and STT interval between
HCM patients and the mixed control group of
healthy volunteers and hypertensives. For the
process of depolarization the most significant
differences were found during the early part (5-20
ms) and within the second half (62-75 ms) of this
time period. In contrast, the same was true for nearly
the whole repolarization period (STT interval) with
marked map topology deviations of the HCM group,
revealed by the discriminant index. The analysis of
the CMFM using two parameters based on the
Kullback-Leibler entropy measures correctly
classified 84.8 % of the tested groups. As the control
group contained also patients with cardiac
hypertrophy due to arterial hypertension, our results
strongly suggest that Kullback-Leibler based map
quantification revealed specific topological features
in HCM patients. They may originate from the
pathognomonic ventricular remodeling process,
which includes myocardial disarray, left ventricular
hypertrophy (LV) and fibrosis. Typically, the LV
hypertrophy shows asymmetric distribution with
diffuse or segmental pattern of left ventricular wall
thickening, most involving the septal region
(Saumarez, 1992). This is accompanied by changes
in the electrical properties especially at the initial
and the last part of QRS, both due to a loss of
electrical forces because of transmural myocardial
fibrosis and abnormal electrical activation of
hypertrophied ventricular septum (Dumont, 2006).
Echocardiographic and MRI studies showed that the
balance of these electrical forces is primarily a
function of the relation of upper anterior septal
thickness to right ventricular wall thickness and to
upper left ventricular posterior wall thickness. In a
non-invasive electrocardiographic imaging study of
ventricular activation, Ramanathan et al. (2006)
demonstrated an epicardial right ventricular
breakthrough in the anterior paraseptal region during
the earliest ventricular activation under
physiological conditions in healthy volunteers. At
the end of the ventricular activation sequence, an
apex-to-base activation of the posterior left ventricle
was displayed. Based on this description of the
BIOSIGNALS 2008 - International Conference on Bio-inspired Systems and Signal Processing
450

ventricular activation sequence, our findings suggest
that within the first 20 ms of the ventricular
activation paraseptal parts of the right ventricle
could contribute to the observed differences in
CMFM topology. In contrast, the map topology
differences at the end of the QRS could reflect the
influence of regional LV wall hypertrophy and
myocardial fibrosis on the electrophysiological
myocardial properties, especially if the propagation
wave front turns from apical to posterior basal LV.
These findings are consistent with those from
invasive electrophysiological and morphological LV
studies (Schumacher, 2005). Myocardial scarring
and its electrophysiological consequences like
slowed and fragmented intraventricular conduction
also contributed to the specific magneto-
physiological HCM phenotype.
Changes in repolarization in HCM patients were
also found in ECG studies (Barletta, 2005). The
most common abnormalities are related to the ST-
segment and the T-wave. This is in consistence with
our findings of differences in KL entropy values at
the STT interval. They probably emanate from
myocardial disarray, fibrosis and small vessel
disease leading to scarred myocardium due to
regional ischemia (Basso, 2000). HCM does not
affect the ventricles uniformly; it is likely that there
are areas of diseased myocardium with
abnormalities in conduction and refractoriness and
heterogeneity of refractoriness, especially related to
distal hypertrophy with craniocaudal asymmetry.
Compared with KL measurements, we also
found significant regional deviations of magnetic
field strengths during depolarization period (QRS),
especially in the superior (sensor position B3) and
inferior (sensor position F3) part of the mapped area.
However, the overall classification rate using only
these parameters was lower compared to the KL
based set. Specificity was comparable with KL
method but sensitivity was substantially lower. A
possible explanation for the lower classification rate
could be that regional parameters are more sensitive
to measurement conditions, especially to the position
of the patient’s heart relative to the measurement
system. Even with a presumed constant distance
between sensors and thorax surface, the variations in
patients’ anatomy result in different heart-sensor
distances. Automatic adjustments to solve this
problem are under investigation (Burghoff, 2000).
In contrast to the lower efficacy of the mean
values of magnetic field strength approach, the
classification rate improved adding a regional
parameter to the KL features. Since the
crossvalidation did not differ from the original
results the improvement in classification is due to a
higher information content of the combined
parameter set.
Discrimination of Obstructive from non
Obstructive Forms of HCM. In order to find a
discriminant function for separation of HCM
subforms (HOCM vs. HNCM), we applied the same
approach but now using the HOCM group maps as
the reference for KL entropy calculation. As shown
by high DI values, KL based topology differed only
in a short time interval within the second part of
depolarization process (57-77ms). The analysis of
regional magnetic field differences revealed that
most significant differences between these two
HCM subforms exist in the inferior part of the
mapped area (sensor position F5). HOCM is
characterized by a predominantly septal
hypertrophy, which leads to chronic obstruction of
the left ventricular outflow tract and consecutively to
an increase in wall stress, myocardial ischemia,
increased cell death and fibrosis.
Using gadolinium contrast-enhanced MRI,
Choudhury et al. found in asymptomatic or mildly
symptomatic patients with HCM that the extent of
scar increased significantly in relation to wall
thickness on a regional basis. The
electrophysiological consequences are regional
prolongation of the bipolar endocardial potentials
and the occurrence of fractionated and split
potentials, which directly point to an underlying
inhomogeneity of the myocardial excitation with a
shift to earlier activation of the lateral LV wall due
to septal conduction delay. This probably led to the
observed deviation in CMFM map topology between
HOCM and HNCM patients in the second part of the
QRS interval, which could be quantified by using
the KL entropy method. The alterations of regional
electrophysiological properties at hypertrophic
septal areas are responsible for the observed changes
in the inferior mapped area.
Intended to detect HCM subforms, KL entropy
measures were superior to the analysis of regional
map differences. But, adding a regional parameter
QRSA3 to KL entropy parameters, the classification
result improved to 97 % with a sensitivity of 100 %
for HNCM and a specificity of 94.7 % for HOCM.
Feasibility of the Approach and Conclusions. The
correct classification of 5 HOCM and HNCM
patients out of 22 family members, in which the
diagnosis was confirmed by genetic testing, showed
in a prospective part of the study the feasibility of
the presented diagnostic algorithm. Our results give
CARDIAC MAGNETIC FIELD MAP TOPOLOGY QUANTIFIED BY KULLBACK-LEIBLER ENTROPY IDENTIFIES
PATIENTS WITH HYPERTROPHIC CARDIOMYOPATHY
451

evidence, that KL entropy as a natural distance
measure between two probability distributions is an
effective tool to obtain discrimination information
from CMFM measurements. It is important to point
out that the KL tool is applicable to CMFM analysis
in a population characterized by a broad spectrum of
magnetophysiological and clinical phenotype
expression. Prospective screening of HCM family
members is strongly recommended, including serial
echocardiographic and electrocardiographic
examinations (Maron, 2004).
In conclusion, a combined diagnostic algorithm
based on KL entropy topology quantification and
regional parameters of cardiac magnetic field maps
is a suitable tool for HCM screening and
discrimination between different forms of the
disease.
REFERENCES
Barletta, G., Lazzeri, C., Franchi, F. et al. 2004,
Hypertrophic cardiomyopathy: electrical abnormalities
detected by the extended-length ECG and their
relation to syncope. Int J Cardiol 97 (1): 43-8
Basso, C., Thiene, G., Corrado, D. et al. 2000,
Hypertrophic cardiomyopathy and sudden death in the
young: pathologic evidence of myocardial ischemia.
Hum Pathol 31 (8): 988-98
Burghoff, M., Nenonen, J., Trahms, L. Katila T. 2000,
Conversion of magnetocardiographic recordings
between two different multichannel SQUID devices.
IEEE Trans Biomed Eng 47 (7): 869-75
Dumont, C. A., Monserrat, L., Soler, R., et al. 2006,
Interpretation of electrocardiographic abnormalities in
hypertrophic cardiomyopathy with cardiac magnetic
resonance. Eur Heart J 27 (14): 1725-31
Fananapazir, L., Tracy, C. M., Leon, M. B. et al. 1989,
Electrophysiologic abnormalities in patients with
hypertrophic cardiomyopathy. A consecutive analysis
in 155 patients. Circulation 80 (5): 1259-68
Fenici, R. , Brisinda, D., Nenonen J., Fenici P. 2003,
Phantom validation of multichannel
magnetocardiography source localization. Pacing Clin
Electrophysiol 26 (1 Pt 2): 426-30
Kullback S., Leibler R. A. 1951, On information and
sufficiency. Ann Math Stat 22 (1): 79-86
Maron B. J. 1990, Q waves in hypertrophic
cardiomyopathy: a reassessment. J Am Coll Cardiol
16 (2): 375-6
Maron, B. J., McKenna, W. J., Danielson, G. K. et al.
2003, Task Force on Clinical Expert Consensus
Documents and the European Society of Cardiology
Committee for Practice Guidelines. J Am Coll Cardiol
42 (9): 1687-713
Maron, B. J., Seidman J. G., Seidman C. E. 2004. Proposal
for contemporary screening strategies in families with
hypertrophic cardiomyopathy. J Am Coll Cardiol 44
(11): 2125-32
Ramanathan, C., Jia, P., Ghanem, R. et al. 2006,
Activation and repolarization of the normal human
heart under complete physiological conditions. Proc
Natl Acad Sci U S A 103 (16): 6309-14
Saumarez, R. C., Camm, A. J. , Panagos, A.. et al. 1992,
Ventricular fibrillation in hypertrophic
cardiomyopathy is associated with increased
fractionation of paced right ventricular electrograms.
Circulation 86 (2): 467-74
Schumacher, B., Gietzen, F. H., Neuser, H. et al. 2005,
Electrophysiological characteristics of septal
hypertrophy in patients with hypertrophic obstructive
cardiomyopathy and moderate to severe symptoms.
Circulation 112 (14): 2096-101
Seidman C. E. and Seidman J. G. 1998 Molecular genetic
studies of familial hypertrophic cardiomyopathy. Basic
Res Cardiol 93 Suppl 3 13-6
Spirito, P., Chiarella, F., Carratino, L. et al. 1989, Clinical
course and prognosis of hypertrophic cardiomyopathy
in an outpatient population. N Engl J Med 320 (12):
749-55
Thierfelder, L. , Watkins, H., MacRae, C. et al. 1994
Alpha-tropomyosin and cardiac troponin T mutations
cause familial hypertrophic cardiomyopathy: a disease
of the sarcomere. Cell 77 (5): 701-12
Van Leeuwen, P., Hailer, B., Lange S., Gronemeyer , D.
H. 2006, Identification of patients with coronary
artery disease using magnetocardiographic signal
analysis. Biomed Tech (Berl) 51 (2): 83-8
BIOSIGNALS 2008 - International Conference on Bio-inspired Systems and Signal Processing
452
