
COMPARATIVE STUDY OF BLIND SOURCE SEPARATION
METHODS FOR RAMAN SPECTRA
Application on Numerical Dewaxing of Cutaneous Biopsies
Valeriu Vrabie
†
, Cyril Gobinet
‡
, Michel Herbin
†
and Michel Manfait
‡
†
CReSTIC, Universit´e de Reims Champagne-Ardenne, Chauss´ee du Port, 51000 Chˆalons-en-Champagne, France
‡
M´eDIAN, CNRS UMR 6142, Universit´e de Reims Champagne-Ardenne, 51 rue Cognacq Jay, 51096 Reims, France
Keywords:
Raman Spectroscopy, Paraffin-Embedded Cutaneous Biopsies, Blind Source Separation, Independent Com-
ponent Analysis, Non-negative Matrix Factorization, Maximum Likelihood Positive Source Separation.
Abstract:
Raman spectroscopy is a powerful tool for the study of molecular composition of biological samples. Digital
processing techniques are needed to separate the wealthy but complex information recorded by Raman spec-
tra. Blind source separation methods can be used to efficiently extract the spectra of chemical constituents.
We propose in this study to analyze the performances of four blind source separation methods. Two Inde-
pendent Component Analysis methods using the JADE and FastICA algorithms are based uniquely on the
independence of the spectra. The Non-Negative Matrix Factorization takes into account only the positivity of
underlying spectra and mixing coefficients. The Maximum Likelihood Positive Source Separation assumes
both the independence and positivity of the spectra. A realistic simulated dataset allows a quantitative study of
these methods while a real dataset recorded on a paraffin-embedded skin biopsy provides a qualitative study.
1 INTRODUCTION
Raman spectroscopy is a light scattering technique
used in numerous biomedical applications (Choo-
Smith et al., 2002). For example, it was success-
fully used in oncology to discriminate between ma-
lignant and benign tumors (Haka et al., 2002; Gni-
adecka et al., 2004). Recording the Raman scattering
of a laser on a biopsy, the Raman spectroscopy gives
information about the vibrational modes of the ana-
lyzed sample. Based on the uniqueness of Raman sig-
natures of each molecular constituent, this technique
extracts wealthy but complex information about the
molecular composition of biopsies.
To be studied in optimal and reproducible condi-
tions by Raman spectroscopy, thin sections of biop-
sies are required. A conservative property of these
biopsies is also needed for their storage in tissue
banks (tumor banks in oncology) for further analysis.
To satisfy these requirements, the biopsies are fixed
by formalin and embedded into paraffin. However,
the paraffin has a Raman signature made up of ener-
getic peaks that strongly overlap the signature of the
biopsy. Visual analysis of Raman bands (shape, wave-
length localization, etc.) or classical signal process-
ing methods such as Principal Component Analysis
(Haka et al., 2002) will be biased for a signature ex-
traction objective. A solution is to chemically dewax
and rehydrate the biopsies before analyzing them by
Raman spectroscopy. Nevertheless, this process has
several drawbacks such as: it is time and reagent con-
suming, the biopsies are altered and a residual layer
of paraffin may remain (Faol´ain et al., 2005).
To overcome these problems, an advanced signal pro-
cessing method based on Independent Component
Analysis (ICA) was recently proposed (Vrabie et al.,
2007). This method has been shown efficient to model
the recorded spectra as a linear mixing of independent
Raman spectra, allowing to extract the signatures of
the paraffin and, thus, to numerically dewax the biop-
sies. It also allows to extract the spectrum of the un-
derlying biopsy (human skin) and therefore to define
molecular descriptors specific to melanomas and nevi.
However, the extraction of Raman spectra is not per-
fect because some residual paraffin peaks remain on
estimated spectra. This might be a consequence of es-
timated negative peaks, as this method does not take
into account the positivity of the spectra and associ-
349
Vrabie V., Gobinet C., Herbin M. and Manfait M. (2008).
COMPARATIVE STUDY OF BLIND SOURCE SEPARATION METHODS FOR RAMAN SPECTRA - Application on Numerical Dewaxing of Cutaneous
Biopsies.
In Proceedings of the First International Conference on Bio-inspired Systems and Signal Processing, pages 349-354
DOI: 10.5220/0001064903490354
Copyright
c
SciTePress

ated mixing coefficients.
In this paper we propose a comparative study of
four methods of blind source separation for numerical
dewaxing of paraffin-embedded skin biopsies. The
first one employs the Joint Approximate Diagonaliza-
tion of Eigenmatrices (JADE) algorithm (Cardoso and
Souloumiac, 1993). The second one, named FastICA
(Hyv¨arinen et al., 2001), uses a fast fixed-point algo-
rithm. It is employed here in its deflation scheme in
which the spectra are estimated one by one. These
two methods are ICA-based methods that only as-
sume the independence of the spectra to be estimated.
Next, we consider the Non-Negative Matrix Factor-
ization (NMF) which takes into account only the pos-
itivity of underlying spectra and mixing coefficients
(Lee and Seung, 1999). Finally, the Maximum Like-
lihood Positive Source Separation (MLPSS) assumes
both the independence and positivity of the spectra to
be estimated and was developed for the blind separa-
tion of Raman spectra (Moussaoui, 2005). A quantita-
tive study is proposed by considering the results given
by these methods on a realistic simulated dataset,
while a qualitative study is illustrated on a dataset
recorded on a paraffin-embedded skin biopsy.
2 RAMAN SPECTRA
The Raman spectrum R
k
is defined as a N
ν
di-
mensional vector made up by the Raman intensities
recorded at different wavenumbers into a measure-
ment point k. By scanning K points of a sample,
the Raman spectroscopy provides a matrix dataset
R = [... , R
k
, ...] ∈ R
K×N
ν
.
The recorded dataset R can be modeled as a lin-
ear sum of spectra S
i
∈ R
N
ν
of chemical constituents,
called also sources, weighted by the corresponding
mixing coefficients A
i
∈ R
K
, called also concentra-
tion profiles (Vrabie et al., 2007):
R =
M
∑
i=1
A
i
S
T
i
+ N
1
+ N
2
. (1)
The noise N
1
describes a part of the noise that is made
up by sources related to useless chemical constituents
that might be present in acquisition or by a linear ad-
ditive recorded noise. The noise N
2
denotes a non-
linear additive noise (i.e. not having a linear behavior
from a spectrum to another) made up principally by
slow-varying parasitic fluorescence. Since they are
generated by unrelated phenomena, the noise N
1
is
supposed decorrelated from the interesting spectra S
i
.
Note that the spectra of the chemical constituents and
the mixing coefficients admit only positive values by
definition.
This model does not take into account the deform-
ing effects that might appear in real acquisitions such
as the spectral shifts or width variations of the Raman
peaks. These deforming effects and the noise N
2
can
be removed from the recorded spectra by preprocess-
ing techniques (Gobinet et al., 2007). We note there-
after with R
sig
= R − N
2
the subspace of dimension
P obtained after the preprocessing, which is made up
by the interesting spectra and the linear noise N
1
.
For paraffin-embedded biopsies, the value of M
can be usually fixed at 5 for cases where the Ra-
man signature of the fixation slide (as for example
CaF
2
slide) is owing to the recorded spectral range
or at 4 otherwise. Moreover, it was proved that
the paraffin is completely described by three sources
S
1
,S
2
,S
3
having non-overlapping thin peaks (Vrabie
et al., 2007). These sources being modeled as sparse
and non-Gaussian, all higher-order cross cumulants of
the M sources considered in (1) vanish, assuring the
independence of these sources.
Retrieving the spectra of the chemical constituents
can be thus formulated as a source separation problem
based on the assumption that these sources are posi-
tive and independent.
3 BSS METHODS
Blind source separation (BSS) consists in recovering
unobserved sources S
i
from several observed mix-
tures R with no a priori information about the mix-
ing coefficients A
i
. The lack of a priori knowledge
about the mixture is compensated by physically plau-
sible assumption on the sources such as decorrelation,
independence and/or positivity. A review of the BSS
approaches can be found in (Cardoso, 1998).
BSS methods usually suppose that the number of
sources is smaller than the number of observed mix-
tures and that the dataset is noise-free. Generally, the
number of recorded spectra (i.e. K in our case) be-
ing at least one hundred spectra, the first assumption
holds. The second one is not respected by the sub-
space R
sig
since the noise N
1
remains after the pre-
processing. Based on the assumption that this noise
is decorrelated from the interesting spectra, it can be
estimated and removed by decomposing the subspace
R
sig
in two orthogonal subspaces by the use of the
Singular Value Decomposition (Vrabie et al., 2007):
R
sig
=
M
∑
j=1
δ
j
U
j
e
S
T
j
+
P
∑
j=M+1
δ
j
U
j
e
S
T
j
, (2)
Note that this decomposition can be linked with the
well known Principal Component Analysis (PCA).
The second subspace is an estimate of the noise
BIOSIGNALS 2008 - International Conference on Bio-inspired Systems and Signal Processing
350

N
1
. The first subspace is constructed by decorrelated
spectra
e
S
j
, which are still a linear mixing of inter-
esting spectra, and fit the BSS model. The spectra
of paraffin being modeled by independent sources,
stronger criteria than decorrelation must be used to
extract them. Note that this decomposition may intro-
duce negative values in the first subspace, especially
when the recorded intensities are weak, which is not
usually the case in Raman spectroscopy. In these
cases, the above subspace reduction can be replaced
by a random projection of the dataset R
sig
into a pos-
itive matrix having M lines (Moussaoui, 2005).
3.1 ICA
The Independent Component Analysis (ICA) is a
computational technique for the BSS problem based
on the only assumption that the sources are mutu-
ally independent and at most one is Gaussian. A de-
tailed description can be found in (Hyv¨arinen et al.,
2001). We focus here only on two ICA algorithms:
JADE (Cardoso and Souloumiac, 1993) and FastICA
(Hyv¨arinen et al., 2001).
ICA has two indeterminacies: the energies (vari-
ances) and the order of the independent components
(estimated spectra) cannot be determined. The first
ambiguity is avoided by estimating independent com-
ponents of unit variances. This is not a restriction
for this kind of application since we are interested to
identify the spectrum of the biopsy in order to find
molecular descriptors. Moreover, the ambiguity of
the sign of the estimated spectra is not avoided, but
this is insignificant since the sign can be found in the
mixing coefficients. For these reasons and to simplify
the theory and the algorithms, the dataset R
sig
is cen-
tered by subtracting the mean of each spectrum. Each
observation is also normalized to unit variance, ensur-
ing that even weak-amplitude recorded observations
are well represented within the input data.
3.1.1 JADE Algorithm
The 4
th
order cross-cumulants of the decorrelated
sources
e
S
j
given by PCA in Eq. (2) are firstly com-
puted. A M × M × M × M dimensional tensor is ob-
tained, which must be diagonalized in order to find
independent sources. The Joint Approximate Diago-
nalization of Eigenmatrices (JADE) algorithm (Car-
doso and Souloumiac, 1993) uses the joint diagonal-
ization of cumulant matrices obtained by unfolding
the obtained 4
th
order tensor. This step provides a
M × M rotation matrix B that is used to find indepen-
dent sources
b
S
i
by multiplying the matrix made up by
the decorrelated sources
e
S
j
with this matrix B. The
b
S
i
’s are centered and normalized estimators of the in-
teresting spectra S
i
.
3.1.2 FastICA
The FastICA algorithm is based on a fixed-point iter-
ation scheme for finding directions in which the ne-
gentropy is maximized. Beyond the very fast conver-
gence of this algorithm (at least quadratic), the algo-
rithm finds directly independent components of (prac-
tically) any non-Gaussian distribution using a nonlin-
earity g, so no estimate of the probability distribution
function has to be first available. The nonlinearity can
optimize the performance of the method allowing to
obtain algorithms that are robust and/or of minimum
variance. Moreover, the independent components can
be estimated one by one, which is equivalent to a pro-
jection pursuit. A detailed description of this algo-
rithm can be found in (Hyv¨arinen et al., 2001).
This algorithm was employed here in its defla-
tion scheme. The algorithm iteratively finds direc-
tions in which the estimated independent components
are maximally nongaussian. This technique is appro-
priate to initially estimate the spectra of the paraffin
S
1
,S
2
,S
3
. The spectrum of the biopsy is hence ob-
tained by deflation as the remaining source.
3.2 NMF
Broadly speaking, the Non-Negative Matrix Factor-
ization (NMF) factorizes a matrix made up of non-
negative values in two other matrices composed of
non-negative values, which multiplied will approxi-
mately equalize the original result (Lee and Seung,
1999). The factorization algorithms are based on iter-
ative updates which minimize a criterion such as the
least squares error or generalized Kullback-Leibler di-
vergence. These algorithms can only be guaranteed to
find local minima, rather than a global minimum, and
the obtained results depend on the initialization.
The NMF using a least squares error algorithm
was used here in order to test if it is possible to find
positivespectra S
i
and mixing coefficients A
i
from the
dataset R
sig
without further a priori information.
3.3 MLPSS
The Maximum Likelihood Positive Source Separation
(MLPSS) assumes both the independence and posi-
tivity of the spectra to be estimated and has been de-
veloped especially for the blind separation of Raman
spectra (Moussaoui, 2005). It models the positive in-
dependent spectra to be estimated by gamma prob-
ability density functions (pdf) with an α parameter
COMPARATIVE STUDY OF BLIND SOURCE SEPARATION METHODS FOR RAMAN SPECTRA - Application on
Numerical Dewaxing of Cutaneous Biopsies
351
greater than one. This model is well adapted to spec-
tra of the paraffin S
1
,S
2
,S
3
.
To solve this problem, two algorithms were pro-
posed. The first one is based on the maximization of
the likelihood by using a Monte-Carlo Expectation-
Maximization scheme, while the second one com-
bines the above assumptions and the maximum like-
lihood technique to derive a steepest gradient algo-
rithm. This last algorithm was used here because it is
faster and it is well adapted for cases where the noise
is small, which is the case of large acquisitions after
the noise removal by PCA.
3.4 Application
A quantitative study on a realistic simulated dataset is
firstly presented followed by a qualitative study on a
dataset recorded on a paraffin-embedded skin biopsy.
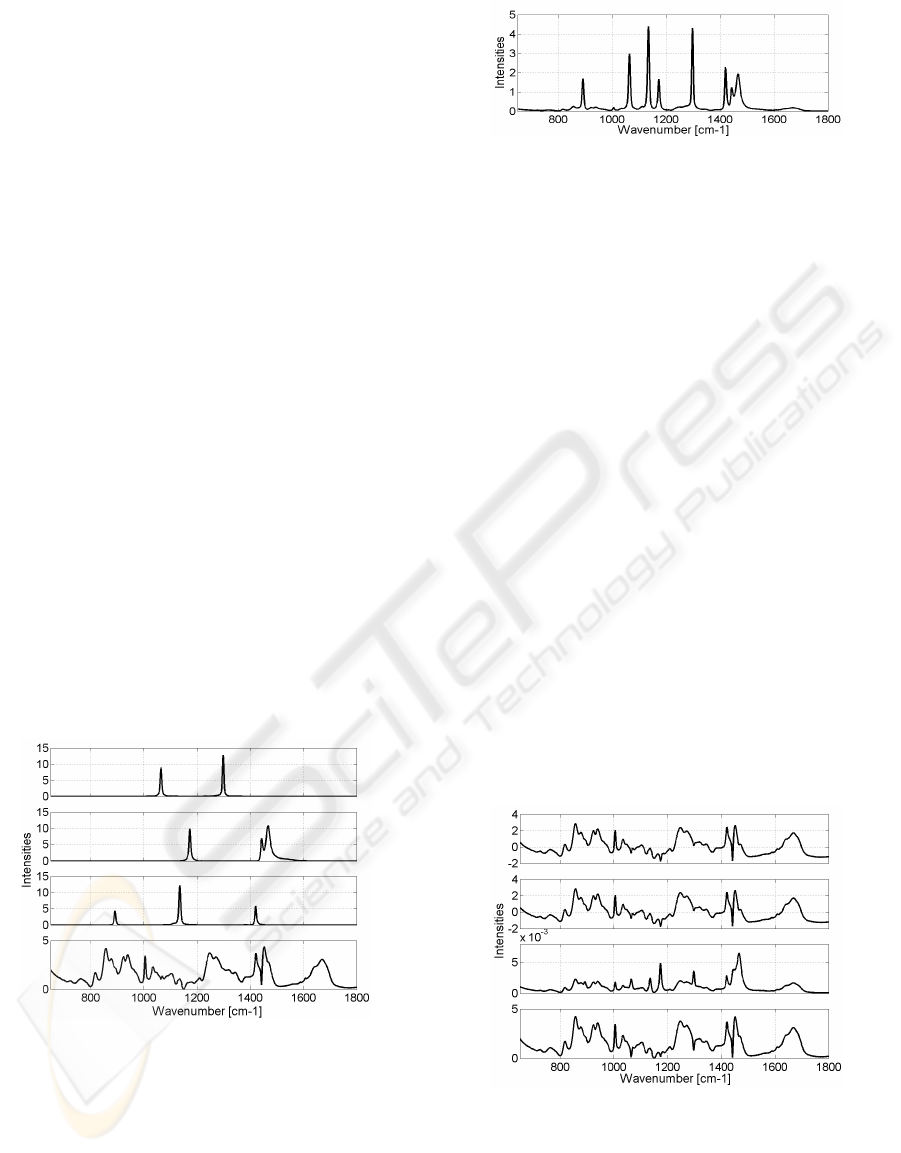
3.4.1 Simulated Dataset
We consider here four spectra S
1
,...,S
4
∈ R
990
rep-
resented in Figure 1. The first three were constructed
from a recording on a paraffin block. The peaks were
selected by the use of a Hanning window accordingly
with the fact that the paraffin is defined by three spec-
tra (Vrabie et al., 2007). The last one is the spectrum
of the human skin estimated on a real dataset by an
ICA-based BSS method. Note however that linear in-
terpolations were used to eliminate the imperfections
corresponding to contributions of paraffin peaks.
Figure 1: Simulated spectra.
These spectra were linearly mixed to construct K =
250 observations by randomly picking positive mix-
ing coefficients from a mixing matrix obtained on a
real dataset. Figure 2 shows one observation. The
mixing coefficients of S
4
are very low compared to
the others, due to the energetic Raman signatures of
the paraffin that are present in real acquisitions. Note
that this dataset is free of noise, so the decomposition
given in Eq. (2) was not performed here.
Figure 2: Example of one observation.
The number of sources to be estimated was set at
M = 4 for all BSS methods. The dataset was centered
and each observation normalized to unit variance be-
fore applying the ICA-based methods. A ”pow3”
nonlinearity g was chosen for the FastICA because
it gives the best estimator for the last spectrum.
The threshold of the least squares error algorithm
for NMF was set at 10
−10
. As the convergence was
very slow, a second stop condition was used: the vari-
ations of the least squares error from one iteration to
other must be smaller than 10
−5
. Even in this case the
convergence was very slow, the number of iterations,
which depends on the initialization, was about 6· 10
5
.
Note that the results presented here are the best ob-
tained for 20 different initializations of the NMF.
The gradient step size of the MLPSS method was
set at 10
−3
, which is a usual valuefor this kind of data.
The MLPSS method has a faster convergence than
NMF, around 10
4
iterations are necessary to obtain
a good estimate of the spectra. However, the MLPSS
did not have a convergence toward a stationary point,
so it was stopped after 5· 10
5
iterations.
Figure 3 shows the estimated spectra
b
S
4
of the last
spectrum S
4
by the presented BSS methods. We fo-
cus here only on this spectrum because it corresponds
to the underlying biopsy in real applications and its
estimation is of interest.
Figure 3: Estimators of the 4
th
spectrum. From top to bot-
tom: JADE, FastICA, NMF and MLPSS.
As we can see, the NMF fails to estimate this spec-
trum. This is due to the fact that NMF requires the
existence of a monomial submatrix in the dataset in
order to ensure the convergence of the algorithm to
the right solution (Moussaoui, 2005). The MLPSS
BIOSIGNALS 2008 - International Conference on Bio-inspired Systems and Signal Processing
352
provides a good positive estimate with few imperfec-
tions corresponding to contributions of paraffin peaks
at 1065 cm
−1
and 1300 cm
−1
. The two ICA-based
methods give the same results. The estimated spec-
tra have zero mean and unit variance and follow the
shape of the original spectrum except some imper-
fections at 1175 cm
−1
and 1470 cm
−1
. Note that all
estimated mixing coefficients have uniquely positive
values, even for the ICA-based methods.
In order to provide a quantitative study we com-
pute the root mean square error (RMSE):
RMSE =
S
4
−
b
S
4
/
p
N
ν
(3)
where k.k denotes the Frobenius norm and S
4
the cen-
tered and normalized version of the original spectrum
S
4
used to construct the mixtures.
b
S
4
denotes either
the spectra estimated by ICA-based methods or the
centered and normalized versions of the spectra esti-
mated by NMF or MLPSS.
The values of RMSEs obtained for the estimated
spectra (see figure 3) are: 0.1605 for JADE, 0.1603
for FastICA, 0.8017 for NMF and 0.1264 for the
MLPSS algorithm. These values confirm that ICA-
based methods give practically the same results and
that NMF fails to estimate this spectrum. Moreover,
we can conclude that the MLPSS method gives the
best estimate, which, additionally, has positivevalues.
In the following we consider the case where a lin-
ear noise N
1
, decorrelated from the interesting spec-
tra, is added to the observations. We have chosen here
a Gaussian noise for the sake of simplicity. This noise
also simulates slight deforming effects on the peaks of
paraffin that may remain after the preprocessing steps
in real cases. This study is done by varying the signal-
to-noise ratio (SNR):
SNR = 20log
10
∑
4
i=1
A
i
S
T
i
kN
1
k
[dB] (4)
Note that the decomposition (2) does not com-
pletely remove the noise N
1
. After this step, a gain of
17dB is obtained for high values of SNR (i.e. SNR=
50dB). This gain linearly decreases with the SNR, a
gain of 6.5dB being obtained for a SNR= 2.5dB.
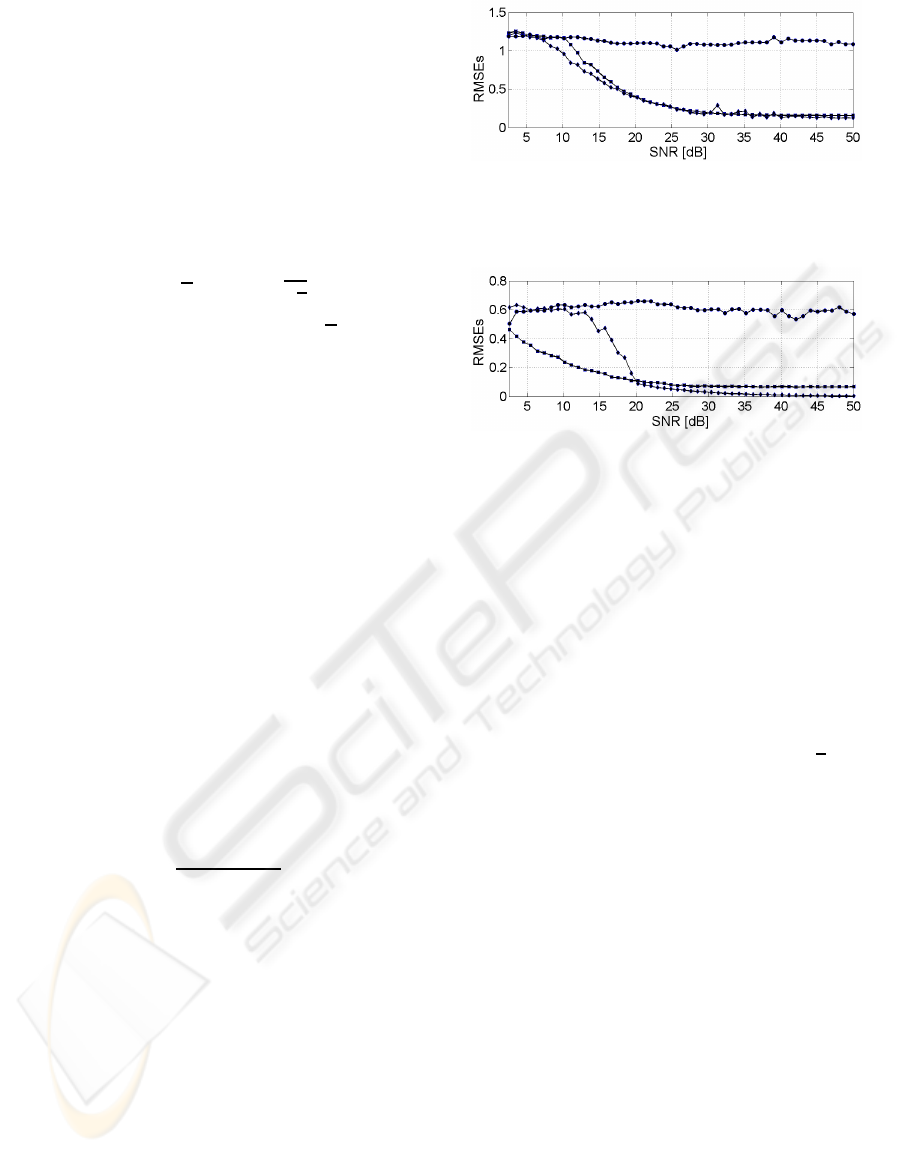
Figure 4 shows the evolutions of the RMSEs for
the estimated spectrum
b
S
4
with respect to the SNR.
These values are averaged over 4 independent realiza-
tions of the noise. The values obtained by the JADE
algorithm (represented by “ ”) are superposed on
those obtained for the FastICA (represented by “×”).
These evolutions confirm the conclusion stated above
even if, punctually, the RMSE of the MLPSS is larger
than the ones obtained by ICA methods.
Although these results give the MLPSS as the best
separation method, it is interesting to study the errors
Figure 4: RMSEs of
b
S
4
with respect to the SNR: “” JADE,
“×” FastICA, “•” NMF, “” MLPSS.
of, for example, the estimator
b
S
3
of the third spectrum
of the paraffin. These errors are shown in Figure 5.
Figure 5: RMSEs of
b
S
3
with respect to the SNR: “” JADE,
“×” FastICA, “•” NMF, “” MLPSS.
The result obtained for the MLPSS method is due to
the fact that the same peak of the paraffin is extracted
by two estimators,
b
S
2
and
b
S
3
. For real applications
this effect can perturb the estimator of the biopsy, es-
pecially when the preprocessing does not completely
compensate the deforming effects.
3.4.2 Real Dataset
The study is done on a dataset composed of K = 1254
Raman spectra acquired on a paraffin-embedded skin
biopsy. Spectral data were recorded into N
ν
= 990
points in the 650-1816 cm
−1
range by using a Labram
microspectrometer. The preprocessing techniques de-
veloped in (Gobinet et al., 2007) are firstly used in
order to improve the estimated spectra.
Figures 6, 7 and 8 show the results obtained by
the JADE, NMF and MLPSS algorithms. The results
of the FastICA being the same with those given by
JADE are not presented here. The same parameters
as in the simulated case were used. Some residual
peaks of paraffin, which sometimes are negative, are
present on spectra estimated by the JADE algorithm.
However, this technique provides positive mixing co-
efficients. The spectrum of the biopsy estimated by
NMF contains more energetic residual peaks of the
paraffin than the JADE estimator, whereas the spectra
of the paraffin are not well estimated. Spectra esti-
mated by MLPSS are close to the JADE results, but
the same peak of the paraffin (1135 cm
−1
) is extracted
by two estimators as in the simulated case. Moreover,
the application of this algorithm on another paraffin-
embedded skin biopsy led to a wrong estimation of
spectra, contrary to JADE.
COMPARATIVE STUDY OF BLIND SOURCE SEPARATION METHODS FOR RAMAN SPECTRA - Application on
Numerical Dewaxing of Cutaneous Biopsies
353
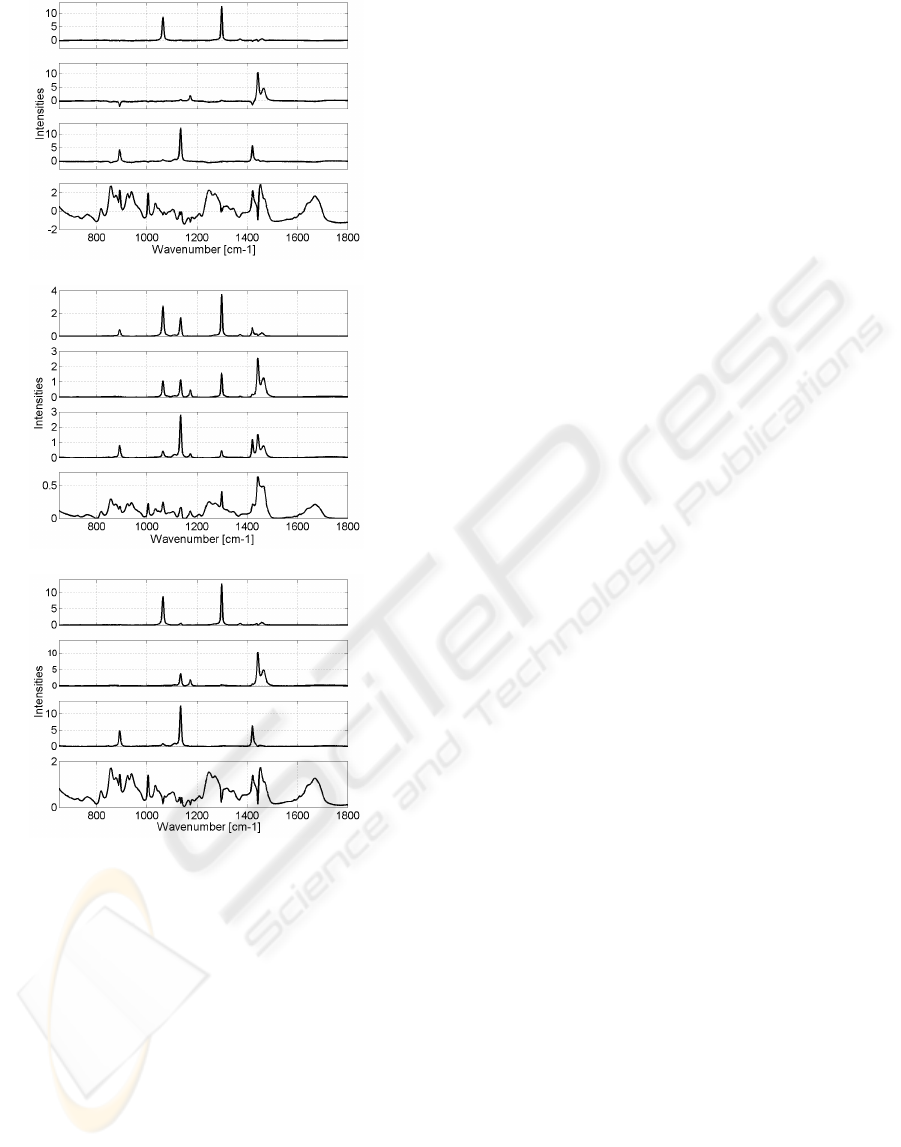
Figure 6: Spectra estimated by JADE.
Figure 7: Spectra estimated by NMF.
Figure 8: Spectra estimated by MLPSS.
4 CONCLUSIONS
Four BSS methods were studied on simulated and real
datasets. Taking into account only the positivity, the
NMF fails to estimate the interesting spectra. The
positivity combined with the independence allows the
MLPSS method to provide a good estimator for the
biopsy, but artefacts are obtained for the paraffin for
which the same peak is extracted by more than one
estimator. Furthermore, the results obtained by this
method depend on the analyzed biopsy. ICA-based
methods give good estimators for all spectra, which
do not depend on the biopsies, and extract positive
mixing coefficients. These last methods can thus be
employed as an efficient tool for the extraction of Ra-
man spectra of chemical species and consequently for
a numerical dewaxing of biopsies. However, all these
methods allow to extract a unique spectrum of the
skin, which might be insufficient for a classification
purpose. Investigations are under way for the study of
a numerical dewaxing based on least square methods,
taking into account the Raman spectra of the parafin
estimated on paraffin blocks.
REFERENCES
Cardoso, J.-F. (1998). Blind signal separation: statistical
principles. Proceedings of the IEEE, 86:2009–2025.
Cardoso, J.-F. and Souloumiac, A. (1993). Blind beam-
forming for non-gaussian signals. IEE Proceedings-F,
140:362–370.
Choo-Smith, L.-P., Edwards, H., Endtz, H., Kros, J., Heule,
P., Barr, H., Robinson, J., Bruining, H., and Pup-
pels, G. (2002). Medical applications of Raman spec-
troscopy: from proof of principle to clinical imple-
mentation. Biopolymers, 67:1–9.
Faol´ain, E., Hunter, M., Byrne, J., Kelehan, P., Lambkin,
H., Byrne, H., and Lyng, F. (2005). Raman spectro-
scopic evaluation of efficacy of current paraffin wax
section dewaxing agents. Journal of Histochemistry
and Cytochemistry, 53:121–129.
Gniadecka, M., Philipsen, P., Sigurdsson, S., Wessel, S.,
Nielsen, O., Christensen, D., Hercogova, J., Rossen,
K., Thomsen, H., Gniadecki, R., Hansen, L., and
Wulf, H. (2004). Melanoma diagnosis by Raman
spectroscopy and neural networks: Structure alter-
ations in proteins and lipids in intact cancer tissue. The
Journal of Investigative Dermatology, 122:443–449.
Gobinet, C., Vrabie, V., Tfayli, A., Piot, O., Huez, R., and
Manfait, M. (2007). Pre-processing and source sepa-
ration methods for Raman spectra analysis of biomed-
ical samples. In Proceedings of the 29th Annual In-
ternational Conference of the IEEE Engineering in
Medicine and Biology Society, Lyon, France.
Haka, A., Shafer-Peltier, K., Fitzmaurice, M., Crowe, J.,
Dasari, R., and Feld, M. (2002). Identifying microcal-
cifications in benign and malignant breast lesions by
probing differences in their chemical composition us-
ing Raman spectroscopy. Cancer Research, 62:5375–
5380.
Hyv¨arinen, A., Karhunen, J., and Oja, E. (2001). Indepen-
dent Component Analysis. Wiley, New York.
Lee, D. and Seung, H. (1999). Learning the parts of ob-
jects by non-negative matrix factorization. Nature,
401:788–791.
Moussaoui, S. (2005). S´eparation de sources non-
n´egatives. Application au traitement des signaux de
spectroscopie. PhD thesis, CRAN INPL, Nancy,
France.
Vrabie, V., Gobinet, C., Piot, O., Tfayli, A., Bernard, P.,
Huez, R., and Manfait, M. (2007). Independent com-
ponent analysis of Raman spectra: Application on
paraffin-embedded skin biopsies. Biomedical Signal
Processing and Control, 2:40–50.
BIOSIGNALS 2008 - International Conference on Bio-inspired Systems and Signal Processing
354
