
VOICE SIGNALS CHARACTERIZATION THROUGH ENTROPY
MEASURES
Paulo Rog
´
erio Scalassara, Mar
´
ıa Eugenia Dajer, Carlos Dias Maciel and Jos
´
e Carlos Pereira
School of Engineering of S
˜
ao Carlos, University of S
˜
ao Paulo, Avenida Trabalhador S
˜
ao-carlense, 400, S
˜
ao Carlos, Brazil
Keywords:
Voice, entropy, phase space reconstruction, nodule, predictability.
Abstract:
Human voice has been a matter of interest for different areas as technological development and medical sci-
ences. In order to understand the dynamic complexity of healthy and pathologic voice, researchers have
developed tools and methods for analysis. Recently nonlinear dynamics has shown the possibility to explore
the dynamic nature of voice signals from a different point of view. The purpose of this paper is to apply en-
tropy measures and phase space reconstruction technique to characterize healthy and nodule affected voices.
Two groups of samples were used, one from healthy individuals and the other from people with nodule in
the vocal fold. They are recordings of sustained vowel /a/ from Brazilian Portuguese. The paper shows that
nonlinear dynamical methods seem to be a suitable technique for voice signal analysis, due to the chaotic
component of the human voice. Since the nodule pathology is characterized by an increase in the signal’s
complexity and unpredictability, measures of entropy are well suited due to its sensibility to uncertainty. The
results showed that the nodule group had a higher entropy values. This suggests that these techniques may
improve and complement the recent voice analysis methods available for clinicians.
1 INTRODUCTION
The human voice is one of the principal means of
communication, and the acoustic signal carries signif-
icant information about some individual characteris-
tics. The complex normal or pathologic voice produc-
tion mechanism involves different variables. Vocal
fold biomechanics in association with aerodynamic
variables play an important role in voice production
and they are linked to the voice quality changes.
In order to study normal voice and the different
voice disorders, scientists from diverse areas devel-
oped several methods and tools for measurement, di-
agnosis and voice treatment. Therefore traditional
acoustic analysis is an essential and familiar tool for
physicians and speech therapists.
Traditionally, voice has been modeled as a linear
process and acoustic analysis tools are based in lin-
ear system theory. Acoustic parameters evaluate per-
turbation or noise contents in the voice signal. The
classical perturbation parameters evaluate jitter (fun-
damental frequency variation), and shimmer (ampli-
tude variation). Two parameters used to determine the
voice signal noise quantity are the deterministic Har-
monic to Noise Ratio (HNR) and the Coefficient of
Excess (EX) that evaluate the noise from a statistical
point of view (Davis, 1979).
Another interesting parameter is the pitch ampli-
tude (PA), which is a normalized measure of the am-
plitude of the pitch period peak of the residue sig-
nal autocorrelation function. It has a high value for
healthy vowel signals that have clearly defined pitch
period. However, for breathy pathological voices, the
PA is low because the signals have weak periodicity
(Davis, 1979).
Although, these linear tools have been used over
the years, they are based in the assumption that voice
is a linear phenomenon. But, voice production is
a complex mechanism that involves different vari-
ables and exhibits nonlinearities (Kumar and Mul-
lick, 1996). Considering human voice production
(healthy and pathologic) as a nonlinear system, it can
be described by a number of observable output states.
Therefore it can be used in the construction of a state
163
Rogério Scalassara P., Eugenia Dajer M., Dias Maciel C. and Carlos Pereira J. (2008).
VOICE SIGNALS CHARACTERIZATION THROUGH ENTROPY MEASURES.
In Proceedings of the First International Conference on Bio-inspired Systems and Signal Processing, pages 163-170
DOI: 10.5220/0001065401630170
Copyright
c
SciTePress

space description of the system behavior. Voice sig-
nal, as a time series data, makes available the study of
an underlying dynamic and provide the necessary in-
formation to obtain a reconstruction of the state space
behavior of the system. Thus, phase space reconstruc-
tion technique can be used for voice characterization.
Nowadays, the use of entropy measures is
widespread in many fields of science, whether ap-
plied to stochastic processes or dynamical systems.
As presented by (Amig
´
o et al., 2007), the applica-
tion of entropy to discrete phase space is very natu-
ral, since its concept has been extended from deter-
ministic continuous dynamics to stationary random
processes and discrete dynamical systems. (Amig
´
o
et al., 2007) present a quantity called discrete entropy
to deal with finite-state systems. This quantity asymp-
totically converges to conventional entropy, as evi-
denced by several examples.
As an example of the applicability of entropy,
(Kirk and Jenkins, 2004) show that the Kolmogorov
entropy is used to investigate software metrics, allow-
ing early assessment of the design quality of software
project. Also, in (Lake et al., 2002), an entropy mea-
sure called sample entropy was proposed. The objec-
tive was to improve the diagnosis of neonatal sepsis
by monitoring the heart rate characteristics. The rate
variability is interpreted as changes in the complex-
ity of the underlying physiological processes. De-
spite the fact the method showed sensitivity to other
signal’s parameters, the results were interesting and
could be used for monitoring at-risk infants.
Measures of entropy are intimately related to the
predictability of signals. These measures can be used
to evaluate forecast skill of a system. According to
(Kleeman, 2002), some progress has occurred in us-
ing processes ensemble spread as an indicator of pre-
dictability. This is formalized in a parameter called
predictive power (Schneider and Griffies, 1999).
Natural processes seem to be unpredictable due
to several reasons, as described in (Crutchfield and
Feldman, 2003). The most important reasons are:
unknown rules that govern the system, existence
of intrinsic mechanisms that amplify fluctuations,
observer-induced sources of randomness, insufficient
volume of data, and, perhaps, the dynamics is too
complicated to have predictions evaluated.
Since the presence of pathologies on the vocal
folds results in behavior change of the voice produc-
tion system, the produced signals are going to be less
predictable than the healthy ones. This work aims to
try to detect these changes using simple entropy mea-
sures to differentiate two kinds of signals: healthy and
pathological. For this paper, the pathology studied is
the presence of nodule in the vocal folds.
In Theory a brief description of the entropy es-
timation is presented and also an explanation about
the vocal fold nodule pathology. In Materials and
Methods the voice samples used in the study are de-
scribed in some details. After that, the phase space re-
construction and entropy estimation methods are pre-
sented. Also, a small discussion is made about the
voice samples’ processing. In Results examples of
signals’ phase space analysis are shown with the gen-
eral results of entropy measures. In Conclusion the
final comments about the work is presented.
2 THEORY
In this section a brief explanation of the entropy the-
ory is presented. Also, a description of vocal fold
nodules is shown.
2.1 Entropy
According to (Cover and Thomas, 1991), entropy is a
quantity defined for any probability distribution with
properties that agree with the intuitive notion of infor-
mation measures.
One of the entropy’s first concepts was presented
in (Shannon, 1948) as the definition of a measure of
uncertainty of a random variable. Considering a ran-
dom variable X that assumes values x ∈ χ where χ is
a finite set, the entropy H(X) can be defined by Equa-
tion (1), with units in bits.
H(X ) = −
∑
x∈χ
p(x)log
2
p(x) (1)
The probability of x, Pr{X = x}, is denoted by p(x).
If p(x) = 0, p(x)log
2
p(x) = 0 by convention. This
quantity is dependent on the distribution of X instead
of the actual values of the random variable. As dis-
cussed in (Crutchfield and Feldman, 2003), the en-
tropy measures the average amount of bits necessary
to store outcomes of the random variable.
2.2 Vocal Fold Nodules
Individuals with vocal nodules constitute a large part
of the client population at voice clinics (Colton and
Casper, 1996). They are commonly seen in women,
children, salesmen, and teachers who have to use their
voice too frequently. The main symptoms are hoarse-
ness, breathiness, easy vocal fatigue, and throat dis-
comfort. The voice is better in the morning and wors-
ens in the afternoon after voice use (Fisher, 1996).
The vocal nodule is as a benign lesion occurring
on both sides of the vocal folds, strictly symmetric on
BIOSIGNALS 2008 - International Conference on Bio-inspired Systems and Signal Processing
164

the border of the anterior and middle third of the vo-
cal fold and usually immobile during phonation. The
lesion is confined to the superficial layer of the lamina
propria (Rosen and Murry, 2000; Hirano, 1991).
The vocal folds are subject to several forms of me-
chanical stress during phonation. Vocal fold vibration
during phonation leads to impact stress during colli-
sion between the left and right vocal fold surfaces.
According to different studies, nodules mostly occur
at the midpoint of the membranous vocal folds, where
impact forces are the largest and they are mostly bi-
lateral (Titze, 1994; Jiang and Titze, 1994).
During the closing phase of the folds’ vibration,
the presence of nodules on the outer layer of vo-
cal folds’ tissue inhibits them from being completely
folded on each other. Consequently the glottis clo-
sure is uncompleted, adding turbulent air to the voice
signal. In order to reduce this effect, the subject in-
creases the muscle tension and the subglottal pres-
sure, consequently rising the vocal fold collision
forces (Hillman et al., 1990).
Nodule voice shows perceptually strained/pressed
voice quality and breathiness with various degrees of
turbulent noise. Frequently, the voice also presents
vibrations irregularities, such as roughness and insta-
bility, as well as vocal fry/creak (Hammarberg, 1998).
The nodules are responsible for pitch frequency
and air flow volume changes, also amplitude and mu-
cosal wave reduction and the noise-like turbulence
of airflow in the vocal folds. This is mainly due
to the incomplete closure of the vocal folds, glottal
air leakage, and their asymmetrical vibration because
of their biomechanical parameter alterations (Hugh-
Munier et al., 1997).
3 MATERIALS AND METHODS
In this section the voice samples are addressed show-
ing the groups and acquisition method. After that, the
phase space reconstruction technique and the entropy
estimation method are presented. Finally, the voice
signals’ analysis method is shown.
3.1 Voice Samples
For this study, 28 voice signals divided in two equal
groups were used. The first group was composed of
healthy people with no voice complaints or laryngeal
pathology. The second group was composed of peo-
ple with vocal fold nodules in different stages of dis-
ease evolution according to (Scalassara et al., 2007).
These voice signals are part of a voice database of
the Group of Bioengineering of the School of Engi-
neering of S
˜
ao Carlos at the University of S
˜
ao Paulo,
Brazil. These signals were collected along the past ten
years and used in several studies (Rosa et al., 2000;
Dajer et al., 2005).
All volunteers were diagnosed by physicians of
the Otolaryngology sector and the Head and Neck
Surgery sector of the Clinical Hospital in the Fac-
ulty of Medicine at Ribeir
˜
ao Preto, Brazil (http:
//www.hcrp.fmrp.usp.br) by means of video-
laryngoscope and stroboscope light.
The data recording was performed using a proto-
col similar to the one presented in (Uloza et al., 2005).
The subjects were asked to produce a sustained vowel
/a/ at a comfortable pitch and loudness level for about
3 seconds. The used microphone was in accordance
to the standards established in Brazil. It was placed at
a distance of 5 cm from the person’s mouth. Consec-
utive trials were performed, selecting the signal with
less voice variability.
As presented in (Davis, 1979), vowel sounds are
generally used in studies of pathological speech be-
cause the vocal folds are vibrating during vowel
phonation. Also, acoustics assessment of laryngeal
function relates to adequacy of sustained vocal fold
vibration. Therefore, in order to collect the data,
the sustained /a/ phoneme was used to evaluate the
acoustical parameters of the samples. In English, this
phoneme is equivalent to “a” in “dogma”.
At voice acquisition, it was necessary to check if
the individual could cope with the phonation interval
and, in negative case, he was asked to stop uttering.
This procedure was important because the mainte-
nance of the utterance causes an increase of the voice
fundamental frequency and an artificial stability on its
production (Rosa et al., 2000). In order to avoid the
influence of transitory phenomena, the start and end-
ing of the acquired voice signal were discarded. Then,
it was possible to ensure that the beginning and end-
ing of voicing did not influence the final result.
After that, the amplitude of the signal was normal-
ized according to its absolute maximum value. It was
necessary to eliminate the influence of different sound
levels from the signals collected. All voices samples
were quantized in amplitude with 16 bits and recorded
in mono-channel WAV format to preserve the fidelity
of the signal. The sampling frequency was 22050 Hz.
3.2 Phase Space Reconstruction
Technique
In order to describe the nonlinear dynamic character-
istics of voice signals, sustained vowel data set was
analyzed with ANL (An
´
alise N
˜
ao-Linear) software
VOICE SIGNALS CHARACTERIZATION THROUGH ENTROPY MEASURES
165
(Dajer et al., 2005). This piece of software was devel-
oped using Matlab 7.0 and the Tisean Package (Heg-
ger et al., 1999; Kantz and Schreiber, 2004). The
ANL is based in the phase space reconstruction tech-
nique and represent the vocal folds vibration as an or-
bit trajectory in phase space with time evolution.
The voice signal can be represented by the time
series x(t
i
), t
i
= t
0
+ iT , with i = 1,2,. .. ,N, where
N is the length of the signal and T is the sampling
period (Rabiner and Schafer, 1978). The phase space
reconstruction of this signal is performed by plotting
the time series x(t
i
) against itself at some time delay
(Ott et al., 1994; Packard et al., 1980).
In order to create the reconstructed space for the
time series x(t
i
), the method of delays is used (Fraser
and Swinney, 1986; Hegger et al., 1999). A set of m
vectors, called the embedding space, are formed from
time delayed values of x (t
i
), Equation (2). In this set,
m is the embedding dimension and τ is the time delay.
X(t
i
) = {x(t
i
),x(t
i
− τ),.. ., x(t
i
− (m − 1)τ)} (2)
When m > 2D + 1, where D is the Hausdorff dimen-
sion, the reconstructed phase space is topologically
equivalent to the original phase space (Fraser and
Swinney, 1986). The delay τ is obtained by the first
local minimum of the mutual information function of
the signal (Fraser and Swinney, 1986).
3.3 Entropy Estimation
In order to estimate the signal entropy, an algorithm
was developed based on the one presented in (Modde-
meijer, 1989) with the optimizations shown in (Mod-
demeijer, 1999). The method is based on a simple his-
togram algorithm with bias correction and minimum
mean square error estimation. In the cited paper, the
author presents several examples that evaluate the al-
gorithm showing its reliability.
The principle of the method is to try to estimate
the probability distribution function (PDF) of the sig-
nal under study. This is performed by dividing the
function in a rectangular grid with I equally ∆x-sized
cells. The occurrences of the signal’s points in each
cell, k
i
, are summed. Then, the probabilities of each
cell, p
i
, is replaced by the estimative k
i
/N, where N
is the total number of samples of the signal. There-
fore, the entropy estimator of Equation (3) is ob-
tained, since the logarithms have base 2, the units are
in bits. The bias correction for this estimator for dis-
crete systems is given in Equation (4).
ˆ
H
x
= −
∑
i
k
i
N
log
2
k
i
N
+ log
2
∆x (3)
E{
ˆ
H
x
} ≈ H
x
−
I − 1
2N
(4)
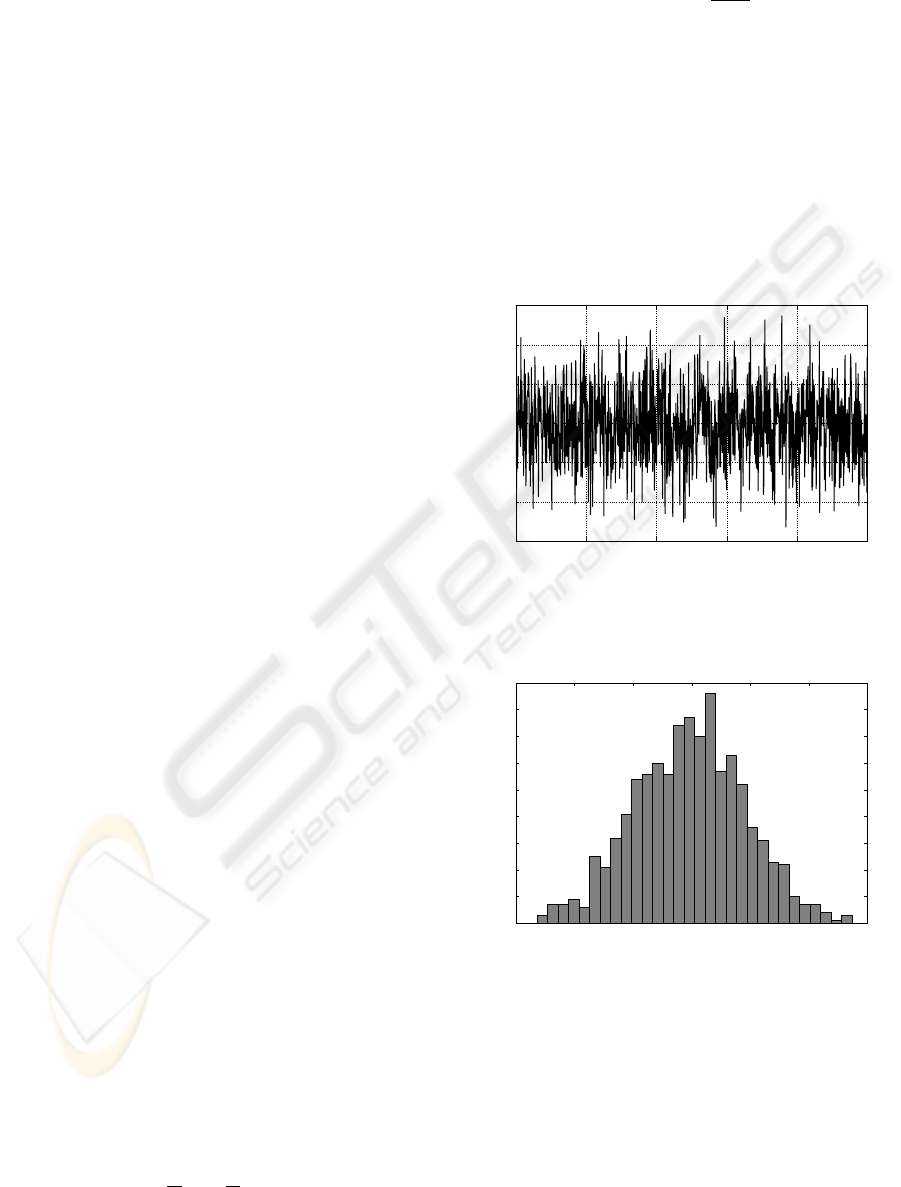
An example of the use of this algorithm is now
shown. It is taken from R. Moddemeijer web-
site: http://www.cs.rug.nl/
˜
rudy/matlab/doc/
entropy.html. A normal distributed random noise
is generated with zero mean and unity standard devi-
ation. The signal and its histogram, obtained using
30 bins, are presented in Figures 1 and 2 respectively.
The expected entropy of this signal is 1.4189 nat. Us-
ing the estimator the result is 1.3643, what gives an
error of 3.85%.
0 200 400 600 800 1000
−3
−2
−1
0
1
2
3
Sample
Amplitude
Figure 1: Signal of a normal distributed random noise gen-
erated with zero mean and unity standard deviation used to
illustrate the entropy algorithm.
−3 −2 −1 0 1 2 3
0
10
20
30
40
50
60
70
80
90
Amplitude
Occurrences
Figure 2: Histogram of the random noise signal used to il-
lustrate the entropy algorithm. This histogram was obtained
using 30 bins.
3.4 Analysis Method
Each voice sample was analyzed by a speech thera-
pist and had its most stationary part selected. This
stationarity was further analyzed by checking the re-
sult’s power spectrum density (PSD), verifying if only
BIOSIGNALS 2008 - International Conference on Bio-inspired Systems and Signal Processing
166
minor changes occur. This is a simple form of ob-
taining wide sense stationary (WSS) signals (Hayes,
1996).
For all the samples, this procedure resulted in at
least one second of voice sample. The result was di-
vided in parts with length of 1000 points (approxi-
mately 50 milliseconds). Each of these signals were
normalized by the absolute of its maximum value.
The PDF of these normalized signals were es-
timated according to the proposed method in order
to evaluate their entropy. Since each signal has the
same length and amplitude range, the entropy estima-
tor does not favor any of them. The analysis is per-
fomed with the mean and standard deviations values
of the signal’s entropies.
4 RESULTS
Healthy and nodule voice samples analyzed by means
of phase space reconstruction technique with ANL
showed different visual patterns for each group.
In order to determinate the visual pattern charac-
teristics, three kind of orbits’ dynamic behavior were
observed: a) number of loops, b) attractor course reg-
ularity, and c) attractor trajectories distribution (di-
vergence and convergence of attractor orbits’ trajec-
tories).
For healthy voice signals, phase space reconstruc-
tion for sustained vowel /a/ presents a typical visual
pattern. First, it is characterized by many concentric
loops of different dimensions. The orbits’ loops are
correlated to the interaction between the fundamen-
tal frequency (F
0
) and the harmonic frequencies (F
1
,
F
2
, F
3
, ...) of the signal. This configuration links the
voice signal complexity and the number of harmonic
frequencies amplified and contained in sustained /a/
vowel. Second, the attractor course is flat and regular
and, third, the attractor trajectories are very close to
each other showing convergence tendency.
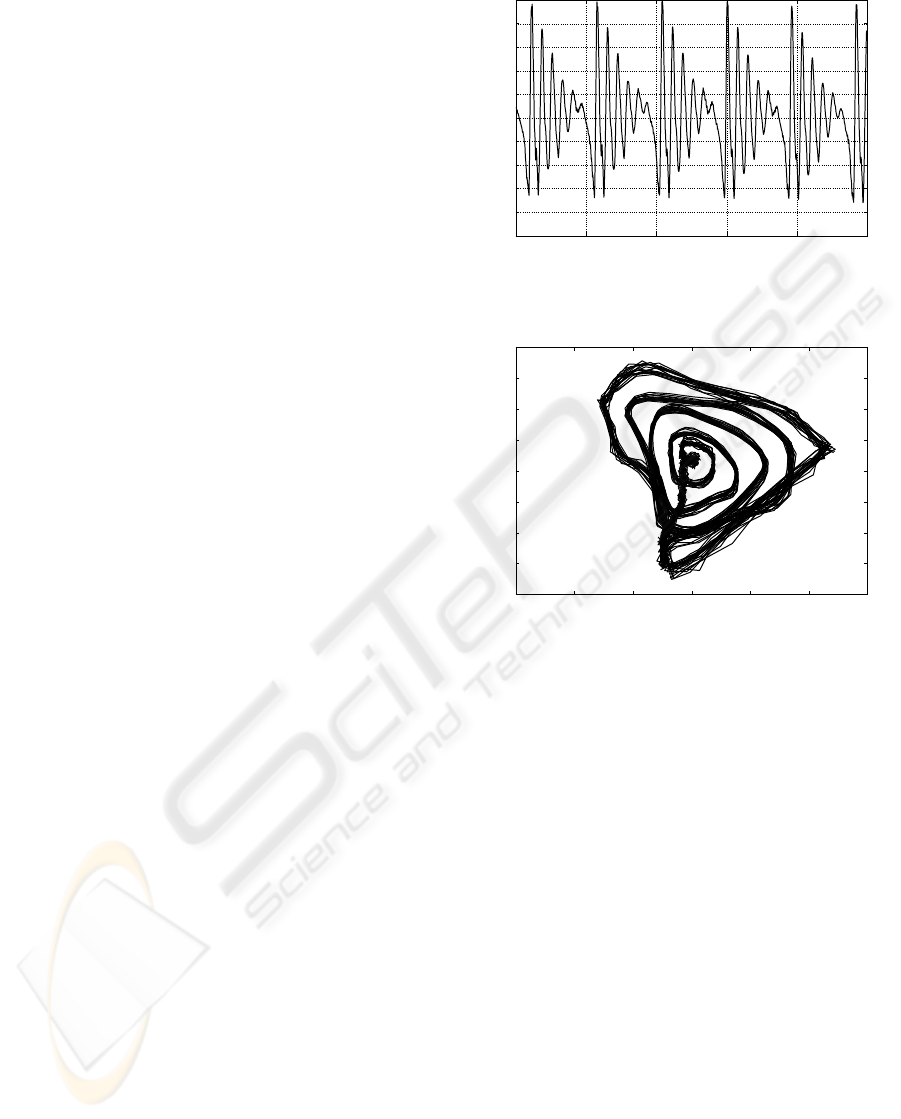
Figure 3 shows a typical healthy voice signal of a
sustained vowel /a/. Figure 4 shows its phase space
reconstruction with time delay τ according to (Fraser
and Swinney, 1986).
For nodule voice signals, phase space reconstruc-
tion of sustained vowel /a/ presents different patterns.
In general, the nodule’s pattern is characterized firstly
by a single and irregular orbit loop differing from the
healthy ones. Although the harmonic components are
present in the glottal pulse, the higher muscle tension
and subglottal pressure unbalance the (F
0
)/harmonic
frequencies ratio and the compensatory vocal tract
gesture contributes to atenuate the harmonic frequen-
cies, consequently producing a single trajectory loop.
0 10 20 30 40 50
−1
−0.8
−0.6
−0.4
−0.2
0
0.2
0.4
0.6
0.8
1
Time [ms]
Normalized Amplitude
Figure 3: Example of a typical healthy voice signal of a
sustained vowel /a/.
−1 −0.5 0 0.5 1 1.5
−0.75
−0.5
−0.25
0
0.25
0.5
0.75
1
x[n]
x[n−τ]
Figure 4: Phase space reconstruction of the typical healthy
voice signal of a sustained vowel /a/.
Secondly, the attractor course is irregular and curly
because of the incomplete closure of the vocal folds,
turbulence of airflow and the asymmetrical vibration.
Thirdly, the attractor trajectories present a disperse
tendency caused by air flow volume changes and the
mucosal wave variation. This irregularity can happen
in some specific regions or even in different regions
of the orbits.
Figure 5 shows a typical nodule voice signal of a
sustained vowel /a/. Figure 6 shows its phase space
reconstruction with time delay τ according to (Fraser
and Swinney, 1986).
After the proper stationary regions of the signals
were selected using the perceptual acoustic analysis
and study of the phase space, the entropy estimations
were performed. Since these selected samples had at
least one second of voice, they were decomposed in
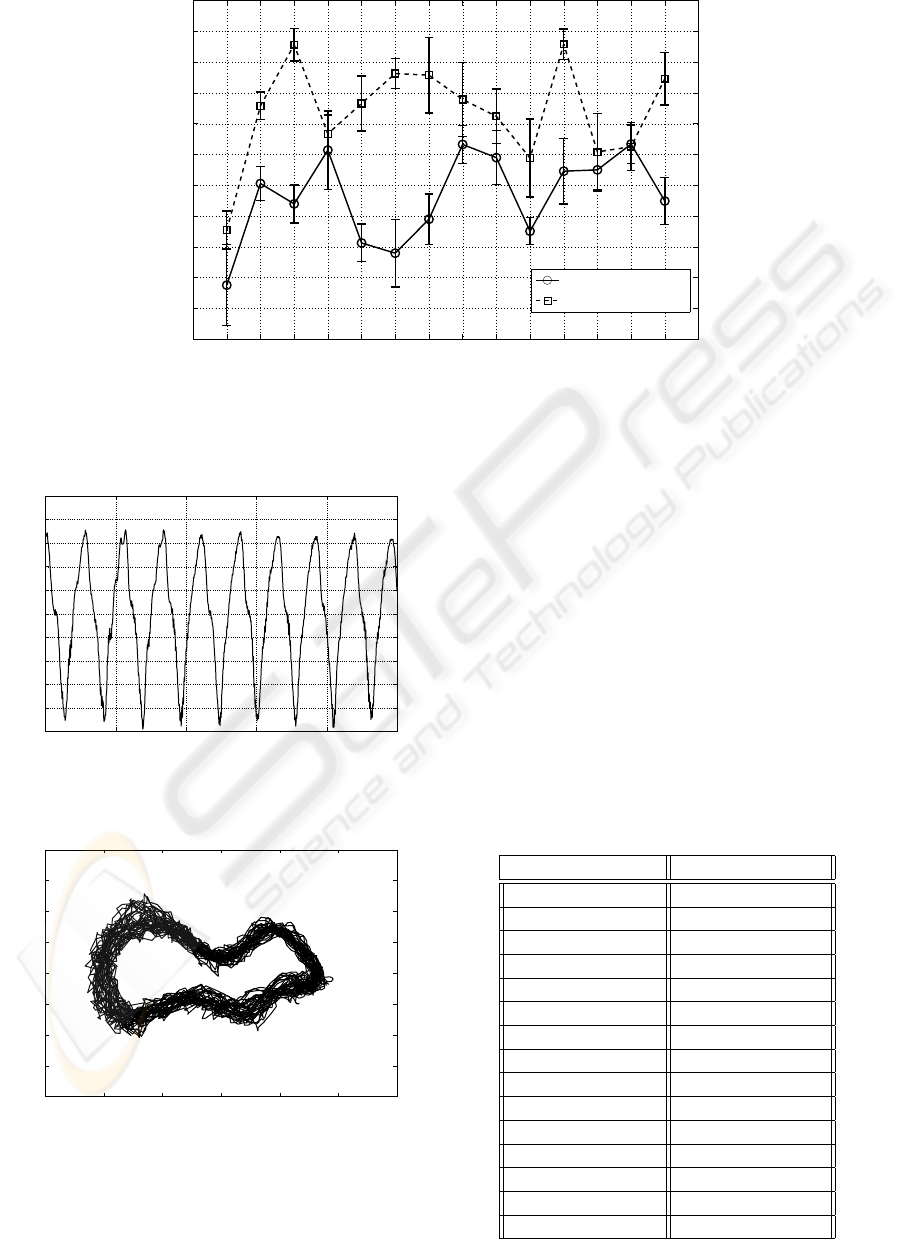
20 signals of 1000 points each. Figure 7 presents the
mean and standard deviation entropy values of the re-
sults of these 20 signals for each of the 14 healthy and
14 nodule voice samples. These samples are ordered
by their evaluation, therefore they are not paired.
As can be seen in the figure, the mean values of
VOICE SIGNALS CHARACTERIZATION THROUGH ENTROPY MEASURES
167
1 2 3 4 5 6 7 8 9 10 11 12 13 14
5.4
5.5
5.6
5.7
5.8
5.9
6
6.1
6.2
6.3
Sample
Entropy [bits]
Healthy Samples
Nodule Samples
Figure 7: Entropy estimation results for the two groups of voice signals, healthy and nodule affected, each with 14 samples.
Every point is a mean (with standard deviation) of entropy values of 20 signals (50 milliseconds each). The nodule group
presented higher values than the healthy group, 99.75% probability in a Student-t test (significance level of 5%).
0 10 20 30 40 50
−1
−0.8
−0.6
−0.4
−0.2
0
0.2
0.4
0.6
0.8
1
Time [ms]
Normalized Amplitude
Figure 5: Example of a typical nodule voice signal of a sus-
tained vowel /a/.
−1 −0.5 0 0.5 1 1.5
−0.75
−0.5
−0.25
0
0.25
0.5
0.75
1
x[n]
x[n−τ]
Figure 6: Phase space reconstruction of the typical nodule
voice signal of a sustained vowel /a/.
the nodule samples seem to be higher than that of
the healthy samples. According to the standard de-
viation values, the two classes seem to be separated.
The mean entropy value of the healthy group is 5.76
bits with standard error of 0.14 bits, while the mean
and standard error values of the nodule group is 6.04
and 0.16 respectively. The individual values obtained
for these samples are shown in Table 1. An unpaired
Student-t test with a significance level of 5% was per-
formed on the data. It shows that the mean of the
nodule group is indeed higher than that of the healthy
group with a probability of 99.75%.
Table 1: Mean and standard deviation (Std) of the entropy
values, in bits, of the results of the 20 signals of each of the
14 healthy and 14 nodule voice samples.
Healthy Samples Nodule Samples
Mean Std Mean Std
5.48 0.13 5.65 0.06
5.81 0.05 6.06 0.04
5.74 0.06 6.26 0.05
5.91 0.13 5.97 0.06
5.61 0.06 6.07 0.09
5.58 0.11 6.16 0.05
5.69 0.08 6.16 0.12
5.93 0.06 6.08 0.12
5.89 0.09 6.02 0.09
5.66 0.04 5.89 0.13
5.85 0.11 6.26 0.05
5.85 0.07 5.91 0.12
5.93 0.06 5.93 0.08
5.75 0.08 6.15 0.09
BIOSIGNALS 2008 - International Conference on Bio-inspired Systems and Signal Processing
168

Table 2: Mean values and standard deviations of jitter,
shimmer and pitch amplitude (PA) for the signals under
analysis (percentual values).
Samples Jitter Shimmer PA
Healthy 0.47 ± 0.39 3.34 ± 0.88 54 ± 12
Nodule 3.37 ± 3.22 10.04 ± 4.74 36 ± 15
In order to compare the performance of the proposed
method, the voice signals were analyzed aiming to
extract vocal acoustic parameters. This was per-
formed by a commercial software called An
´
alise de
Voz (Voice Analysis) version 6.0. The mean values
(and standard deviations) of jitter, shimmer and pitch
amplitude (PA) over the 14 samples of each group of
signals are presented in Table 2.
The jitter and shimmer mean values are smaller
for the healthy group, as expected, and present nar-
row probability distribution. For the nodule group the
distribution is much wider. This variation can be in-
terpreted as an increase of the uncertainty of these sig-
nals. The mean PA is higher for the healthy group
because the signals have a more defined period, the
cause of the smaller jitter values.
The higher variability of the parameters for the
nodule group is probably due to physiological differ-
ences among the occurences of the pathology. Nod-
ules can be manifested in several ways along the vo-
cal folds, some layers of tissue may be modified or
not. Therefore, the system dynamic alterations can
lead to much different voice signals. It is interesting
to observe that the presented parameters compare fa-
vorably to the results obtained by the entropy method.
5 CONCLUSIONS
In this work, there was an attempt to look into voice
as a dynamical signal and, consequently, explore new
processing techniques for healthy and vocal nodule’s
voice signals. A practical application and advantages
of dynamical analysis were also presented. Thus,
we believe that nonlinear dynamics tools, as entropy
measures and phase space reconstruction, may help in
a review of many of the voice dynamic characteristics.
We presented a study of the use of entropy mea-
sures to two groups of voice signals. They were com-
posed by samples of healthy and nodule in the vo-
cal folds affected individuals. The samples were an-
alyzed by a speech therapist with aid of phase space
plots. The most stationary parts of these signals (in
the WSS sense) were selected. The entropy method
developed by (Moddemeijer, 1989) was used to es-
timate the entropy of samples of 50 milliseconds of
each of the signals. The results obtained for the
mean and standard deviation values were tested with
a Student-t test being clearly separable. This is an
indication of the behavior of the entropy of nodule
signals, at least in the voice samples studied.
The nodule group showed a higher entropy value
than the healthy group. This was expected because
this vocal fold pathology is characterized by increase
of the signal’s complexity (Hammarberg, 1998; Hill-
man et al., 1990). This effect is reflected in an in-
crease of the uncertainty of the signal, that is, the sig-
nal becomes less predictable (Crutchfield and Feld-
man, 2003; Schneider and Griffies, 1999).
The results were compared to jitter, shimmer and
pitch amplitude values of the samples, which were ob-
tained with a commercial software. The variability of
the parameters for the nodule affected group was sig-
nificantly higher than that of the healthy group, there-
fore presenting a behavior that compares favorably to
that obtained with the entropy method.
This work is still an initial study, but phase space
analysis helps to depict the vowel pattern in a dynam-
ical way. This technique allows to visualize the dif-
ferential dynamics between healthy voices and voices
with vocal folds nodules. Future works intend to use
predictability measures to improve the understanding
of the relation of pathologies with the complexity of
the voice signal. Also, measures applied directly to
the phase space of the signals are planned as well.
ACKNOWLEDGEMENTS
The authors acknowledge the Research Foundation of
the State of S
˜
ao Paulo (FAPESP) and the Program of
Students - Post-graduation Agreement (PEC-PG) for
the support and scholarship. We also thank the School
of Engineering of S
˜
ao Carlos (EESC/USP) for the re-
search facilities and the use of its voice database.
REFERENCES
Amig
´
o, J. M., Kocarev, L., and Tomovski, I. (2007). Dis-
crete entropy. Physica D: Nonlinear Phenomena,
228(1):77–85.
Colton, R. H. and Casper, J. K. (1996). Understanding voice
problems: a physiological perspective for diagnosis
and treatment. Williams & Wilkins, Baltimore.
Cover, T. M. and Thomas, J. A. (1991). Elements of Infor-
mation Theory. John Wiley and Sons, Inc., New York.
Crutchfield, J. P. and Feldman, D. P. (2003). Regularities
unseen, randomness observed: levels of entropy con-
vergence. Chaos, 13(1):25–54.
VOICE SIGNALS CHARACTERIZATION THROUGH ENTROPY MEASURES
169

Dajer, M. E., Pereira, J. C., and Maciel, C. D. (2005). Non-
linear dynamical analysis of normal voices. In Seventh
IEEE International Symposium on Multimedia (ISM
2005), pages 765–771, Irvine, CA, USA.
Davis, S. B. (1979). Speech and language: advances in
basic research and practice, chapter Acoustic char-
acteristics of normal and pathological voices, pages
271–314. Academic Publishers, New York.
Fisher, K. V. (1996). Vocal fold nodules. Curr. Op. Otol.
Head Neck Surg., 4:166–171.
Fraser, A. M. and Swinney, H. L. (1986). Independent coor-
dinates for strange attractors from mutual information.
Phys. Rev. Lett., 33(2):1134–1140.
Hammarberg, B. (1998). Perception and acoustics of voice
disorders: a combined approach. In Proceedings of
VOICEDATA98, Symposium on databases in voice
quality research and education, pages 1–6, Utrecht,
The Netherlands. Utrecht Institute of Linguistics.
Hayes, M. H. (1996). Statistical Digital Signal Processing
and Modeling. John Wiley & Sons, Inc., New York.
Hegger, R., Kantz, H., and Schreiber, T. (1999). Practical
implementation of nonlinear time series methods: The
tisean package. Chaos, 9(2):413–435.
Hillman, R. E., Holmberg, E. B., Perkell, J. S., Walsh, M.,
and Vaughan, C. (1990). Phonatory function associ-
ated with hyperfunctionally related vocal fold lesions.
Journal of Voice, 4(1):52–63.
Hirano, M. (1991). Phonosurgery assessment and surgical
management of voice disorders, chapter Phonosurgi-
cal anatomy of the larynx, pages 34–36. Raven Press,
New York.
Hugh-Munier, C. M., Scherer, K. R., Lehmann, W., and
Scherer, U. (1997). Coping strategies, personality, and
voice quality in patients with vocal fold nodules and
polyps. Journal of Voice, 11(4):452–461.
Jiang, J. J. and Titze, I. R. (1994). Measurements of vo-
cal fold pressure and impact stress. Journal of Voice,
8(2):132–145.
Kantz, H. and Schreiber, T. (2004). Nonlinear Time Series
Analysis. Cambridge University Press, Cambridge,
2nd edition.
Kirk, S. R. and Jenkins, S. (2004). Information theory-
based software metrics and obfuscation. The Journal
of Systems and Software, 72(2):179–186.
Kleeman, R. (2002). Measuring dynamical prediction util-
ity using relative entropy. Journal of the Atmospheric
Sciences, 59(13):2057–2072.
Kumar, A. and Mullick, S. K. (1996). Nonlinear dynamical
analysis of speech. Journal of the Acoustic Society of
America, 100(1):615–629.
Lake, D. E., Richman, J. S., Griffin, M. P., and Moorman,
J. R. (2002). Sample entropy analysis of neonatal
heart rate variability. Am. J. Physiol. Regul. Integr.
Comp. Physiol., 283(3):R789–R797.
Moddemeijer, R. (1989). On estimation of entropy and mu-
tual information of continuous distributions. Signal
Processing, 16(3):233–248.
Moddemeijer, R. (1999). An efficient algorithm for select-
ing optimal configurations of ar-coefficients. In 20th
Symp. on Information Theory in the Benelux, pages
189–196, Haasrode (B).
Ott, E., Sauer, T., and Yorke, J. A. (1994). Coping with
Chaos. John Wiley & Sons, Inc., New York.
Packard, N. H., Crutchfield, J. P., Farmer, J. D., and Shaw,
R. S. (1980). Geometry from a time series. Phys. Rev.
Lett., 45(9):712–716.
Rabiner, L. R. and Schafer, R. W. (1978). Digital Pro-
cessing of Speech Signals. Prentice Hall, Englewood
Cliffs, NJ.
Rosa, M. O., Pereira, J. C., and Grellet, M. (2000). Adap-
tive estimation of residue signal for voice pathology
diagnosis. IEEE Trans. Bio. Eng., 47(1):96–104.
Rosen, C. A. and Murry, T. (2000). Nomenclature of voice
disorders and vocal pathology. Otolaryngol. Clin.
North. Am., 33(5):1035–1046.
Scalassara, P. R., Maciel, C. D., Guido, R. C., Pereira,
J. C., Fonseca, E. S., Montagnoli, A. N., Barbon, S.,
Vieira, L. S., and Sanchez, F. L. (2007). Autoregres-
sive decomposition and pole tracking applied to vo-
cal fold nodule signals. Pattern Recognition Letters,
28(11):1360–1367.
Schneider, T. and Griffies, S. M. (1999). A conceptual
framework for predictability studies. Journal of Cli-
mate, 12(10):3133–3155.
Shannon, C. E. (1948). A mathematical theory of commu-
nication. The Bell System Technical Jounal, 27:379–
423, 623–656.
Titze, I. R. (1994). Mechanical stress in phonation. Journal
of Voice, 8(2):99–105.
Uloza, V., Saferis, V., and Uloziene, I. (2005). Perceptual
and acoustic assessment of voice pathology and the ef-
ficacy of endolaryngeal phonomicrosurgery. Journal
of Voice, 19(1):138–145.
BIOSIGNALS 2008 - International Conference on Bio-inspired Systems and Signal Processing
170
