
CREST LINES AND CORRELATION FILTER BASED LOCATION
OF THE MACULA IN DIGITAL RETINAL IMAGES
C. Mari˜no, M. G. Penedo, S. Pena
VARPA Group, Faculty of Informatics, University of A Coru˜na, A Coru˜na, Spain
F. Gonz´alez
School of Medicine and Complejo Hospitalario Universitario of Santiago,
University of Santiago de Compostela, Santiago de Compostela, Spain
Keywords:
Creases, correlation filter, macula, optic disk, deformable model.
Abstract:
The fovea is a spot located in the center of the macula, and responsible for sharp central vision. In this paper
a method to detect the macula location and size is presented, as a first step towards the fovea location.In the
first stage of the process, the retinal vessel tree is extracted through a crest line detector. Then, the main vessel
arc is fitted to a parabolic curve using a polynomial fitting process, which will allow for the computation of
the area where the optic disc is located. The last stage consists in the segmentation of the optic disc, by means
of the combination of morphological operations and a deformable model. Then, following the morphological
properties of the eye, the macula location and size is determined by means of a new correlation filter. Search
with this filter is performed in a reduced area of interest, whose size and position is determined by means,
again, of the morphological properties of the eye. The algorithm has proven to be fast and accurate in the set
of test images, composed of 135 digital retinal images.
1 INTRODUCTION
The retinal fundus photographs are widely used in the
diagnosis of eye diseases. Processing automatically a
large number of retinal images can help ophthalmol-
ogists to increase the efficiency in medical environ-
ments were big numbers of patients must be treated.
The optic disk is the brightest area in images that do
not have large areas of exudates and it is a slightly
oval disk. It is the entrance region of vessels and its
detection is very important since it works as a land-
mark for the other features in the retinal image. The
macula is a commonly visible as a hazy dark area.
This is the area with the highest number of cones and
rods per unit area.
There are many previous works on optic disk lo-
calization. Goldbaum et al. (Goldbaum et al., 1996)
extract the main features of the eye fundus (optic disk,
vessels, blobs and fovea), through the combination of
several templates, which work separately on the im-
age color channels. Pinz et al. (Pinz et al., 1998)
also obtain a map of the human retina using retinal
angiographies, obtaining very good results. Lalonde
et al. (Lalonde et al., 2001) extract the optic disk
using Hausdorff based template matching and pyra-
midal decomposition. It is neither sufficiently sensi-
tive nor specific enough for clinical application. On
the other hand, strategies based on active contours
(Mendels et al., 1999; Lowell et al., 2004; Chanwim-
luang and Fan, 2004) are used to detect the optic disk
boundary in retinal images. These techniques are very
robust against noise but their main disadvantage is
their high computational cost.
A method for detecting the macular center was
presented by Sinthanayothin (Sinthanayothin et al.,
1999). In this approach a template based algorithm
was used, combined with the morphological proper-
ties of the eye. The system showed an accuracy of
80.4% on 100 images. Li et al. (Li and Chutatape,
2004) presented a model based approach in which an
snake was used to extract the vascular tree based on
the location of the optic disk. Then, the information
from the snake was used to find the macula center.
The authors reported a 100% accuracy for optic disk
localization and 100% for macula localization in 89
digital retinal images.
This paper presents an algorithm for the automatic
localization and segmentation of the optic nerve head,
521
Mariño C., G. Penedo M., Pena S. and González F. (2008).
CREST LINES AND CORRELATION FILTER BASED LOCATION OF THE MACULA IN DIGITAL RETINAL IMAGES.
In Proceedings of the First International Conference on Bio-inspired Systems and Signal Processing, pages 521-527
DOI: 10.5220/0001066305210527
Copyright
c
SciTePress
macula and fovea working on digital retinal fundus
images. The optic nerve head is located and its shape
is extracted without user intervention. Localization is
achieved by means of a two stage process. In the first
stage, creases are extracted and filtered, so that only
the crest lines correspondingto the main vessel arc are
not removed. Then a polynomial curve is fitted to the
points in the crest lines, which will determine an area
of interest where the optic disk will be located. In the
second stage the shape of the optic disk is determined
through the combination of two techniques: morpho-
logical operators and a deformable model. The fi-
nal result is the optic disk shape and position. Once
the optic disk position has been determined, macula
and fovea are located using the morphological prop-
erties of the eye, which allow for the optimization of
the search procedure, performed by means of a multi-
scale correlation filter searching over a small area.
The setup of the paper is as follows. Section 2
provides details on the algorithm for the optic disk lo-
calization and segmentation. Section 3 describes the
macula segmentation process. Experiments and re-
sults are given in section 4 for both the optic disk and
macula localization and segmentation, and finally sec-
tion 5 provides discussion and conclusions.
2 OPTIC DISK SEGMENTATION
The first stage of the process consists of locating the
region where the optic disk is situated. This is per-
formed by tracking the main crest lines, which con-
verge in the optic disk. Then an accurate segmenta-
tion of the optic disk is obtained by means of a de-
formable model. This information, combined with
the morphological properties of the eye, will be very
useful in the process of locating and segmenting the
macula.
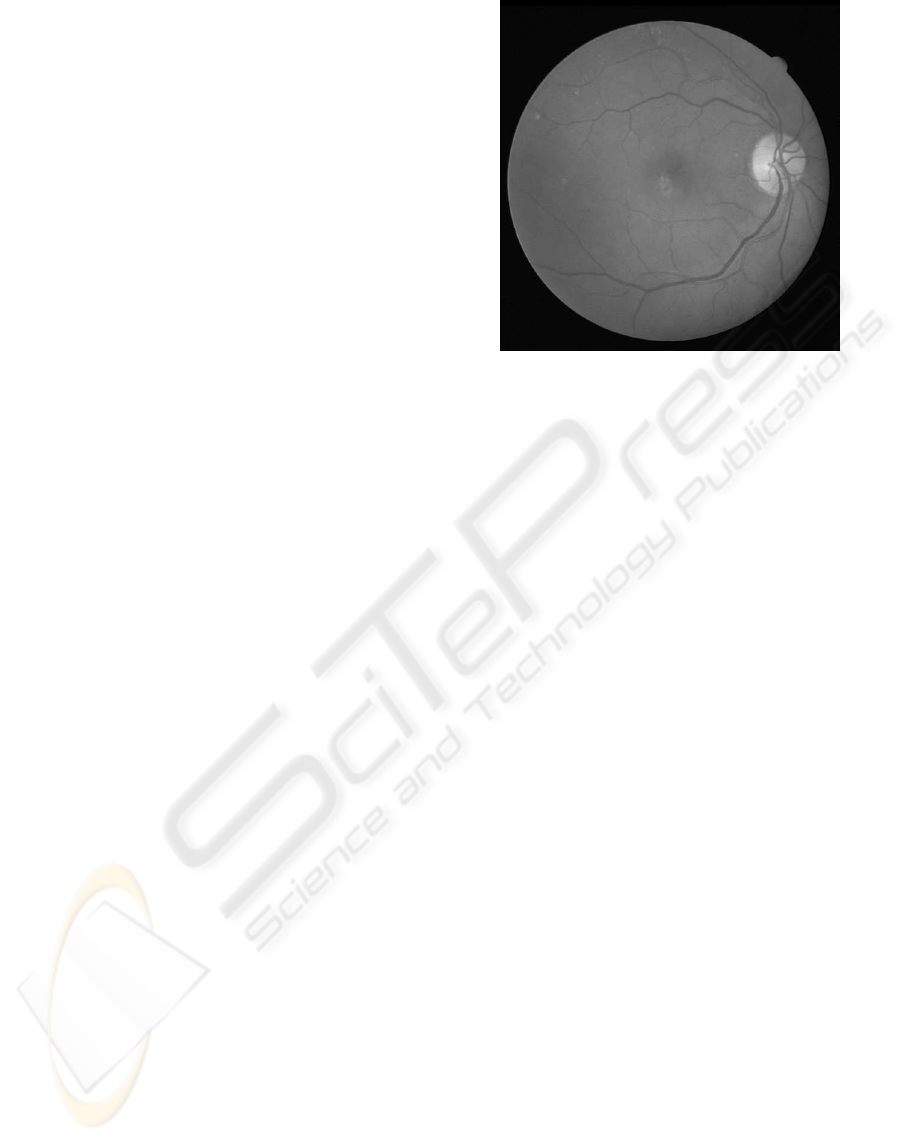
2.1 Optic Disk Location
Analyzing the morphology of the retinal vessel tree
(Figure 1), it is clear that the root of this tree is the
optic disk, so by tracking the main vessels it is possi-
ble to arrive to the optic disk position. Following this
approximation, an algorithm has been designed to ob-
tain that position without the need of segmenting the
whole retinal vessel tree.
Since the segmentation of the retinal vessel tree
would be a costly process, only the crest lines of the
main vessel arc are used in the detection of the op-
tic disk position. To compute the crest lines, a geo-
metric approach was used, the Multi-local Level Set
Figure 1: Digital retinal image acquisition. Note the con-
vergence of the main vessels in the optic disk, fact which
will be used in the detection of the optic disk position.
Extrinsic Curvature with the Structure Tensor filter-
ing process (MLSEC-ST) (A. Lpez and Villanueva,
2000; Mari˜no et al., 2006). Using this method only
the highest creases are preserved, and the main vessel
arc creases are obtained, as shown in Figure 2.
However, in some of the images the crest lines ob-
tained do not reach the optic disk due to the high fil-
ter levels applied, and it is necessary an interpolation
method to compute the position of the optic disk (Fig-
ure 2, bottom). Analyzing the shape of the vessel arc,
a parabolic fitting to the points in the creases seems to
be the best approximation. But, from the results ob-
tained, the two degree polynomial fitting showed to
be inaccurate and a third level polynomial fitting was
tried with satisfactory results. To obtain this curve,
a least square fitting process was performed with the
classic equation 1 and minimizing the expression in
equation 2. In Figure 3 two examples of the result
from the fitting process are depicted, with blue lines
representing the curves interpolated from the crest
lines.
y = ax
3
+ bx
2
+ cx+ d (1)
n
∑
i=1
[y
i
− f(x
i
)]
2
=
n
∑
i=1
[y
i
− (ax
3
i
+ bx
2
i
+ cx
i
) + d]
2
(2)
Once the optic disc is roughly located, an area of
interest containing the optic disk is determined. This
area will be centered in the coordinates where both
branches of the main vessel arc crest lines converge,
and its size will be two times the average optic disk
size of all the images analyzed, so that every optic
disk will be contained within this small area (the red
rectangle in Figure 3). It is within this area where
BIOSIGNALS 2008 - International Conference on Bio-inspired Systems and Signal Processing
522
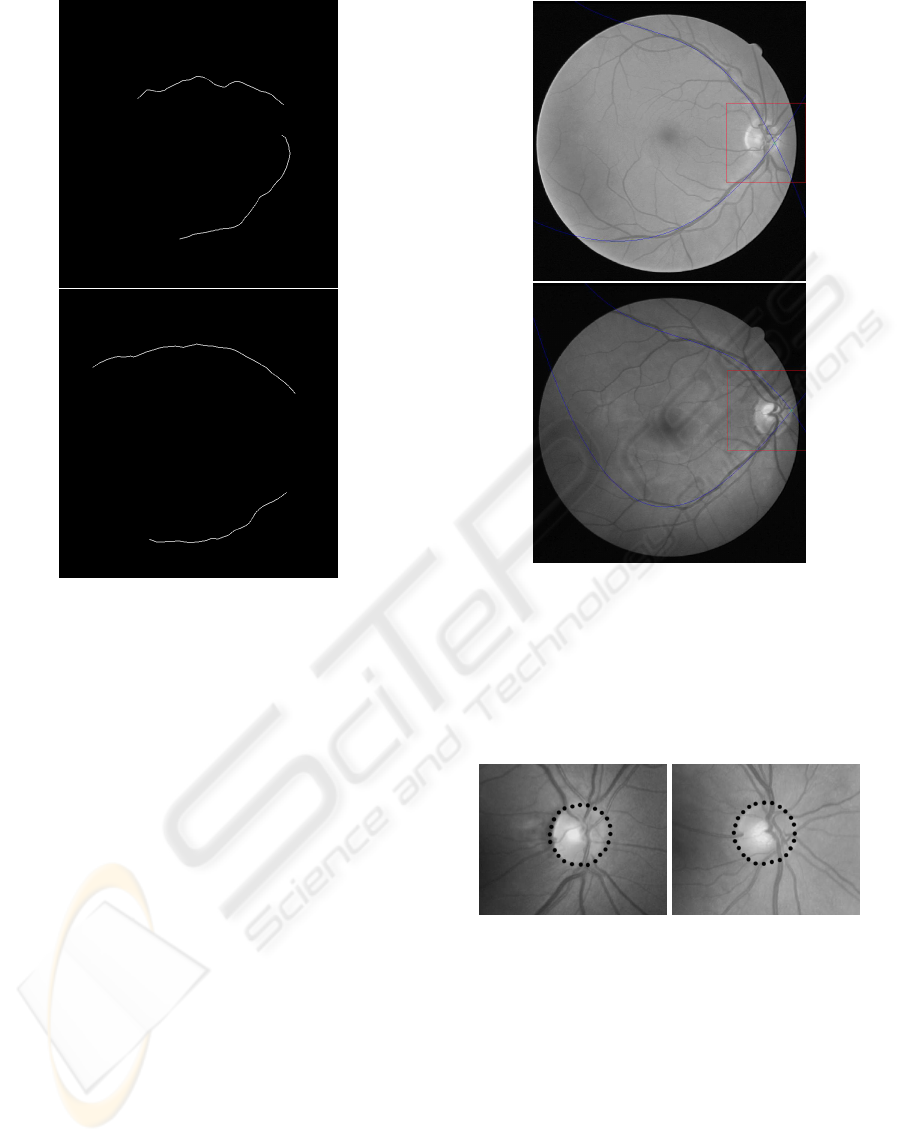
Figure 2: Crest lines obtained with the MLSEC-ST method.
Top: crest lines reach the optic disk, so that its position is
easily determined. Bottom: in some images, an interpola-
tion method is necessary to reach the optic disc position.
the segmentation process will be performed, obtain-
ing the shape and size of the optic disk.
2.2 Optic Disk Segmentation
Many works about the optic disk segmentation can be
found in literature. Several methods were tried with
the retinal images we are working with. The best re-
sults have been obtained with a deformable model-
based segmentation process, based on the work by
Hu et al. (Hu et al., 1998; Mari˜no et al., 2007). In
this method, the deformable model is composed of a
global model and a local model. The global model
approximately fits the boundary of the optic disc. The
local deformable model can get a more accurate fit
to the characteristics of the boundary, keeping at the
same time the shape of the model when the bound-
ary does not exist or it is difficult to get. Optic disc
segmentation is performed in three stages: in the first
two stages the global model is fitted to the optic disc.
In the third stage, starting from the result of the previ-
ous stages, the local model is accurately fitted to the
particularities of the optic disk boundary. In Figure
Figure 3: Results obtained from the third degree polynomial
fitting applied to two different images. Blue lines represent
the third degree polynomic curves fitted to the points of the
creases.
4 two segmentation results are depicted, showing the
accuracy of the method.
Figure 4: Results obtained from the segmentation process
using the deformable model applied to two different retinal
images.
Not that the optic disk has been located, the next
step consists in licating the macula and fovea using
the properties of the eye’s morphology.
3 MACULA AND FOVEA
DETECTION
The fovea is a small depression on the eye fundus. It
is the darkest part in most of the retinal images, while
CREST LINE AND CORRELATION FILTER BASED LOCATION OF THE MACULA IN DIGITAL RETINAL
IMAGES
523
it is not obvious in some images due to high illumina-
tion or being covered by lesions. Its geometrical rela-
tion to other structures is employed to locate robustly
the fovea. The method performs in two steps: first,
a candidate area containing the macula is obtained,
then, the macula size and position is located within
this area through a matched filter.
3.1 Macula Candidate Region Selection
The candidate region for the fovea is defined as a cir-
cular area. Its center is located approximately at 2
disk diameters away from the optic disk center and
its radius equals to the optic disk radius. Because the
fovea is located about 2 times optic disk size temporal
to the optic disk in the retinal images (Larsen, 1976),
the candidate region is such defined in order to ensure
that the fovea is within the region.
Since in section 2.2 we have computed the coordi-
nates and diameter of the optic disk center, it is possi-
ble to obtain an accurate estimation of the fovea and
macula position, by fitting a new parabolic curve to
the main vessel arc, and taking the coordinates of the
optic disk center as the parabola vertex. Following
the work from Li et al. (Li and Chutatape, 2004), the
parabolic shape is given by equation 3.
[(x− x
c
)sinθ + (y− y
c
)cosθ]
2
= (3)
2p[(x− x
c
)cosθ− (y− y
c
)sinθ]
where x
c
,y
c
are the vertex coordinates, x and y are the
searched points, p/2 represents the focal length, and
θ is the rotation angle of the directrix. Then a search
by mean square error is performed. In this work the
shape of the curve has been represented by the general
form given by equation 4, much simpler and compu-
tationally more efficient.
y = ax
2
+ bx+ c (4)
Although in equation 4 the rotation and the
parabolic vertex are not represented, the least square
error fitting is a very simple process. Vertex coordi-
nates can be computed using equation 5.
x
v
= −b/2a
y
v
= c − b
2
/4a
(5)
where x
v
,y
v
are the coordinates of the vertex. If we
impose the restriction that the vertex will always be
the center of the optic disk, combining equations 4
and 5 the parabola will be given by equation 6, de-
fined by the parameter a and the optic disk center co-
ordinate, already known from the previous segmenta-
tion stage.
b = −2x
v
a (6)
c = ax
2
v
+ y
v
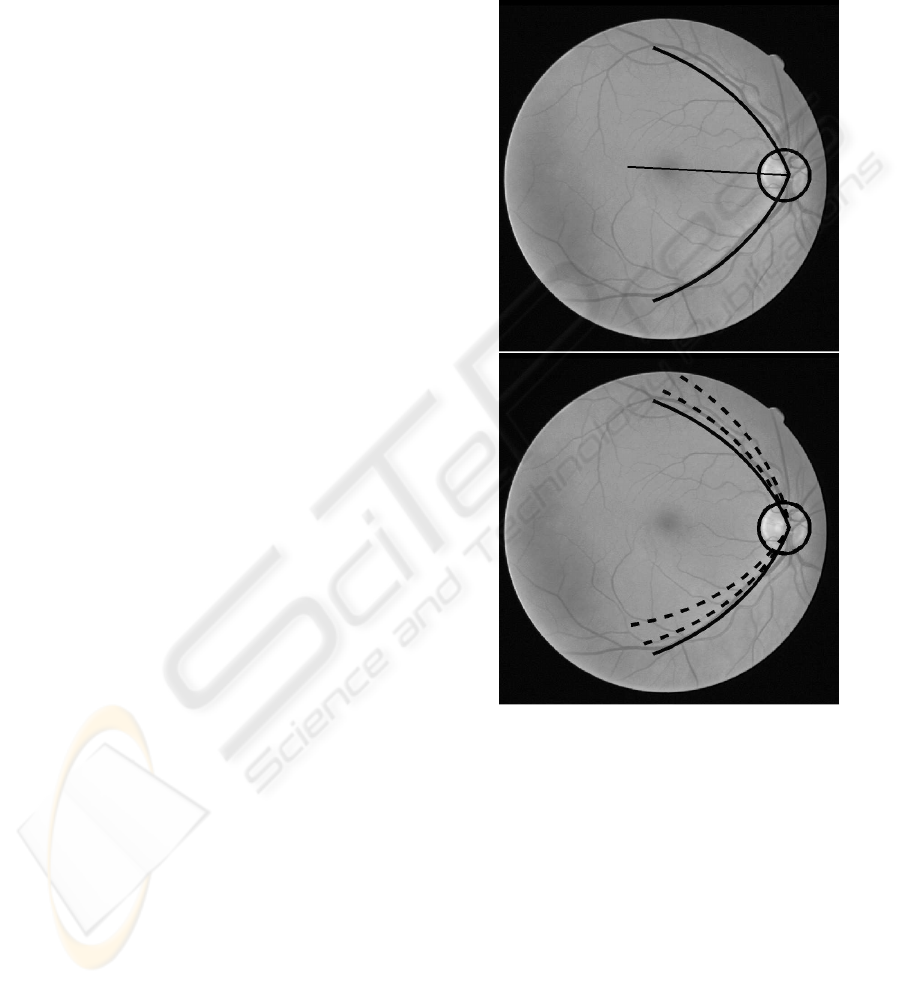
Figure 5 represents the parabolic fitting process.
Figure 5: Representation of the parabolic model. Top:
parabolic model with the directrix. Bottom: several itera-
tions of the parabolic model searching for the best fit to the
main arc vessels.
This way, following the parabola bisection two
diameters away from the optic disk center, a search
area can be defined, greatly reducing the search space
where the macula is located. Figure 6 represents the
process of determining this area of interest.
3.2 Fovea Location
Once the candidate area containing the macula has
been located, a correlation filter is applied to the re-
gion in order to locate the macula and the fovea.
BIOSIGNALS 2008 - International Conference on Bio-inspired Systems and Signal Processing
524
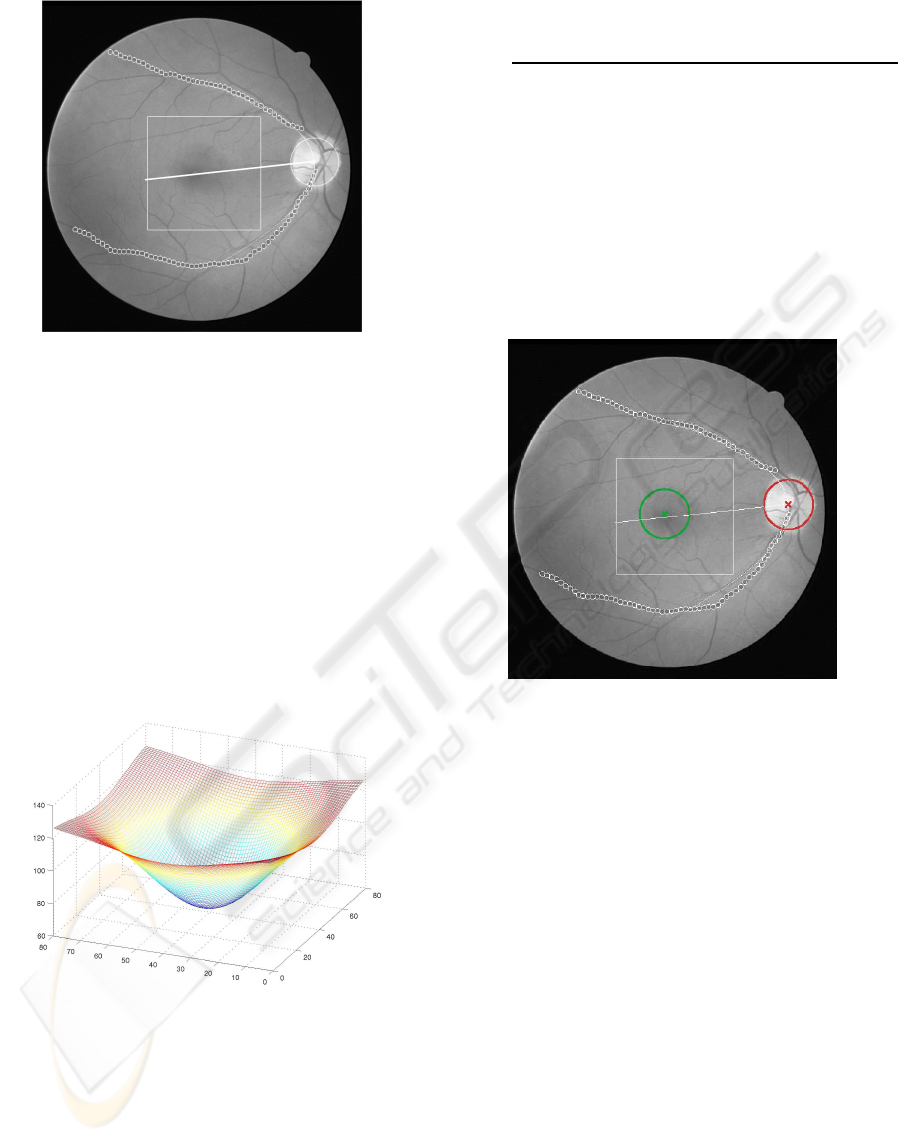
Figure 6: Computation of the candidate foveal region.
Points from the creases (white circles) are fitted to the
parabolic model and then, following the parabola directrix
a fixed distance, the macula candidate search area is deter-
mined.
As previously stated, the fovea is a spot located
in the center of the macula, and is responsible for the
sharp central vision. The macula is commonly visi-
ble as a hazy dark area. To locate this dark area, a
matched filter which consists of a Laplacian of Gaus-
sian is used. The correlation filter is shown in Figure
7. The fovea will be located at the position where the
response of the filter is maximum.
Figure 7: The correlation filter to locate the macula, where
the template consists of a Laplacian of Gaussian.
The template is correlated with the intensity com-
ponent of the retinal image. We use the full Pearson-
R correlation to take variations in mean, intensity and
contrast into account, as defined in Equation 7. The
size of the filter is taken the same as the optic disk
radius, since the diameter of the macula is about the
same as the diameter of the optic disk (Larsen, 1976).
C
i, j
=
∑
x,y
( f(x,y) −
¯
f(x,y))(w(x− i, y− j) − ¯w)
∑
x,y
( f(x,y) −
¯
f(x,y))
2
∑
x,y
(w(x− i,y− j) − ¯w)
2
(7)
The region of interest containing the macula is de-
fined as an n × m rectangle whose center is the point
with the higher response computed by means of the
correlation filter. Figure 8 shows the result obtained
by the macula segmentation process. The macula is
marked as a white circle about the center of the im-
age, while the fovea is marked with a cross in its cen-
ter (optic disk segmentation result is also included,
with its center marked as a red cross).
Figure 8: Result obtained by the macula segmentation pro-
cess using the correlation matched filter in the image in Fig-
ure 6. Optic disk radius and center are marked in red, and
fovea and macula contours are marked in green.
4 RESULTS
In order to test the accuracy of the method, several
experiments have been designed, and the results have
been validated by clinicians from the Complejo Hos-
pitalario Universitario de Santiago (CHUS). The set
of test images was composed of 135 retinal digital
images with a resolution of 565 × 584 pixels. Ta-
ble 1 contains the statistics for the test images, with
average horizontal and vertical diameters of the op-
tic disks (first and second column) and horizontal vs.
vertical ratio (third column). This values will be used
in the initialization stages of the deformable model,
and will determine the size of the region of interest
where the macula is located.
The main goal of this work is the macula loca-
tion, and this task has been performed in two stages:
CREST LINE AND CORRELATION FILTER BASED LOCATION OF THE MACULA IN DIGITAL RETINAL
IMAGES
525
Table 1: Statistics (average, standard deviation, maximum
and minimum) for the horizontal, vertical and ratio of the
horizontal and vertical diameters (horizontal/vertical) for
the images in the test set.
Horizontal Vertical Ratio
diameter diameter Ratio
Average 78,97 85,03 1,08
Standard deviation 7,34 8,36 0.09
Maximum 103 112 1,23
Minimum 65 70 0,77
the former determined an area of interest where the
fovea will be searched, and in the latter the macula
was segmented by means of a correlation filter. The
results from the first stage are included in table 2.
The location is considered good when the macula en-
tirely contained within the area of interest. Accepta-
ble results show the number of maculas from the set
of test images partially contained in the area. A re-
sult is considered bad when the macula is mostly out-
side the area of interest. It is clear how the algorithm
successfully detected the area of interest surrounding
the macula in the 100% of the images in the test set.
Table 2: Results of the determination of the area of interest
containing the macula.
Area of interest
Good Acceptable Bad
100% 0% 0%
100% 0%
In the last stage of the process, the macula was
segmented using a correlation filter. This process is
very fast since the area where the search takes place
is very small. Following the criteria of Goldbaum et
al. (Goldbaum et al., 1996), there are three possible
results in the segmentation:
1. Good localization: estimated center and real cen-
ter (determined by an expert clinician) of the mac-
ula overlap.
2. Acceptable localization: estimated and real cen-
ters are not separated more than a mean radius
(from table 1).
3. Bad localization: otherwise.
Following this categorization, the results obtained
are depicted in table 3.
Figure 9 shows the results obtained in three differ-
ent retinal images. The optic disk, the region con-
taining the macula, the macula and the fovea have
Table 3: Results for the macula location.
Macula location
Good Acceptable Bad
97% 0% 3%
97% 3%
Table 4: Execution times for each one of the algorithm
stages.
Stage Time (seconds)
Creases extraction 0.537s
3rd. degree polynomic fit 0.020s
Optic disk segmentation 2.588s
Parabolic fit 0.033s
Macula location 0.324s
Total 3.502s
been marked in all of these images, showing the re-
sults commented in tables 2 and 3.
Finally, table 4 whows the execution times of each
stage, from the creases computation to the macula lo-
cation. These times were measured in a PIV 2.0GHz.
From these times it is clear that a screening process
involving thousands of people, which usually would
take much time to the clinicians, could be greatly re-
duced with the help of a system like the one proposed
in this paper.
5 CONCLUSIONS AND FURTHER
WORK
In this work a methodology to locate and segment
the optic disk and the macula has been presented.
The algorithm performs in several stages, from
the creases extraction, necessary for the optic disk
location, to the macula location. Besides, high level
domain knowledge is used to reduce the area where
the macula is located once the optic disk has been
detected. Still much work has to be done to improve
the results of the process. A pyramidal search is
being tried to obtain a better segmentation of the
macula, and a higher number of images is necessary
to validate the presented results. Moreover, tests
with standard sets of images (like the DRIVE project
(Staal et al., 2004)) need to be performed to obtain
more reliable result statistics.
BIOSIGNALS 2008 - International Conference on Bio-inspired Systems and Signal Processing
526
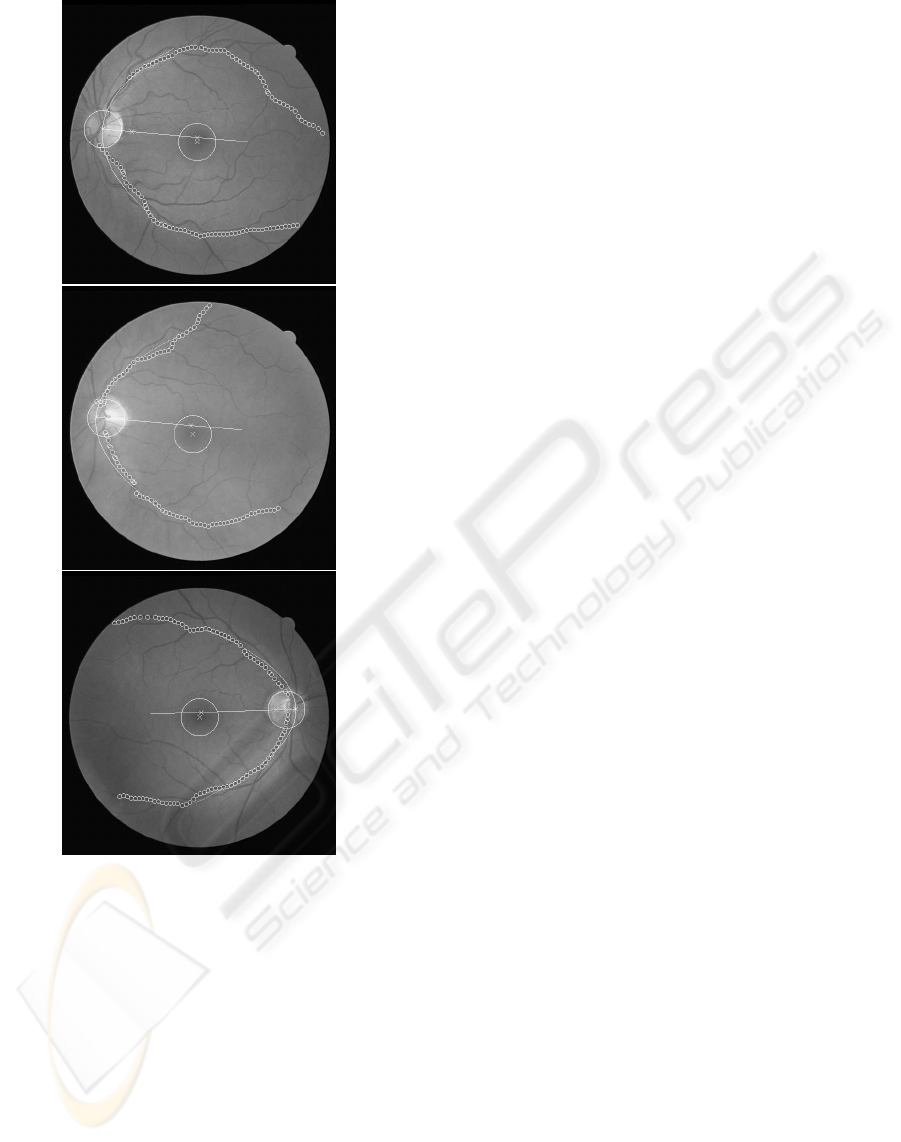
Figure 9: Results of the segmentation of the optic disk and
the macula. These images show the results in three cases
where the macula and optic disk were successfully located
and segmented.
ACKNOWLEDGEMENTS
This paper has been partly funded by the
Xunta de Galicia through the grant contract
PGIDIT05SIN001E.
REFERENCES
A. Lpez, D. Lloret, J. S. and Villanueva, L. (2000). Mul-
tilocal creaseness based on the level set extrinsic cur-
vature. Computer Vision and Image Understanding,
77:111–114.
Chanwimluang, T. and Fan, G. (2004). An efficient algo-
rithm for extraction of anatomical structures in reti-
nal images. IEEE International Conference on Image
Processing, 23:1093–1096.
Goldbaum, M., Moezzi, S., Taylor, A., Chatterjee, S., Boyd,
J., Hunter, E., and Jain, R. (1996). Automated diag-
nosis and image understanding with object extraction,
object classification, and inferencing in retinal images.
In Proceedings of the International Conference on Im-
age Processing, volume 3, pages 695–698.
Hu, Y.-L., Rogers, W. L., Coast, D. A., Kramer, C. M.,
and Reicheck, N. (1998). Vessel boundary extrac-
tion based on a global and local deformable physical
model with variable stiffness. Magnetic Resonance
Imaging, 16:943–951.
Lalonde, M., Beaulieu, M., and Gagnon, L. (2001). Fast and
robust optic disk detection using pyramidal decompo-
sition and hausdorff–based template matching. IEEE
Transaction on Medical Imaging, 20:1193–1200.
Larsen, H. W. (1976). The Ocular Fundus: A Color Atlas.
Munksgaard.
Li, H. and Chutatape, O. (2004). Automated feature ex-
traction in color retinal images by a model based
approach. IEEE Transactions on Medical Imaging,
51(2):246–254.
Lowell, J., Hunter, A., Steel, D., Basu, A., Ryder, R.,
Fletcher, E., and Kennedy, L. (2004). Optic nerve
head segmentation. IEEE Transactions on medical
Imaging, 23:256–264.
Mari˜no, C., Barreira, N., Penedo, M. G., Ortas, M., Doncel,
J. L., and G´omez-Ulla, F. (2007). Two stages optic
disc segmentation in digital retinal images. WSEAS
Transactions on Information Science and Applica-
tions, 4(4):771–778.
Mari˜no, C., Penedo, M. G., Penas, M., Carreora, M. J., and
Gonz´alez, F. (2006). Personal authentication using
digital retinal images. Pattern Analysis and Applica-
tions, (9):21–33.
Mendels, F., C., H., and J.P., T. (1999). Identification of
the optic disk boundary in retinal images using active
contours. Proceedings of the Irish Machine Vision and
Image Processing Conference, pages 103–115.
Pinz, A., Bern¨ogger, S., Datlinger, P., and Kruger, A.
(1998). Mapping the human retina. IEEE Transac-
tions on Medical Imaging, 17(4):606–619.
Sinthanayothin, C., Boyce, J., Cook, H., and Williamson, T.
(1999). Automated localisation of the optic disc, fovea
and retinal blood vessels from digital colour fundus
images. British Journal of Ophthalmology, 83:902–
910.
Staal, J., Abramoff, M., Niemeijer, M., Viergever, M., and
van Ginneken, B. (2004). Ridge based vessel segmen-
tation in color images of the retina. IEEE Transactions
on Medical Imaging, 23:501–509. See also
http:
//www.isi.uu.nl/Research/Databases/DRIVE/
.
CREST LINE AND CORRELATION FILTER BASED LOCATION OF THE MACULA IN DIGITAL RETINAL
IMAGES
527
