
SHORT-TERM CEPSTRAL ANALYSIS APPLIED TO VOCAL
FOLD EDEMA DETECTION
Silvana Cunha Costa
Federal Center of Techological Education of Paraíba-CEFET-PB, Federal University of Campina Grande-UFCG
Av.1º de Maio, 720, João Pessoa, Paraíba, Brazil
Benedito G. Aguiar Neto
Federal University of Campina Grande-UFCG, Intitute of Technology of Washington
University of Washington
Tacoma, USA
Joseana Macêdo Fechine
Federal University of Campina Grande-UFCG, Campina Grande,Paraíba, Brazil
Menaka Muppa
Intitute of Technology of Washington -University of Washington Tacoma, USA
Keywords: Acoustic voice analysis, speech processing, acoustic features, cepstral parameters, disordered voices,
speech pathology.
Abstract: Digital signal processing techniques have been used to perform an acoustic analysis for vocal quality
assessment due to the simplicity and the non-invasive nature of the measurement procedures. Their
employment is of special interest, as they can provide an objective diagnosis of pathological voices, and
may be used as complementary tool in laryngoscope exams. The acoustic modeling of pathological voices is
very important to discriminate normal and pathological voices. The degree of reliability and effectiveness of
the discriminating process depends on the appropriate acoustic feature extraction. This paper aims at
specifying and evaluating the acoustic features for vocal fold edema through a parametric modeling
approach based on the resonant structure of the human speech production mechanism, and a nonparametric
approach related to human auditory perception system. For this purpose, LPC and LPC-based cepstral
coefficients, and mel-frequency cepstral coefficients are used. A vector-quantizing-trained distance
classifier is used in the discrimination process.
1 INTRODUCTION
A great range of diseases causes modifications in the
voice. These are related to the vocal tract
pathologies, as well as many others which are
provoked by neuro-degenerative diseases (Davis,
1979; Quek et al, 2002).
Voice quality of patients have been evaluated by
several techniques, most of which are based on
listening to the patient's voice and on the inspection
of the vocal folds through laryngoscopy. The first
method is subjective, which could provide different
results, depending of the professional experience.
The second one has the advantage of being more
accurate, but it requires high cost tools such as
special light sources and specialized video-camera
equipments. In addition, it is considered an invasive
technique, which may cause discomfort to the
patients
Non-invasive techniques based on acoustic
analysis of the speech signal can be used to
110
Cunha Costa S., G. Aguiar Neto B., Macêdo Fechine J. and Muppa M. (2008).
SHORT-TERM CEPSTRAL ANALYSIS APPLIED TO VOCAL FOLD EDEMA DETECTION.
In Proceedings of the First International Conference on Bio-inspired Systems and Signal Processing, pages 110-115
DOI: 10.5220/0001066901100115
Copyright
c
SciTePress

diagnosis and evaluation of medical treatments of
diseases which provoke vocal disorders. Moreover,
acoustic analysis can be employed to the precocious
detection of pathologies in the vocal folds or the
evaluation of the vocal quality of patients subject to
surgical processes in the vocal folds.
Some researchers have dedicated their efforts for
obtaining efficient methods to discriminate normal
and pathological voices using acoustic analysis
(Godino-Llorente et al, 2006; Shama et al, 2007;
Murphy and Akande, 2007; Dibazar et al, 2006;
Umapathy et al, 2005). Those methods have
employed techniques based on the estimation of
glottal noise, feature extraction from decomposed
time-frequency parameters, linear prediction
modeling-based measures and measures based on
auditory modeling. However, there is limited
agreement on which parameters are more suitable
for acoustic modeling of particular pathology. An
efficient and reliable acoustic modeling of the
pathology is necessary, when pattern classification
of vocal disorders is being used. Thus, the vector of
acoustic characteristics of the pathological voice
should be carefully chosen to be quite
representative.
In this research, techniques of digital signal
processing are used to carry out an acoustic analysis
of pathological voice. The study is focused on the
case of voice disorders provoked by edemas in the
vocal folds, using the evaluation of following
features: LPC coefficients, LPC-based cepstral
coefficients and mel-frequency cepstral coefficients.
The irregularities in the features of the normal voice
in comparison with the pathological voice are
observed and analyzed. A vector quantization
technique (VQ) was used associated with a
distortion measurement to classify the speech signal.
The VQ was trained with voices affected by the
considered pathology.
The results can be used in order to build an
effective method basis for detecting pathological
voices. The outline of the paper is as follows: basis
for an acoustic modeling of disordered voices,
database and methods, results and conclusions.
2 ACOUSTIC MODELING BASIS
Feature extraction of speech signals is frequently
employed to acoustic evaluation of pathological
voices. Specific statistical parameters based on the
linear model of speech production can be used as
significant acoustic features. It is known that the
voice signal is produced as a result of glottal pulses
or a signal varying randomly, like noise excitation
filtered by the vocal tract (Rabiner and Schafer,
1978).
Vocal fold pathology such as vocal fold edema
affects the vocal fold or other components of the
vibratory system, producing an irregular vibration.
In fact, it is widely known that pathological vocal
folds can present variation in the cycle of the
vibratory movement because of changes in the vocal
folds elasticity. This occurs due to incomplete
closure of the vocal folds in all glottal cycles. The
changes in the vocal folds morphology can provoke
significant modifications to the acoustic signal.
Although the pathology is located in the vibratory
system it can affect the regular articulatory
movement during the speech production.
Furthermore, components of the resonating system
can be affected, resulting in changes of the vocal
shape, producing irregularities on the spectral
properties. A modification in the fundamental
frequency and on the spectral shape can be observed
as a result of the vocal disorders (Godino-Llorente et
al, 2006).
The understanding of changes in the acoustic
features involving excitation and resonance effects is
the key to an efficient disordered voices modeling.
The speech signal contains information about both
vocal tract and excitation source.
The handle of the variability present in the
speech signal is one of the main challenges of
acoustic modeling. The variability arises from the
dynamic nature of the vocal tract. Thus, speech is
dynamic or time-varying and the modeling needs to
consider two aspects: 1) the explicit temporal
dependencies of the pathological voice, and 2) the
estimation of the features have to be based on
statistical short-time analysis. The model has to
represent the irregularities behaviour introduced by
the pathology itself.
Two parametric methods based on the linear
model for the human speech production mechanism
approaches have been considered on the literature so
far: 1) linear predictive coding (LPC) analysis; 2)
LPC-based cepstral analysis (Godino-Llorente et al,
2006, Marinaki et al, 2004, Parsa and Jamieson,
2001; Gavidia-Ceballos, 1996).
The LPC estimates each speech sample based on
a linear combination of the p previous samples; a
larger p enables a more accurate model. It provides a
set of speech parameters that represent the vocal
tract (Rabiner and Schafer, 1978). It is expected that
any change in the anatomical structure of the vocal
SHORT-TERM CEPSTRAL ANALYSIS APPLIED TO VOCAL FOLD EDEMA DETECTION
111

tract, because of pathology, affects the LPC
coefficients. A linear predictor with p prediction
coefficients, α
k
is defined as a system whose output
is
1
() ()( )
p
k
s
nksnk
α
=
=−
∑
%
(1)
In the LPC-based cepstral analysis is considered
that speech signal is the result of convolving
excitation with vocal tract sample response by
cepstral analysis, and it is possible to separate the
two components. One step in cepstral deconvolution
transforms a product of two spectra into a sum of
two signals. In practice, the complex cepstrum is not
needed. The real cepstrum suffices, obtained with
digital algorithm as follows (Rabiner and Schafer,
1978; O’Shaugnessy, 2000):
1
1
2/
( ) log[ ( )] 0,1,...., -1
0
N
jknN
cn X k e n N
N
k
π
−
∑
==
=
(2)
Cepstral coefficients can be computed
recursively from the linear predictor coefficients, α
i
,
by means of (Furui, 1981):
(1) (1)
1
() () (1 ) ( ) ( ) 1
1
c
i
k
ci i kci k i p
i
k
α
αα
⎧
=−
⎪
−
⎨
=− − − − < ≤
∑
⎪
=
⎩
(3)
Other authors have investigated the use of mel-
frequency cepstral (MFC) analysis which is a
measure based on the human auditory perception
system (O’Shaughnessy, 2000). A nonparametric
MFC-based approach can be derived from fast
Fourier transform (FFT-MFC) (Godino-Llorente et
al, 2006, Dibazar et al, 2006, Murphy and Akande,
2007, Bou-ghazale and Hansen, 2000).
Cepstrum analysis is based on the human
auditory perception system, which incorporates
some aspects of audition. This method provides a
logarithm relationship between the real and the
perceived frequency scales (mels). Mel-frequency
cepstral coefficients c(n) are calculated by means of
(O’Shaughnessy, 2000):
1
( ) log( ).cos[ ( )]. 0,1, ...., M,
M
2
1
M
cn S nk n
k
k
π
∑
=−=
=
(4)
where M is the number of mel bands in the mel scale
and S(k) is given by
( ) ( ). ( ) 1, ..., ,
1
NFFT
Sk W j X j k M
k
j
∑
==
=
(5)
where W
k
(j) is the triangular weighting windows
associated with the mel-scales, and X(j) is the NFFT-
point magnitude spectrum (Godino-Llorente et al,
2006, O’Shaughnessy, 2000).
A common model for the relationship between
frequencies in mel and linear scales is as follows
(O’Shaughnessy, 2000):
10
()
2595 log (1 ),
700
linear
mel
FHz
F =⋅ +
(6)
where F
linear
is the linear frequency (in Hertz), and
F
mel
is the perceived frequency (in Mel).
3 DATABASE AND METHODS
The database used in this work was recorded by the
Massachusetts Eye and Ear Infirmary (MEEI) Voice
and Speech Lab (Kay Elemetrics, 1994). It includes
more than 1,400 voice samples (i.e., sustained /a/)
from approximately 700 subjects. The database
including samples from patients with a wide variety
of voice disorders, was collected in a controlled
environment with the following features: low-noise-
level, constant microphone distance, direct digital
16-bit sampling and robust signal conditioning.
Sampling rates of 25 kHz (pathological voices) or
50 kHz (normal voices) were employed. The normal
voice signals were downsampled to 25 kHz, to
maintain the same sample frequency to all signals.
The selected cases of people presenting edemas
in the vocal folds are: 33 women (17 to 85 years old)
and 11 men (23 to 63 years old), most of them (32)
with bilateral edema. The database of normal voices
is composed of 53 patients - 21 male (26 to 59 years
old), and 32 female (22 to 52 years old). We also
used 23 signals, under other pathologies, such as
cysts, nodules and paralysis (07 male and 16 female
voices).
First, a 20 ms Hamming window with an overlap
of 50% is employed to obtain frames from the
dataset for the short-term voice analysis.
A Vector Quantization technique is employed in
the classification process, associated with a
distortion measurement to discriminate among
voices affected by vocal fold edema, normal voices
and voices presenting other vocal fold pathologies.
The Vector Quantization is carried out individually
for each feature using just voices under vocal fold
edema. Thus, different VQ-trained distance
classifiers are obtained by the discrimination
process. The VQ-classifiers are applied to static
BIOSIGNALS 2008 - International Conference on Bio-inspired Systems and Signal Processing
112
feature vectors, which are computed for every 10 ms
frame of the speech samples over a dynamic input
sustained vowel /a/.
A codebook is generated, after the feature
extraction, consisting of N discrete level generation
that each input vector could assume. An N-level
vector quantizer can be defined as a mapping Q of a
K-dimensional Euclidean space R
K
into a finite
subset W of R
K
, such as Q:R
K
→W.
The codebook W={w
i
; i=1, 2, ….N} is the set of
codevectors, K is the dimension of the quantizer and
N is the number of codevectors in W.
The mapping Q assigns to a K-dimensional real-
valued input vector x a K-dimensional codevector
w
i
=Q(x). VQ defines a partitioning of the K-
dimensional Euclidean space into non-intercepting
cells S
i
= {x : Q(x) = w
i
}, i = 1, 2, …, N.
As the Voronoi cell, S
i
, collects together all input
vector mapping to the i-th codevector, the
codevector w
i
may be viewed as a pattern-class label
of the input patterns belonging to S
i
.
The mapping of the input vector x to a
codevector w
i
occurs if the distortion function is
such as d(x,w
I
) < d(x,w
i
),
∀
i
≠
I.
It follows the nearest neighbour rule is applied to
find the codevector that presents the greatest
similarity to x. In this work, LBG algorithm and the
least mean square distance were used (Linde et al,
1980).
4 RESULTS AND DISCUSSION
To reduce the dimensionality of feature vectors, a
Vector Quantizer (VQ) to each parameter was
employed, using dimension K=12 and N=64 levels.
The VQ was trained with 20 voice signals under
vocal fold edema. In the test phase 53 normal voices,
24 signals under vocal fold edema and 23 speech
signals of speakers, affected by other vocal fold
pathologies as nodules, cysts and paralysis, were
used. The Euclidean distance measure to classify the
signals was used to analyze the effect of pathologies
in vocal tract response. For this purpose, LPC,
cepstral and mel-cepstral coefficients were extracted
from the database signal.
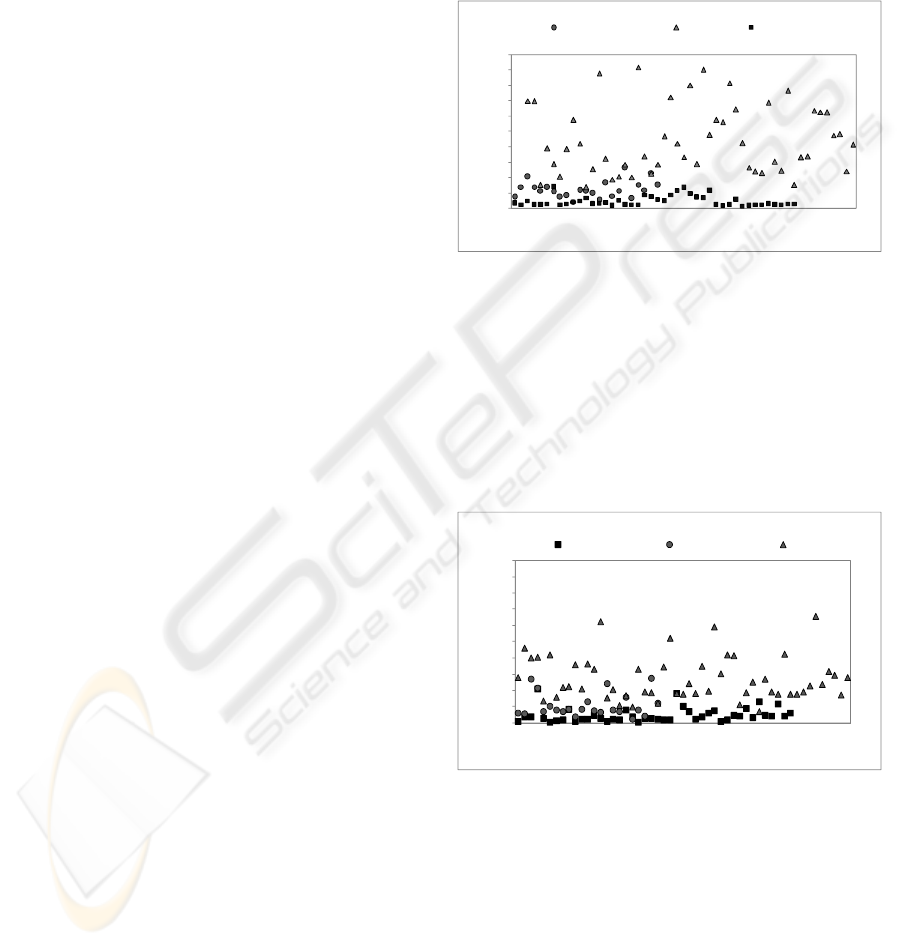
A predictor order p=12 was applied the LPC
analysis. The LPC coefficients were obtained using
the autocorrelation method by Levinson-Durbin
algorithm (Rabiner and Schafer, 1978). Figure 1
shows the distribution of vocal fold edema, normal
voices and other pathologies. It is clear the excellent
separation of the two classes analyzed: normal
voices and voices affected by vocal fold edema. This
results in a high correct rejection rate. In
comparison, the edema behaviour and the other
pathologies have a certain similarity that suggests
difficulties in recognizing each pathology.
A threshold value to provide the best separation
between the classes in the classification process was
chosen. For cepstral analysis it was used an
algorithm based on Eq. (3). A number of 12
coefficients were obtained and the same process of
quantization used to LPC method was employed.
0
0,1
0,2
0,3
0,4
0,5
0,6
0,7
0,8
0,9
1
1 3 5 7 9 11131517192123252729313335373941434547495153
Distort ion
Voice signals
other pathologies normal vocal fold edema
Figure 1: Distortion behaviour for normal, vocal fold
edema and other pathologies, obtained by Euclidian
distortion on LPC method.
The behaviour of classes, on cepstral
analysis, is shown in Figure 2. The graphic provides
a great way to observe the relevance of each
parameter in classifying a pathological voice. The
good separation of normal and pathological voices is
well defined as in LPC method.
0
0,1
0,2
0,3
0,4
0,5
0,6
0,7
0,8
0,9
1
1 3 5 7 9 11 13 15 17 19 21 23 25 27 29 31 33 35 37 39 41 43 45 47 49 51 53
Distort ion
Voice signals
vocal f old edema ot her pathologies normal
Figure 2: Distortion behaviour for normal, vocal fold
edema and other pathologies obtained by Euclidian
distortion on cepstral method.
The number of filter bank bands employed to
MFCC method was 30 (3ln(Fs), where Fs is the
sampling frequency (Fs = 25kHz) and a number of
12 MFC coefficients were obtained as described in
section 2. An algorithm of Voicebox - Speech
Processing Toolbox for MATLAB
(http://www.ee.ic.ac.uk/hp/staff/dmb/voicebox) was
used.
SHORT-TERM CEPSTRAL ANALYSIS APPLIED TO VOCAL FOLD EDEMA DETECTION
113
The behaviour of classes in mel-cepstral method is
presented in Fig. 3. In this method, as in the others, it has a
good separation of normal and pathological voices.
However, the differences among the pathologies are not
evident. LPC and cepstral methods seem to be better in
representing the pathologies specificities.
0
0,05
0,1
0,15
0,2
0,25
0,3
0,35
0,4
0,45
1357911131517192123252729313335373941434547495153
Distort ion
Voice signals
other pathologies normal vocal fold edema
Figure 3: Distortion behaviour for normal, vocal fold
edema and other pathologies obtained by Euclidian
distortion on mel-cepstral method.
The evaluation of performance was made by the
use of the following measurements: 1) Correct
acceptance rate (CA), in which the presence of the
pathology is detected when that is really present; 2)
Correct rejection (CR), that gives the rate of the
detection of the correct absence of the pathology; 3)
False acceptance rate (FA) that detects the presence
of the pathology when it is not present; 4) False
rejection rate (FR), that quantifies the rejection of
the presence of the pathology when, in fact, it is
present.
Related to the rates mentioned it was computed:
• Specificity - SP: represents the likelihood that
the pathology is detected when it is present,
given by SP=CR/(CR+FA)x100.
• Sensitivity – SE: represents the likelihood that
the pathology is detected when it is present,
obtained by SE(%)=(CA/(CA+FR)x100.
• Efficiency-E: gives the correct classification of
a given class when that is present given as
E(%)=(CR+CA)/(CR+CA+FA+FR)x100.
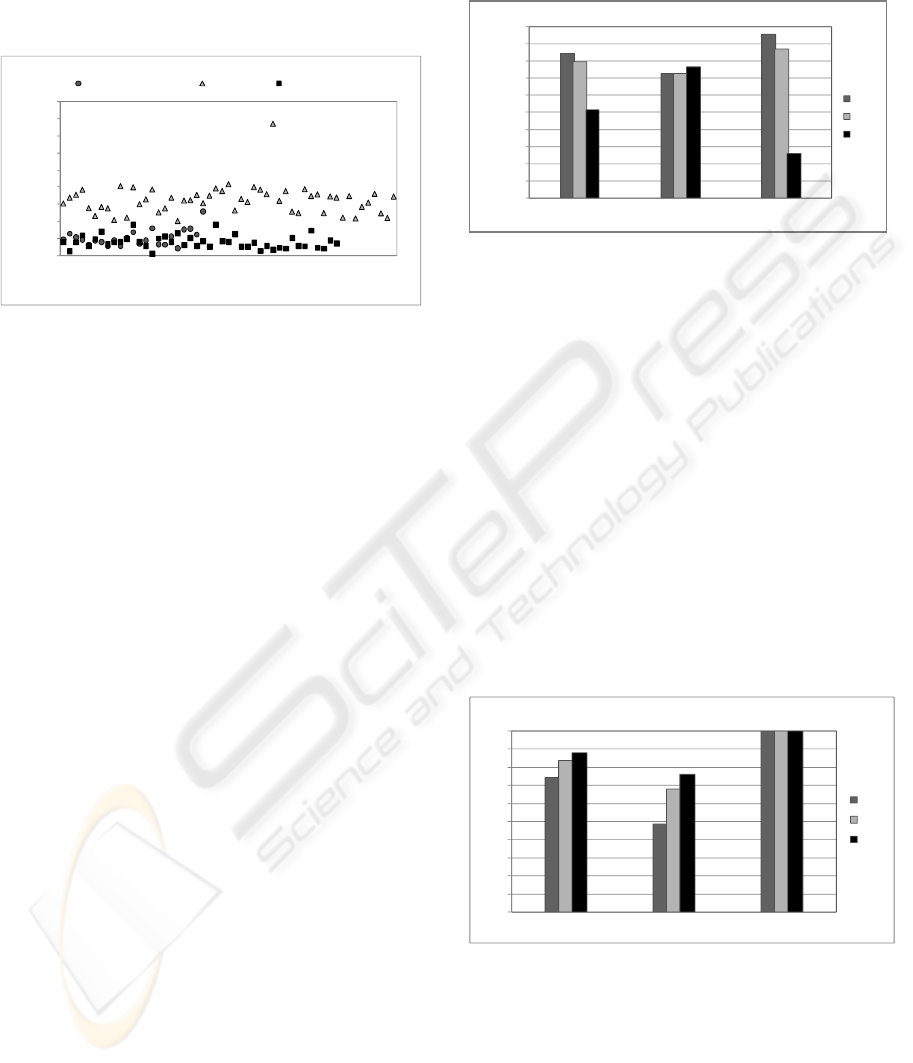
Figure 4 presents results to the measurements
above obtained for the three applied methods
considering other pathologies as a separate class of
edema. It is seen that LPC gives the best method.
However, the false rejection rate obtained for this
method was 27%. It is important to emphasize that
the classifier was trained to accept vocal fold edema
signals and reject any other signal as being
pathological.
It is also observed that mel-cepstral method was
not efficient in discriminating each pathology class.
Mel-cepstral analysis represents the perceptual
auditory aspect that is similar in some vocal fold
pathologies as nodule, cyst and edema.
0
10
20
30
40
50
60
70
80
90
100
E ( %) SE ( %) SP ( %)
LPC
CEP
MEL
Figure 4: Performance evaluation considering vocal fold
edema and the other pathologies as different classes.
The hoarseness and severely noisy-speech are
some of common aspects that occur to speakers
affected by the mentioned pathologies. The ability of
MFCC method in representing the irregular
vibration of vocal folds is common in the
pathologies in this study and it is reflected on the
results. The behaviour of the pathological signals is
similar in mel-cepstral domain. Therefore, to
discriminate pathologies occurring on vocal folds is
not an easy task.
Figure 5 shows a comparison of the LPC,
cepstral and mel-cepstral methods, when using the
classifier to all pathologies in the same classes. It is
clear that mel-cepstral method is better than the
other methods in representing the behaviour
differences of the pathological signals relating to
normal cases.
0
10
20
30
40
50
60
70
80
90
100
E ( %) SE ( %) SP ( %)
LP C
CEP
MEL
Figure 5: Performance evaluation considering vocal fold
edema and the other pathologies in the same class.
The ability of methods employed in rejecting
correctly the classes out of classifier training class is
excellent (SP).
Figure 6 shows results obtained for Specificity,
Efficiency and Sensitivity comparing pathological
voices under vocal fold edema and normal voices.
BIOSIGNALS 2008 - International Conference on Bio-inspired Systems and Signal Processing
114
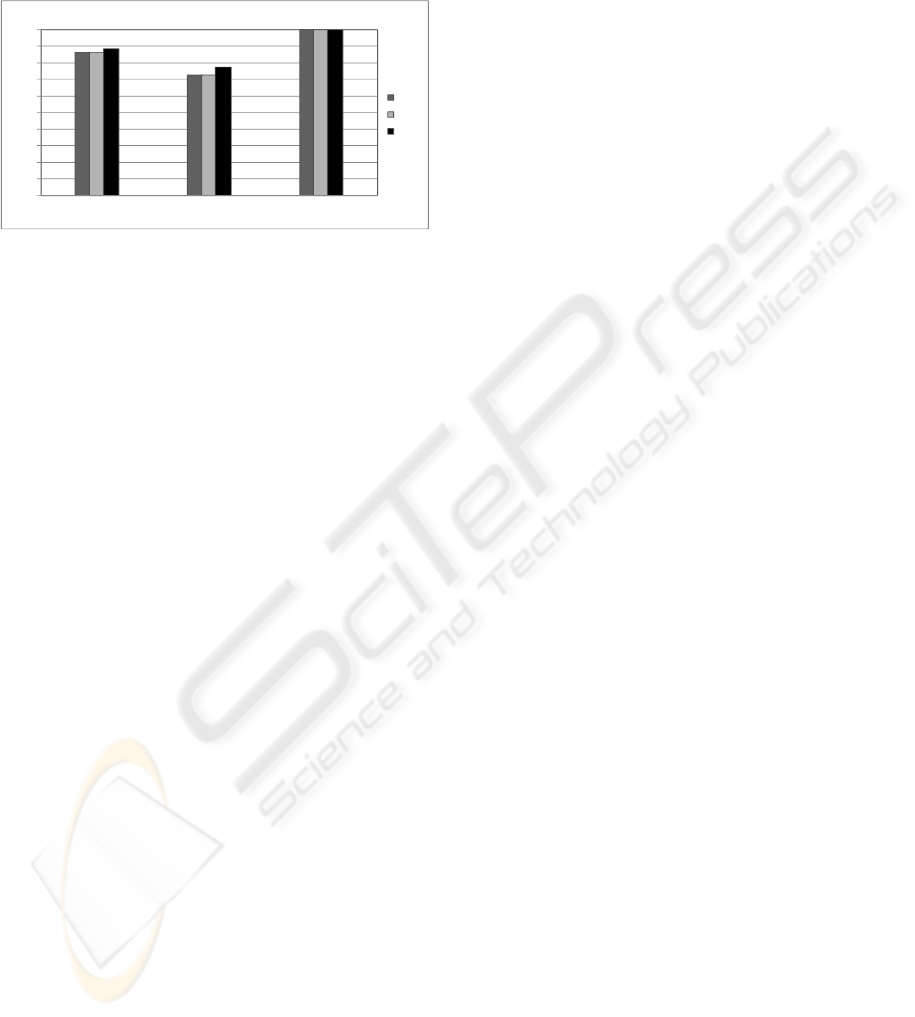
The other pathologies are not considered here. The
ability of FFT-MFCC in modeling the irregular
vibration of the vocal folds provoked by the
pathology is shown in the results. Good results are
also obtained to LPC and cepstral analysis.
0
10
20
30
40
50
60
70
80
90
100
E ( % ) SE( %) SP ( %)
LPC
CEP
MEL
Figure 6: A comparison of the performance evaluation of
LPC, cepstral and mel-cepstral analysis to the cases of
vocal fold edema and normal voices.
5 CONCLUSIONS
The changes on LPC, cepstral and mel-cepstral
coefficients describe the abnormal behaviour of the
vocal folds movements caused by the pathologies.
The efficiency in characterizing pathological voices
using short-time cepstral analysis is well described
by results.
It is noted that mel-cepstral coefficients are very
good to detect the presence of pathology. They
provide a good separation of normal and
pathological voices. However, this method is not
efficient in discriminating distinct pathologies. The
differences among pathologies which belong to
similar class of diseases are not evident. LPC and
cepstral methods seem to be better in representing
the pathologies specificities.
In order to improve the performance of the
classification process, two aspects are suggested: 2)
the use of non-linear analysis to improve the
acoustic modeling of non-linear characteristics
inherent to speech signal, and 2) the employment of
other classifiers based on Artifitial Neural Networks
or Hideen Markov Models, for example.
REFERENCES
Bou-Ghazale, S.E., Hansen, J.H.L., 2000. A Comparative
Study of Traditional and Newly Proposed Features for
Recognition of Speech Under Stress. IEEE
Transactions on Speech & Audio Processing. Vol. 8,
no. 4, pp. 429-442, July.
Davis, S. B, 1979. Acoustic Characteristics of Normal and
Pathological Voices. Speech and Language: Advances
in Basic Research and Practice. Vol. 1, pp. 271–335.
Dibazar, A. A., Berger, T.W., and Narayanan, S. S., 2006.
Pathological Voice Assessment. Proceedings of the
28th IEEE EMBS Annual International Conference.
New York, USA, Aug. 30-Sept. 3.
Furui, S., 1981. Cepstral Analysis Technique for
Automatic Speaker Verification. IEEE Transactions
on Acoustics, Speech and Signal Processing. Vol. 29,
No. 2, pp 254-272, April.
Gavidia-Ceballos, Liliana and Hansen, John H. L., 1996.
Direct Speech Feature Estimation Using an Interactive
EM Algorithm for Vocal Fold Pathology Detection.
IEEE Trans. on Biomedical Engineering. Vol. 43, No.
4, April.
Godino-Llorente, J. I., Gomes-Vilda, P. and Blanco-
Velasco M., 2006. Dimensionality Reduction of a
Pathological Voice Quality Assessment System Based
on Gaussian Mixture Models and Short-Term Cepstral
Parameters. IEEE Transactions on Biomedical
Engineering. Vol. 53, No. 10, pp. 1943-1953, October,
Kay Elemetrics Corp. Disordered Voice Database, 1994.
Model 4337, 03 Ed.
Linde, Y., Buzo, A., and Gray, R. M., 1980. An Algorithm
for Vector Quantizer Design, IEEE Transaction on
Communications. Vol. COM-28, N0.I, pages 84-95,
January.
Marinaki, M., Contropoulos, C., Pitas, I., and Maglaveras,
N., 2004. Automatic Detection of Vocal Fold
Paralysis and Edema, Proc. of 8th Conf. Spoken
Language Processing (Interspeech 2004). Jeju, Korea,
October.
Murphy, Peter J. and Akande, Olatunji O., 2007. Noise
Estimation in Voice Signals Using Short-term
Cepstral, Journal of the Acoustical Society of America.
pp. 1679-1690, Vol. 121, No. 3, March.
O’Shaughnessy, Douglas, 2000. Speech Communications:
Human and Machine. 2nd Edition, NY, IEEE Press.
Parsa, Vijay and Jamieson, Donald G., 2001. Acoustic
Discrimination of Pathological Voice: Sustained
Vowels versus Continuous Speech. Journal of Speech,
Language, and Hearing Research. Vol. 44, pp 327–
339, April.
Quek, F., M. Harper, Haciahmetoglou, Y., Chen, L. and
Raming, L. O., 2002. Speech pauses and gestural
holds in Parkinson´s disease. Proceedings of
International Conference on Spoken Language
Processing. pp. 2485-2488.
Rabiner L. R. and Schafer R. W., 1978. Digital Processing
of Speech Signals. New Jersey: Prentice-Hall.
Shama, K., Krishna, A. and Cholayya, N. U., 2007. Study
of Harmonics-to-Noise Ratio and Critical-Band
Energy Spectrum of Speech as Acoustic Indicators of
Laryngeal and Voice Pathology. EURASIP Journal on
Advances in Signal Processing. Vol. 2007.
Umapathy, K., Krishnan, S., Parsa, V., and Jamieson D.,
2005. G. Discrimination of Pathological Voices Using
a Time-Frequency Approach.
IEEE Transactions on
Biomedical Engineering. Vol. 52, No. 3, March.
SHORT-TERM CEPSTRAL ANALYSIS APPLIED TO VOCAL FOLD EDEMA DETECTION
115
