
OTOLITH IMAGE ANALYSIS BY COMPUTER VISION
Anatole Chessel, Ronan Fablet
IFREMER/LASAA, France
Charles Kervrann, Frederic Cao
IRISA/VISTA, France
Keywords:
Computer vision, otolith, fish biology and ecology, biological image analysis, detection a contrario, variational
methods.
Abstract:
Otoliths are small stone located in fish inner ears and characterised by an accretionnary growth. They act
as a biological archive and are of much use in marine biology and ecology. In this article a computer vision
framework is presented which recover the successive shapes of the otolith and the significant ridges and valleys
from a 2D grayscale image. Seeing vision processes as complex systems, an iterated process is presented using
two perceptual information, contrast and good continuity. The successive concentric shapes of the otoliths are
recovered as the level-sets of a dome shaped potential function, computed in a variational framework. Potential
applications includes in particular fish age estimation, otoliths morphogenesis modelling, otolith proxy fusion.
1 INTRODUCTION
Otolith are small stones located in fish inner ears used
for their spatial localisation. They grow continuously
according to an accretionnary process. As the accre-
tionary deposit is influenced both by physiological pa-
rameters and environmental conditions, fish otoliths
can be viewed as biological archives from which a lot
can be learned on fish biology and ecology. For in-
stance, individual age data, which are among the key
data for fish stock assessment, are estimated from the
interpretation of fish otoliths.
The decoding of this biological archive is a diffi-
cult task, as the conditions influencing the accretion
are numerous, and their effects not well known (Pan-
fili et al., 2002). Various means of analysis of the
physical and chemical properties of the stone can be
used: microchemical analysis, mass or raman spec-
troscopy etc... Visual analysis of images of magni-
fied otolith sections are also used but, being done by
human operator, they would benefit a lot from com-
puter vision techniques to improve automatising, ro-
bustness and quantitative evaluation. Such techniques
would allow to fully consider the image as yet an-
other mean of quantitative measurements similar for
instance to chemical signatures (Panfili et al., 2002).
An otolith image can be seen in Figure 1. Con-
centric structures akin to the one found in tree trunk
section can clearly be seen. Several works have tried
to extract those curves, using multi-agent methods
(Guillau et al., 2002) or active contours (Troadec
et al., 2000). While yielding good results on the
species considered as easy by expert (like plaice),
they failed on more complicated images (like pollock
or hake), because the hypothesis made were too re-
strictive.
The vision of concentric structures in otolith im-
ages are the result of complex global interactions be-
tween heterogeneous visual cues interpreted by the
human vision system : what we see are continuous
and smooth parallel concentric curves forming quasi-
convex shapes. The analysis of low-level vision pro-
cesses will lead to the definition of an original ap-
proach for the extraction of the relevant curves, and
the recovery of the successive shapes of the otolith
during its growth. Thus a novel framework for ge-
ometric images understanding applied to otoliths is
proposed, the results of which can be seen in Fig. 1.
This paper is organized as follow. The next sec-
tion presents a psychovisual analysis of otoliths and
an overview of the framework with which we imple-
ment its conclusion. In section 3 the different steps
are detailed. The last section details the implementa-
tion and shows results on several species.
490
Chessel A., Fablet R., Kervrann C. and Cao F. (2008).
OTOLITH IMAGE ANALYSIS BY COMPUTER VISION.
In Proceedings of the First International Conference on Bio-inspired Systems and Signal Processing, pages 490-497
DOI: 10.5220/0001067204900497
Copyright
c
SciTePress
Good
continuation
medial axis
Alpha−shape
A contrario detection
Initialisation
estimation Emergence via iterationOrientation
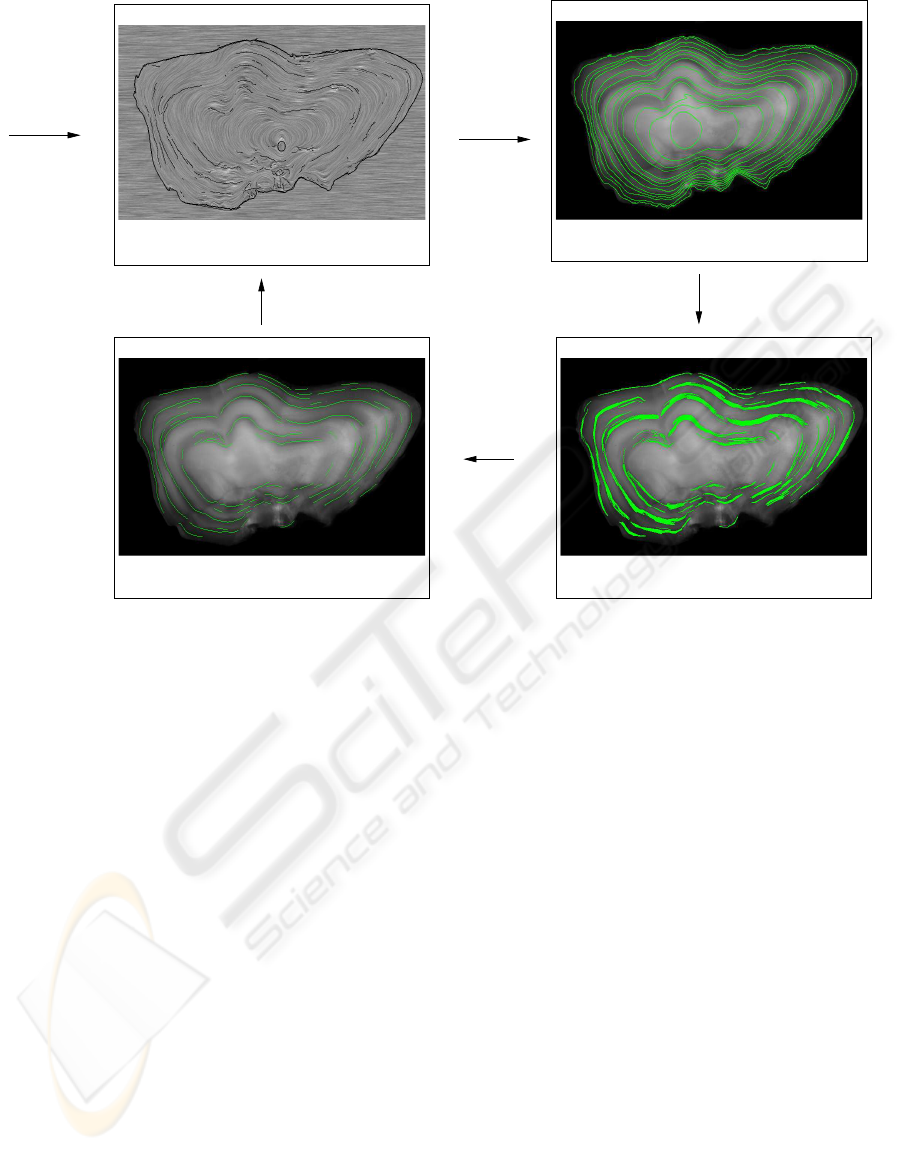
Figure 1: Overview of the process.
2 PSYCHOVISION AND CURVE
EXTRACTION IN OTOLITHS
Psychovision is the study of vision from a subjective
point of view: how do we manage to organize the
wealth of information that reaches the retina into co-
herent structures? It is based on experiments where
subjects are asked to describe how they perceive given
stimuli. This section will be devoted to what psycho-
vision can teach us about otolith images and how we
can apply it in practice.
2.1 Perceptual Emergence from
Interaction
Low-level vision is the part of vision (either biologi-
cal or computer) that builds global structures (or per-
cepts) i.e. curves, regions, depth perception, etc...
from atomistic information, the pixels in one case and
the cones and rods of the retina in the other. This
process has been much studied, in particular by the
Gestalt school of visual perception (Kanizsa, 1979).
They described the transition from local informa-
tion to global percepts as the action of a number of
grouping laws stating that individual cues having sim-
ilar or compatible characteristics are seen as being
part of the same group (Kanizsa, 1979). Those char-
acteristics include color, direction, spatial proximity,
global shape priors or specific structuring patterns like
T-junction and X-junction.
But those laws interact one with the others, either
reinforcing one another if they correspond to the same
object, or inhibiting or masking one another if several
interpretations of a scene are possible. Thus low-level
vision can be seen as the process in which global per-
cepts emerge from the complex interactions between
perceptual cues and group of perceptual cues.
This description is based on the notion of emer-
gence, which is characterised by the existence, in a
hierarchy of organizational levels, of properties at a
given level which are not explainable by/ reducible
to the individual properties of elements of the lower
levels. It is characteristic of complex systems (Benki-
rane, 2002). Such systems are notoriously difficult to
understand and model because, every element being
tied in non-linear ways with a great number of oth-
ers, it is hard and/or unhelpful to try and study them
separately.
OTOLITH IMAGE ANALYSIS BY COMPUTER VISION
491

2.2 Psychovisual Analysis of Otoliths
Otoliths are in some sense closer to artificial im-
ages used in psychovisual experiments than to natu-
ral ones. They are strongly organized geometrically
in concentric curves alternatively darker and lighter
which, despite a low contrast and various noises, are
clearly seen event by an untrained eye. A num-
ber of grouping laws are involved in that perception:
good continuation, concentricity and parallelism of
the curves, quasi-convexity of the shapes, constant
width of the rings. As all those informations describe
the same structures, they reinforce one another, in
positive feedback loops.
But most of those grouping laws work on a global
scale. The problem might seem easy because otolith
images are easily described subjectively as concentric
curves, but saying so would be being triked by the
ability of human vision to disregard all the cues that
do not match its global view of an object. A care-
ful analysis (or indeed any computer program which
would lack that particular ability of the human eye)
shows that there is locally a number of details that go
against that interpretation, like flat zones, bubbles or
isolated orthoradial structures. In the case of otoliths,
two cues are mainly used: orientation, via the good
continuation gestalt, and maxima of contrast. The
proposed framework will alternatively use those two
information and the coherence between them to find
the global structure of the image.
2.3 Proposed Framework
The growth rings on otolith images correspond to
ridges and valleys (together known as creases) in
computer vision. Those are intuitively the relief
curves of the landscape obtained when the image in-
tensity is seen as a height map. As pointed out above,
their perception is mainly the result of two grouping
laws, one concerned about contrast, locating creases
on local maxima or minima of intensity, the other be-
ing the good continuation, grouping together those
loci forming curves long and smooth enough. In a
first part of the algorithm the good continuation is
exploited to compute a continuous orientation based
family of curves, which in a second part is compared
with contrast information to extract only the relevant
creases. We should point out that both of those results
are of interest for biological applications. While the
computed family of curves correspond to the tempo-
ral history of the shapes of the otoliths, the extracted
crease curves supply the actual growth rings. The dif-
ferent steps are outlined bellow, in relation with Fig-
ure 1, and will be detailed in the next section.
The first component of the proposed frame-
work implements the good continuation principle for
otoliths images. Good continuation is the grouping
law that account for our viewing of continuous and
smooth curves (Kanizsa, 1979). If perceptual cues
have compatible directions, the curve to which they
are all tangent will be seen as a unique curve. Orien-
tation information has a key role and an interpolation
based scheme is considered to estimate a dense orien-
tation field. An example is shown Figure 1, top left.
Details are in section 3.1. Then, given a prior model
on accretionary growth, formalised as a dome-shaped
potential function, the successive shapes of the otolith
are reconstructed as being as tangent as possible to the
orientation field. This model permits an embedding of
time information in a third dimension satisfying both
biological and psychovisual constraints. The result
can be seen Figure 1, top right. The algorithm used
will be detailed in section 3.2.
The implementation of the good continuation pro-
vides as an output a series of curves which are po-
tential growth rings. A contrario detection is then ex-
ploited to combine this geometric information with a
contrast based measure to detect crease curves. This
step is illustrated figure 1, bottom right. Detail on a
contrario detection and the measure used are found
section 3.3. Intrinsically a contrario detection will de-
tect several curves for a given growth rings, and an
additional grouping law is required to fuse together
the curves corresponding to a same structure. The re-
sult is seen Figure 1, bottom left. Section 3.4 will
outline the algorithm used, full detail can be found in
(Chessel, 2007).
As stressed previously, low level vision is about
emergence by interaction. In the proposed implemen-
tation, those interactions comes from feedback loops,
both positives and negatives. Section 3.5 describes
how iteration can be used in place of those feedback
loops to mimic the emergence process and allow for
the progressive apparition of the structures we seek.
3 FROM GOOD CONTINUATION
TO ITERATED MULTIMODAL
A CONTRARIO DETECTION
3.1 Good Continuation via Orientation
Interpolation
Good continuation has attracted much work in the
computer vision community. Often an image of
edgels -”edge elements”, point supposed to be part
of an curve along with the orientation of said curve
BIOSIGNALS 2008 - International Conference on Bio-inspired Systems and Signal Processing
492

at that point- is taken as input, and continuous and
smooth curves that link them are looked after (Parent
and Zucker, 1989; Zweck and Williams, 2004).
Good continuation can be interpreted as an inter-
polation process. Either directly the interpolation of
curves , Euler’s elastica (Mumford, 1994) being then
seen as a suitable and elegant solution, or through ori-
entation interpolation. The idea is then to build, from
a sparse edgel image, a dense orientation field where
to each point is associated the tangent to an eventual
structure going through that point. Curves in accor-
dance with the good continuation principle are then
the one the most tangent to that orientation field
In the case of otoliths, as outlined in the preceding
section, such a field is particularly meaningful. The
whole image can be described by concentric struc-
tures, and as such an orientation can be associated to
each point. Furthermore, a biological interpretation
can be associated: under the widely accepted hypoth-
esis that variation of optical properties are linked to
the biological growth, recovering the tangents to the
structures means recovering the local direction of ac-
cretionary growth.
In (Chessel et al., 2006) two interpolation opera-
tors are presented. Orientation data belong to the unit
circle S
1
= {x ∈ R
2
| |x| = 1}. But extending data
in S
1
poses additional challenges to extending scalar
data. To the innate ambiguity of interpolation, one has
to manage an ambiguity due to the periodic nature of
S
1
and the need to use two maps to parametrize it.
We then can distinguish two cases. Either the exten-
sion can be achieved by a laminar field, meaning one
parametrisation is enough and the extension in S
1
is
similar to the scalar case, or a turbulent field is needed
and singularities are unavoidable. The hypothesis that
can be made in the general case is that the field to
be estimated is locally laminar: near each curvilinear
structures a smooth field can be reconstructed, and far
from them such an orientation field is meaningless. In
the particular case of otoliths, a unique singularity is
expected in the growth center.
The AMLE (Absolutely Minimizing Lipschitz
Extension) is the extension operator used, it veri-
fies an axiomatic approach (Chessel et al., 2006).
It has been well studied mathematically. Existence
and uniqueness has been proved in the scalar case
((Caselles et al., 1998) and its references). In particu-
lar, it verifies a maximality principle which guarantee
that the solution is oscillation-free.
Let Ω be a subset of R
2
. Let S
1
be parametrise
with the angle with the horizontal axis in [0, pi[. Let
D ⊂ Ω be a set of points and/or curves and θ
0
: D →
S
1
. Then θ : Ω → S
1
is the AMLE of θ
0
in Ω if:
(
D
2
θ(Dθ, Dθ) = 0 in Ω,
θ|
D
= θ
0
on D,
(1)
i.e. if the second derivative in the direction of the gra-
dient is equal to zero.
Numerically the equation was solved using the as-
sociated evolution problem. Because of the aforemen-
tioned ambiguity associated with the use of S
1
, and
the iterative nature of that scheme, a multi-resolution
initialisation algorithm was used.
The set D of initial points can be obtained in var-
ious ways, as we will see later. An example of com-
puted field can be seen Figure 1, the inital point be-
ing in black. The field is visualised via it’s field lines
using line integral convolition (Cabral and Leedom,
1993).
3.2 Recovering Shape Evolution
In this section is presented the representation of the
otolith growth via its successive shapes and a way of
computing such a representation from an image using
the computed orientation field (Fablet et al., 2006).
Such a representation stem from both biological mod-
elling and computer vision constraint and algorithms.
It is of interest both for itself, as the history of the
shapes taken by the otolith, and as a mean of comput-
ing curves candidates to be growth rings, as used in
the next section.
y
Now
t=t0
t
t=0
Otolith image
x
Figure 2: The successive shapes of the otoliths are repre-
sented as the level-lines of a dome shaped potential.
As suggested in the seminal work of D’arcy
Thompson (D’arcy Thompson, 1917), we adopt a
level-set setting to represent the accretionary growth
process. It comes to introduce a potential function
U defined over R
2
such that the shape Γ
t
(U) of the
considered biological structure within a given obser-
vation plane at time t is given by the level set of U,
Γ
t
(U) = {p ∈ R
2
such that U(p) = f(t)}, (2)
OTOLITH IMAGE ANALYSIS BY COMPUTER VISION
493

where f is a strictly monotonic continuous function
(see Figure 2). Given U, the sequence of level sets
{Γ
t
(U)}
[0;T]
represents the evolution of the shape
from time 0 to time T. This representation conforms
to the classical assumption that accretionary growth
is locally normal to the shape and thus that the shapes
are included one in another (there is no reabsorbtion
of the growth). But that representation also complies
naturally to many of the low-level vision constraints
defined earlier: thanks to it, we are bound to find
smooth quasi-convex and concentric parallel curves.
The potential U is computed using a variational
algorithm as the smooth potential following the previ-
ous definition that is the most tangent to θ, the orien-
tation field computed section 3.1. Let I be the otolith
image. Let θ be the computed orientation field with
value in [0, π[. Then the hill-shaped potential function
U, with minimum value 0 on the outline and maxi-
mum 1 in the center is computed as the minimum of
an data driven regularized energy
U = argmin
U
Z
x∈R
2
|∇U(x)|(1+ γ ·
∇U(x)
|∇U(x)|
, θ(x)
2
)dx
(3)
It tends to align the tangents to the level-line of U to
the computed field θ. The successive shapes of the
otolith during its growth are then estimated via the
successive and concentric level-sets of U.
3.3 A Contrario Detection
3.3.1 Principles
The a contrario detection relies on the Helmoltz prin-
ciple, which states that a given geometrical structure
in an image is perceptually meaningful if its proba-
bility of occurrence in a random image is low enough
(Desolneux et al., 2003). Thus, given a collection of
objects the assumption is made that they were ran-
domly generated: a false random probability law is
defined and meaningful objects are the ones that are
unlikely enough with respect to this false model. It
can be seen as an implementation of a perceptual
grouping law, with the objects being the prospec-
tive perceptual groups and the random probability law
defining the considered gestalt law.
Formally the a contrario detection is stated as fol-
low. Let I be a grayscale image. Let C be a set of
curves extracted from I and C
p
the set of all pieces
of curves from C . Let M be a measure of creaseness
(grayscale image) on I. Let H(m) =
1
N
#{x|M(x) >
m}, with N = #{x ∈ I}, be the probability for a point
of I to have a creaseness measure greater than m.
Definition 1 Let c ∈ C
p
be a curve of lenght l and
m = min
x∈c
M(x). The number of false alarms of that
event is defined as
NFA(c) = |C
p
| × H(m)
l
(4)
Let ε ∈ R . A given piece of curve c is said to be ε-
meaningful if NFA(c) < ε.
Ultimately the detection is based on the length of
the curves and the minimum of the creasness mea-
sure along them: between two curves with the same
minimal contrast the more meaningful one will be the
longer one.
The influence of ε has been shown to be small
(Desolneux et al., 2003), such that a contrario detec-
tion can be considered to be parameterless.
The clear separation between the geometric struc-
tures being worked on and the random model telling
us a contrario the relevant ones allows us to see the
process as mutimodal (i.e. different cues brings in
several distinct types of information). Indeed the geo-
metric structures, which here are not generic but pre-
computed, are completely independent from the noise
model, and are based on different geometric cues.
Hence, if none the less a correlation between the two
is detected, it stresses the existence of an underlying
geometrical structure in the original image: what we
are interested in is how much the two distinct infor-
mations ultimately describe the same object.
3.3.2 A Set of Candidate Curves
In the previous section was computed a continuous
potential function U, implementing the good contin-
uation principle. It will be used to give us a set of
curves that are likely candidates for the growth rings
we want to extract. Let Γ
λ
= {x|U(x) = λ} be the
level-set of value λ ofU, then if N is the wanted num-
ber of curves, we set
C = {Γ
λ
|λ =
k
N
, k = 1...N} (5)
3.3.3 A Contrast based Measure
A lot of works have studied the local differential prop-
erties of images to define their ridges and valleys(Ser-
rat et al., 2000; Sole et al., 2001). The two main cri-
terion are maxima of intensity in the direction of the
maximal curvature and maxima of level-line curva-
ture.
Given the Hessian (the matrix of the second order
derivatives), the chosen measure is the greatest hes-
sian eigenvalue, or equivalently the greatest principal
curvature. It is clear that it is maximal on the crease,
it is not too localised contrary to the maxima of the
level-line curvature and its sign allows us to differen-
tiate ridges and valleys. The fact that it also responds
BIOSIGNALS 2008 - International Conference on Bio-inspired Systems and Signal Processing
494

well on edges may be a drawback. But this is not
problematic in our case as otoliths are rather flat im-
ages and the only edge in otolith image is the rim,
which is treated separately anyway. So if λ
1
and λ
2
are the two eigenvalues of the hessian of I, associ-
ated with eigenvectors v
1
and v
2
, λ
1
> λ
2
, we define
a ridge measure to be
M(x) = λ
+
1
(x) =
(
λ
1
(x) if λ
1
(x) > 0
0 else,
(6)
and conversely λ
−
1
for a valley measure.
3.4 Curve Fusion via Alpha Shapes
A contrario detection is about detection and not op-
timisation, thus a number of pieces of curves are de-
tected as meaningful for a given crease. A step of
grouping is necessary, which compute a unique curve
from a given group. The detected curves are first
regrouped into shapes, two curves being considered
as in the same shape if their traces on the pixel grid
are connex using 8-connexity. A regularized version
of the shape is then computed by taking the α-shape
of that boundary (Bernardini and Bajaj, 1997). That
shape is then represented using triangulated polygon
(Felzenszwalb, 2005) and the unique crease associ-
ated with a given group of detected curves is then de-
fined as the medial axis of the triangulation. It will not
be detailed further here, more details can be found in
see (Chessel, 2007)),
3.5 Emergence via Iteration
It can be argued that both positive and negative feed-
back loops are a sine qua non condition of complex
systems (Thomas and Thieffry, 1995). It is the fact
that two or more perceptual cues can both reinforce
and attenuate one another in non-linear and global
ways that give rise to mid-level constructions, which
in turn both give rise to global structures and get fed
back to drive the individual cues interaction.
That process can be modelled using iterations, i.e.
using the detected mid-level elements to drive the pro-
cess of computing the global structure out of individ-
ual information. Contrarily to iterative schemes, used
to solve partial differential equations for example, for
which convergenceand uniqueness results exist, com-
plex systems are characterised by solutions that are
difficult to predict analytically, but are rather simu-
lated from given initial conditions.
Two perceptual information are used, orientation
and contrast. The a contrario detection imposes to
consider independent features, thus the feedback re-
lies on orientation estimation only. The orientation
interpolation step uses as input a set of points with
known orientation. While initialisation is given by a
simple filter, after an iteration of the proposed frame-
work the extracted curves along with the tangent to
these curves providesupdated inputs to update the ori-
entation field. Being the result of the combination of
both perceptual informations, those tangents will al-
low us to compute orientation fields more closely fol-
lowing the structures, and thus to improve the results.
4 RESULTS
The presented algorithm were implemented in
C/C++, using the Megawave2 (Froment, 1998) and
the CGAL computational geometry library (CGAL
Editorial Board, 2006) libraries. A simple filter se-
lects interesting points to initialise the process. There
are few parameters which are not crucial and can es-
sentially be kept constant for a wide range of images.
Previous methods of 2D otoliths image analy-
sis where limited to otolihs considered simple (like
plaice, not shown here) and would fail on more com-
plicated species like hake (Fig. 3 top). It is, as far as
we known, the first time that reconstructing the his-
tory of the shapes as done here is attempted. Quanti-
tative results with respect to synthetic data can found
in (Chessel, 2007).
Results on otoliths from different fish species can
be seen in Figures 3(a) and 3(b). For each are shown
the dome shaped potential motolith, represented by its
level lines, and the pieces of growth rings computed,
both on top of the original image. Both are shown for
the first iteration and after a few iterations.
The improvement over the iterations of the recov-
ered shapes is clear. While at first cluttered by de-
tails not relevant with respect to the global structure
sought after (on the left side of the hake otolith for
exemple), a few iteration of comparing information
from orientation and from contrast managed to disre-
gard that local data and smooth the details out. On the
growth rings however, that improvement is less visi-
ble. There may be two reasons. First those structure
are less global than the whole shape evolution, and
thus not as dependant over long range multimodal in-
teraction. Second the probability law used in the a
contrario detection is very conservative, being based
on the minimum, and fail to recover long curves if
they pass through a less contrasted part of the image.
OTOLITH IMAGE ANALYSIS BY COMPUTER VISION
495

5 CONCLUSIONS
Image analysis is one of the means of systematic anal-
ysis for the concentric structures found in otoliths.
But automatic analysis is a challenge because of the
noise and of the low contrast. Those structures are
clear to human vision however, so a psychovisual
analysis of low-level vision as a complex system was
presented to understand how we manage to organise
the atomistic information into a coherent whole.
It led us to an iterative algorithm which exploits
the coherence between two distinct perceptual cues,
orientation and contrast, to go back and forth between
individual pixels and a global dome shaped potential.
The results are good and biological applications that
use them, including morphogenesis modelling and
data fusion can be envisaged.
As far as computer vision is concerned, future
work will in particular be focused a contrario laws
that would allow for curve completion. Besides,
the proposed level-sets representation of the otolith
growth recover the geometry of the otolith, which
provides a common framework for comparing and
combining various otoliths features (opacity, growth,
chemical signatures...) for the characterisation of in-
dividual life traits. To that end, statistical methods for
comparing different features with respect to a given
geometry will be needed.
To conclude, this work showed how specific com-
puter vision development can be applied to a biolog-
ical problem so that both computer vision and bi-
ology benefit from the cross-fertilisation such trans-
disciplinary studies induce.
REFERENCES
Benkirane, R., editor (2002). La complexit, vertiges et
promesses. Le pommier.
Bernardini, F. and Bajaj, C. L. (1997). Sampling and re-
constructing manifolds using alpha-shapes. In Proc.
9th Canadian Conf. Computational Geometry, pages
193–198.
Cabral, B. and Leedom, L. C. (1993). Imaging vector fields
using line integral convolution. In SIGGRAPH ’93,
pages 263–270.
Caselles, V., Morel, J., and Sbert, C. (1998). An axiomatic
approach to image interpolation. IEEE Trans. Image
Processing, 7(3):376–386.
CGAL Editorial Board (2006). CGAL-3.2 User and Refer-
ence Manual.
Chessel, A. (2007). Otolithe et Vision par Ordinateur. PhD
thesis, Universit de Rennes 1.
Chessel, A., Cao, F., and Fablet, R. (2006). Orientation
interpolation: an axiomatic approach. In European
Conference on Conputer Vision.
D’arcy Thompson, W. (1917). On Growth and Form. Lon-
don press.
Desolneux, A., Moisan, L., and Morel, J.-M. (2003). A
grouping principle and four applications. PAMI,
25(4):508–513.
Fablet, R., Pujolle, S., Chessel, A., Benzinou, A., and Cao,
F. (2006). Variational level-set reconstruction of ac-
cretionary morphogenesis from images. In IEEE In-
ternational Conference on Image Processing.
Felzenszwalb, P. F. (2005). Representation and detection
of deformable shapes. IEEE Transactions on Pattern
Analysis and Machine Intelligence, 27(2).
Froment, J. (1998). Megawave2.
http://www.cmla.ens-cachan.fr/Cmla/Megawave/.
Guillau, A., Benzinou, A., Troadec, H., Rodin, V., and Le
Bihan, J. (2002). Autonomous agents for edge detec-
tion and continuity perception on otolith images. Im-
age and Vision Computing, 20(13):955–968.
Kanizsa, G. (1979). Organization in Vision: Essays on
Gestalt Perception. Greenwood Publishing Group.
Mumford, D. (1994). Elastica and computer vision. In Ba-
jaj, C., editor, Algebraic Geometry and Its Applica-
tions, pages 491–506. Springer-Verlag.
Panfili, J., de Pontual, H., Troadec, H., and Wright, P., edi-
tors (2002). Manual of fish sclerochronology. Ifremer-
ird coedition.
Parent, P. and Zucker, W. (1989). Trace inference, curva-
ture consistency, and curve detection. IEEE Transac-
tions on Pattern Analysis and Machine Intelligence,
11(8):823–839.
Serrat, J., Lopez, A., and Lloret, D. (2000). On ridges
and valleys. In International Conference on Pattern
Recognition ICPR’00, pages 59–66.
Sole, A., Lopez, A., and Sapiro, G. (2001). Crease enhance-
ment diffusion. Comput. Vis. Image Underst., 84:241–
248.
Thomas, R. and Thieffry, D. (1995). Les boucles de rtroac-
tion, rouages des rseaux de rgulation biologiques.
Mdecine sciences, 11(2):189–197.
Troadec, H., Benzinou, A., Rodin, V., and Le Bihan,
J. (2000). Use of deformable template for two-
dimensional growth ring detection of otoliths by
digital image processing: - application to plaice
(pleuronectes platessa) otoliths. Fisheries Research,
46(1):155–163.
Zweck, J. and Williams, L. (2004). Euclidian group invari-
ant computation of stochastic completion fields using
shiftable-twistable basis function. J. Math. Imaging
and Vision, 21(2):135–154.
BIOSIGNALS 2008 - International Conference on Bio-inspired Systems and Signal Processing
496
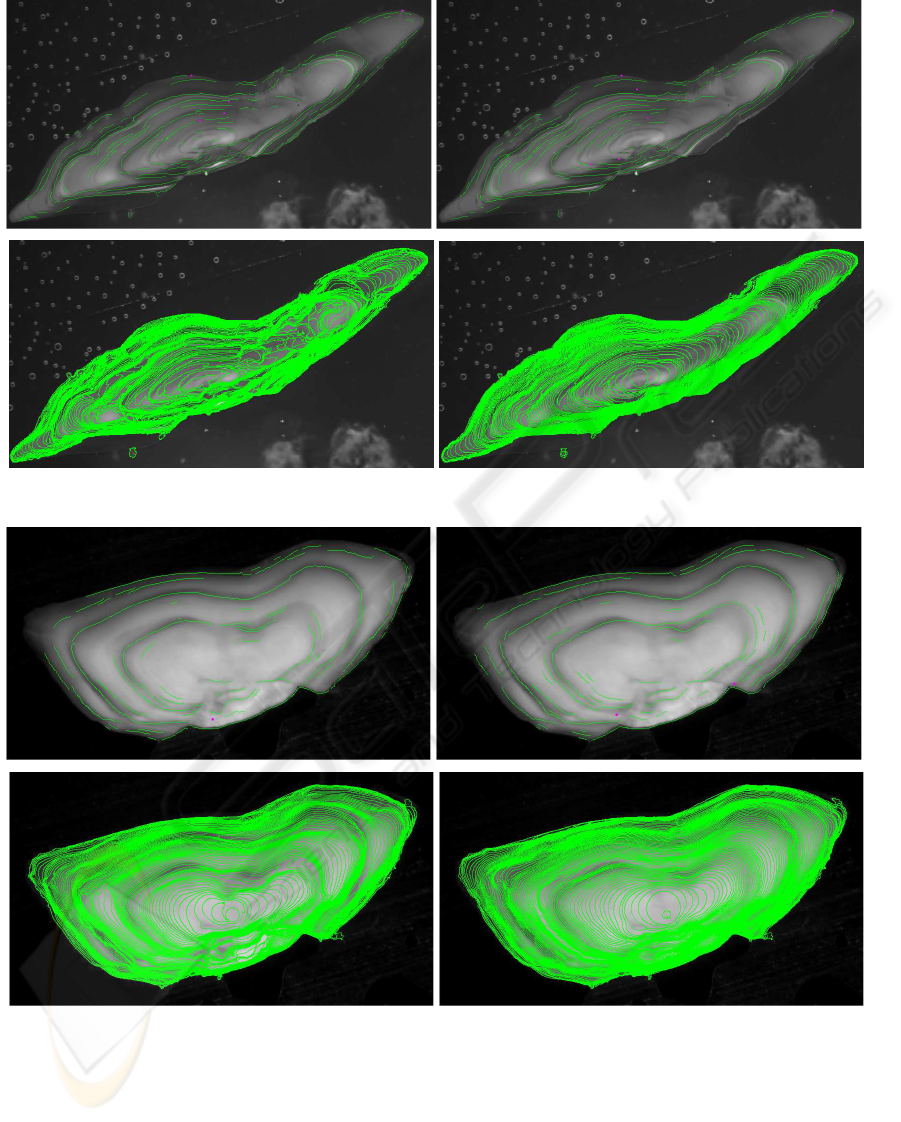
(a) A hake otolith, the recovered successive shapes (bottom), the extracted growth rings (top), first iteration (left), third
iteration (right).
(b) A pollock otolith, the recovered successive shapes (bottom), the extracted growth rings (top), first iteration (left),
third iteration (right).
Figure 3
OTOLITH IMAGE ANALYSIS BY COMPUTER VISION
497
