
FULLY-AUTOMATED SEGMENTATION OF TUMOR AREAS IN
TISSUE CONFOCAL IMAGES
Comparison between a Custom Unsupervised and a Supervised SVM Approach
Santa Di Cataldo, Elisa Ficarra and Enrico Macii
Dep. of Control and Computer Engineering, Politecnico di Torino, Cso Duca degli Abruzzi 24, 10129, Torino, Italy
Keywords: Tissue segmentation, tissue confocal images, immunohistochemistry, K-means clustering, Support Vector
Machine.
Abstract: In this paper we present a fully-automated method for the detection of tumor areas in immunohistochemical
confocal images. The image segmentation provided by the proposed technique allows quantitative protein
activity evaluation on the target tumoral tissue disregarding tissue areas that are not affected by the pathol-
ogy, such as connective tissue. The automated method, that is based on an innovative unsupervised cluster-
ing approach, enables more accurate tissue segmentation compared to traditional supervised methods that
can be found in literature, such as Support Vector Machine (SVM). Experimental results conducted on a
large set of heterogeneous immunohistochemical lung cancer tissue images demonstrate that the proposed
approach overcomes the performance of SVM by 8%, achieving on average an accuracy of 90%.
1 INTRODUCTION
Detecting tumor areas in cancer tissue images and
disregarding non pathological portions such as con-
nective tissue are critical tasks for the analysis of
disease state and dynamics. In fact, by monitoring
the activity of proteins involved in the genesis and
the development of multi-factorial genetic patholo-
gies we can obtain a useful diagnostic tool. It leads
to classify the pathology in a more accurate way
through its particular genetic alterations, and to cre-
ate new opportunities for early diagnosis and per-
sonalized predictive therapies (Taneja et al., 2004).
An approach for monitoring and quantifying the
protein activity in pathological tissues is to analyze,
for example, images of the tissue where the localiza-
tion of proteins is highlighted by fluorescent marked
antibodies that can detect and link the target pro-
teins. The antibodies are marked with particular
stains whose intensity is related to protein activity
intensity. This procedure is called immunohisto-
chemistry (IHC).
The increased use of immunohistochemistry
(IHC) in both clinical and basic research settings has
led to the development of techniques for acquiring
quantitative information from immunostains and
automated imaging methods have been developed in
an attempt to standardize IHC analysis.
Tissue segmentation for tumor areas detection is
the first fundamental step of automated IHC image
processing and protein activity evaluation. In fact
the quantification of a target protein activity should
be performed on tumor portions of the tissue without
taking into account the non pathological areas even-
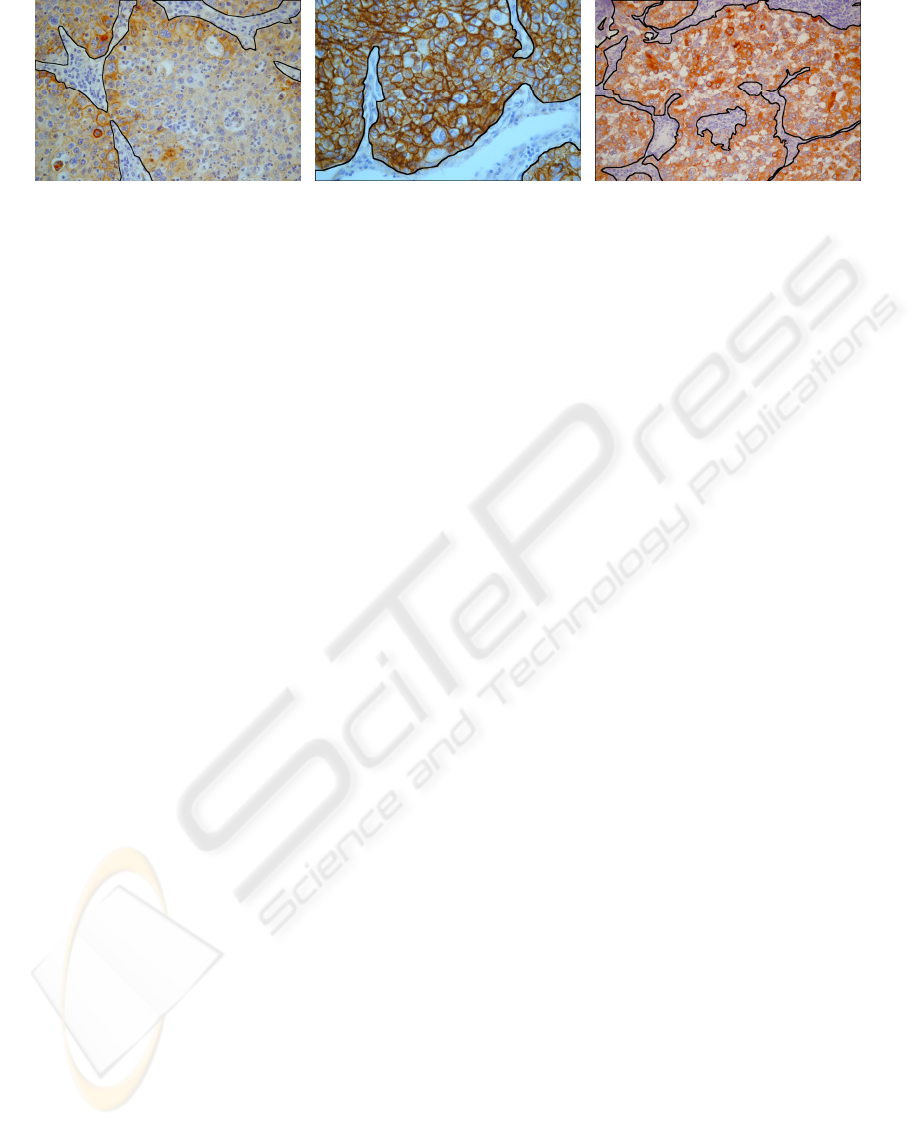
tually present in the same IHC images. In Figure 1
are reported examples of IHC tissue images where
connective tissue (i.e. non tumoral tissue) is outlined
in black (for details about these images see Section
2).
Several methods have been proposed in the last
few years to perform automated segmentation of
tissue images (Demandolx et al., 1997; Nedzved et
al., 2000; Malpica et al., 1997; Dybowzki, 2000;
Nattkemper 2004). However the most accurate ap-
proaches are those that provide a well-suited frame-
work for incorporating primary expert knowledge
into the adaptation of algorithms, such as supervised
learning algorithm (e.g. Neural Networks, Machine
Learning, kernel-based) (Nattkemper 2004). The
most prominent algorithm among these is the sup-
port vector machine (SVM) proposed by V.Vapnik
(V.Vapnik, 1998) for binary classification. SVM is a
theoretically superior machine learning method
which has often been shown to achieve great classi-
116
Di Cataldo S., Ficarra E. and Macii E. (2008).
FULLY-AUTOMATED SEGMENTATION OF TUMOR AREAS IN TISSUE CONFOCAL IMAGES - Comparison between a Custom Unsupervised and a
Supervised SVM Approach.
In Proceedings of the First International Conference on Bio-inspired Systems and Signal Processing, pages 116-123
DOI: 10.5220/0001068501160123
Copyright
c
SciTePress
fication performance compared to other learning
algorithms across most application fields and tasks,
including image processing and tissue image proc-
essing in particular (Angelini et al., 2006; Osuna,
1997). Moreover, the SVM method is more able to
handle very high dimensional feature spaces than
traditional learning approaches (Muller et al., 2001;
Cai, 2003). This is in fact the case of the images
targeted by our work.
However, the IHC tissue images we considered
in our study present an intrinsic complexity, such as
very different characteristics of staining, intensity
distribution, considerable variation of tissue shape
and/or size and/or orientation and, finally, consider-
able variation of the signal intensity within the same
tissue areas due for example to superimposed stain-
ing.
Because of the heterogeneity of the representa-
tive features related to each tissue, it is very difficult
for the supervised methods to obtain a satisfying
fixed classifier able to distinguish between tumor
areas (i.e. epithelial tissue) and non cancerous tissue
portions (such as connective tissue).
For this reason we designed a fully-automated
unsupervised approach that is based only on the
characteristics of the input image rather than on a
fixed model of the ground truth.
In this paper we present our fully-automated un-
supervised method and we compare its performance
to that provided by a SVM approach applied on the
same IHC tissue image target. We demonstrate that
our method enables more accurate tissue segmenta-
tion compared with traditional SVM. Experimental
results conducted on a large set of heterogeneous
immunohistochemical lung cancer images are re-
ported and discussed in Section 4. In Section 2 we
detail our fully-automated unsupervised method and
we briefly introduce the SVM method. The imple-
mentation and the set-up are discussed in Section 3.
Finally, the Conclusions are reported in Section 5.
2 METHOD
The images we analyzed in this work were acquired
through high-resolution confocal microscopy and
show lung cancer tissue cells stained with marked
antibodies (see Figure 1). They are characterized by
a blue hematoxylin stain as a background colour and
a brown DAB stain in cellular regions where a re-
ceptor of the EGF-R/erb-B or TGF-alpha family is
detected (i.e. membranes or cytoplasm, respec-
tively). Cellular nuclei are blue-coloured and show a
staining intensity darker than background.
In all the images a remarkable portion of connec-
tive or other no cancer tissue components is present,
which appears as a blue-coloured mass (since brown
DAB-stained cells are only in cancerous tissue) with
quite well-defined borders. Connective tissue is usu-
ally characterized by shorter inter-cellular distances
and smaller nuclei than epithelial component; how-
ever, a generalization of this remark is impossible
because shape and dimensions distributions of can-
cer cells are often not predictable. As we outlined in
the Introduction, in order to perform accurate and
robust cell segmentation and protein activity quanti-
fication (Ficarra, 2006) these non cancerous tissue
portions have to be identified and isolated from the
representative epithelial tissue. Here we present two
different segmentation approaches to perform this
critical task: i) an unsupervised procedure based on a
K-means clustering of brown intensities followed by
some morphological and edge-based refinement
steps (see Figure 3); ii) a supervised classification of
RGB features through Support Vector Machine (see
Figure 5).
Experimental results obtained with each approach
on the same real-life datasets are presented and
compared in Section 4.
Figure 1: IHC tissue images with connective tissue manually outlined in black (from the left, x400 image with EGF-R posi-
tive reactions; x400 image with EGF-R positive reactions; x200 image with TGF-alpha positive reactions).
FULLY-AUTOMATED SEGMENTATION OF TUMOR AREAS IN TISSUE CONFOCAL IMAGES - Comparison
between a Custom Unsupervised and a Supervised SVM Approach
117
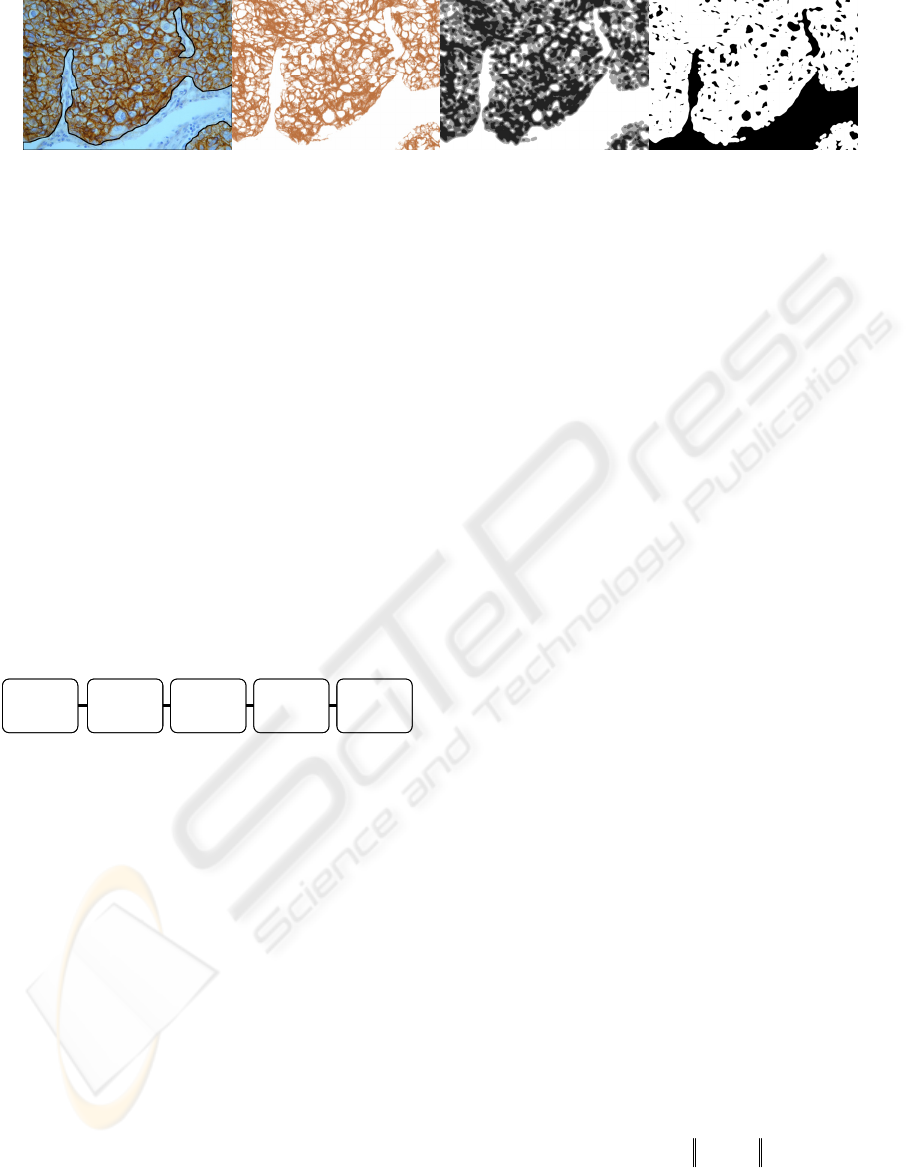
2.1 Unsupervised Procedure
Since non cancerous cells do not show positive reac-
tions at the EGF-R/TGF-alpha receptors, the mono-
chromatic pure-DAB component instead of the
original RGB image can be analyzed to perform
tissue segmentation: in fact in this simpler color
space connective components can be easily identi-
fied as wide bright regions with a quite homogene-
ous appearance (see Figure 2(b)).
An unsupervised learning algorithm (K-means,
in our work) can be efficaciously applied to isolate
bright regions; then areas which show morphologi-
cal and edge characteristics which are typical of
connective tissue can be selected to refine tissue
segmentation.
DAB-COMPONENT
SEPARATION
PREPROCESSING
K-MEANS
CLUSTERING
REFINEMENT BY
SIZE AND
CIRCULARITY
ANALYSIS
REFINEMENT BY
GRADIENT
MAGNITUDE
ANALYSIS
DAB-COMPONENT
SEPARATION
PREPROCESSING
K-MEANS
CLUSTERING
REFINEMENT BY
SIZE AND
CIRCULARITY
ANALYSIS
REFINEMENT BY
GRADIENT
MAGNITUDE
ANALYSIS
Figure 3: Unsupervised procedure based on K-means clus-
tering
Main steps of the proposed procedure are (see
Figure 3):
1) DAB-Component Separation. To separate pure-
DAB from pure-hematoxylin component a color
deconvolution algorithm based on stain-specific
RGB absorption is applied on the original RGB im-
age (Ruifrok 2001, 2004); differently from classical
color segmentation approaches based on transforma-
tion of RGB information to HSI or to another spe-
cific color representation (Brey, 2003), this method
has been demonstrated to perform a good color sepa-
ration even with colocalized stains. This critical
condition, due to chemical reactions of stains linking
the target proteins and to the tissue superposition
during the slicing of samples before image acquisi-
tion, is very common in the images targeted by our
method.
For this step, the free color deconvolution plugin
developed by G. Landini was integrated to our algo-
rithm.
2) Preprocessing. In pure-DAB images, connective
tissue can be differentiated from epithelial tissue
through its higher intensity (see Figure 2(b)); any-
way some preprocessing is needed in order to ho-
mogenize and separate the intensity distributions of
the two tissues, thus improving K-means’ perform-
ance.
First of all, a mean filter is performed: this opera-
tion replaces each pixel value with the average value
in its neighbourhood, thus smoothing intensity peaks
and decreasing the influence of single non-
representative pixels. Then a minimum filter is ap-
plied. The filter replaces pixels values with the
minimum intensity values in their neighbourhood:
this transformation reduces the intensity dynamic
and performs a further separation of connective and
epithelial intensity distributions, since the former
shows minimum values higher than the latter.
3) K-Means Clustering.
To isolate bright pixels
belonging to connective tissue a K-means clustering,
the well-known unsupervised learning algorithm
(Jain, 1988) which iteratively partitions a given
dataset into a fixed number of clusters, is applied;
this iterative partitioning minimizes the sum, over all
clusters, of the within-cluster sums of point-to-
cluster-centroid distances. Thus the procedure
minimizes the so-called objective function, J in
Equation 1, where k is the number of clusters, n is
the number of data points and the quadratic expres-
sion is the distance measure between a data point x
i
(j)
and the current cluster centroid c
j
.
(1)
The cluster with the highest centroid value is se-
lected as representative of the connective tissue (see
2
11
)(
∑∑
==
−=
k
j
n
i
j
j
i
cxJ
Figure 2: Unsupervised procedure: (a) original IHC image with connective regions manually outlined (in black); (b) pure-
DAB image (c) results after K-means clustering (pixels belonging to different clusters are mapped with grey intensity pro-
portional to the cluster centroid); (d) cluster with highest centroid value (in black); as outlined in section 2.1 point 4, some
small and round-shaped epithelial particles still have to be removed.
(a) (b) (c) (d)
BIOSIGNALS 2008 - International Conference on Bio-inspired Systems and Signal Processing
118
2
4
Perimeter
Area
yCircularit
π
=
Figure 2(c)). The number of clusters k was empiri-
cally set to four (see Section 3.1 for details about the
parameter set-up).
4) Refinement by Size and Circularity Analysis.
Bright epithelial regions with low EGF-R/TGF-
alpha activity have to be removed from the connec-
tive cluster to refine tissue segmentation. As shown
in Figure 2(d), a large number of these regions are
approximately round-shaped and are considerably
smaller than connective mass: then a selective re-
moval of particles with a low area and a high circu-
larity compared to threshold values T
S
and T
C
is
performed (parameters set-up in Section 3.1).
Equation 2 shows the proposed index for circu-
larity evaluation (a value of 1 indicates a perfect
circle, a value approaching 0 an increasingly elon-
gated polygon).
(2)
5) Refinement by Gradient Magnitude Analysis.
Other bright epithelial regions can be removed from
the connective cluster through their edge characteris-
tics, since connective tissue usually shows a well-
defined boundary w.r.t. epithelial background in
terms of intensity gradient variation. On the base of
this remark, in this step areas which show along
their boundary a percentage of edge pixels (i.e. pix-
els with high gradient intensity variation w.r.t. back-
ground) lower than a threshold value T
E
are selec-
tively removed from connective cluster (parameter
set-up in Section 3.1). Edge detection is performed
through a Sobel detector followed by automated
intensity global thresholding.
2.2 Supervised Procedure
An alternate approach for tissue segmentation is
supervised learning; for this purpose a Support Vec-
tor Machine (SVM) classification is proposed.
The SVM (Vapnik, 1998) is a theoretically supe-
rior machine learning method which has often been
shown to achieve great classification performance
compared to other learning algorithms across most
application fields and tasks including image process-
ing (Statnikov, 2005).
Here we propose a procedure based on binary
SVM classification, in which the input elements (in
this work, small tissue regions) are associated to one
of two different classes, connective or epithelial, on
the base of a set of representative characteristics, the
features vector. To perform a reliable classification,
the SVM is previously trained with a set of elements
whose class is well-known, the so-called training
instances.
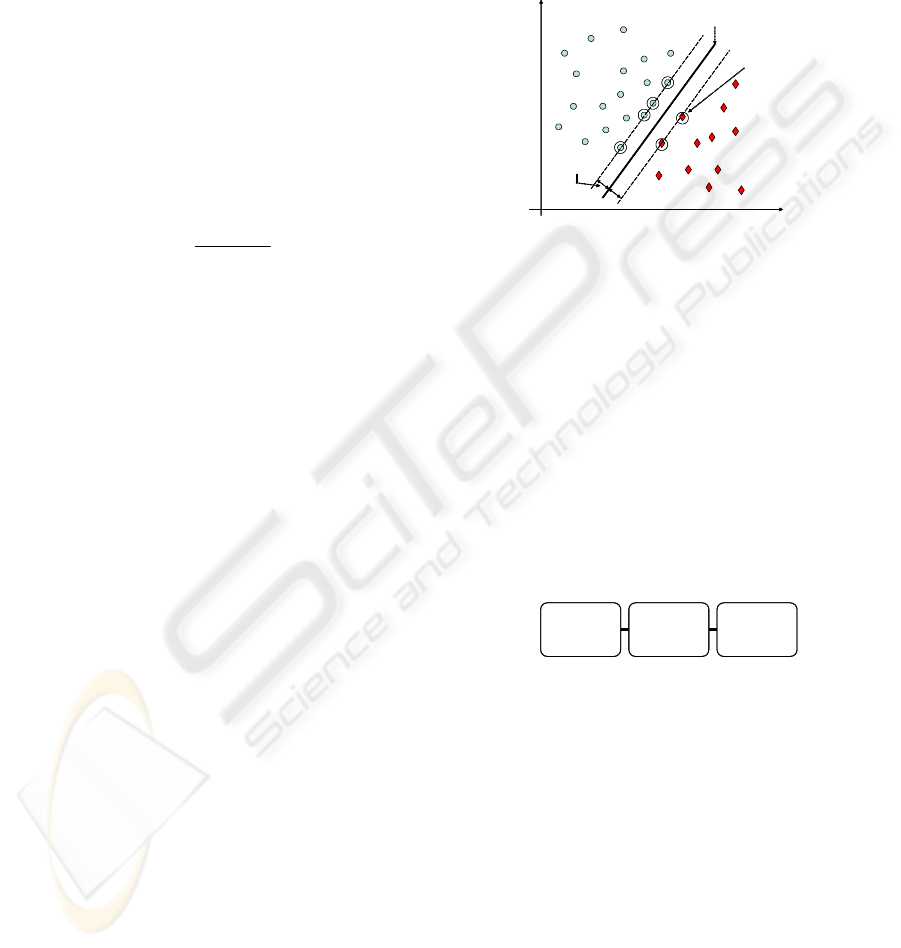
The classification is based on the implicit map-
ping of data to a higher dimensional space via a ker-
nel function and on the consequent solving of an
optimization problem to identify the maximum-
margin hyperplane that separates the given training
instances (see Figure 4).
Optimal margin
CLASS 1
CLASS 2
Optimal hyperplane
Support vector
Optimal margin
CLASS 1
CLASS 2
Optimal hyperplane
Support vector
Figure 4: Maximum-margin hyperplane in SVMs (linearly
separable case). The boundary training instances (support
vectors) are indicated by an extra circle.
This hyperplane is calculated on the base of
boundary training instances (i.e. elements with char-
acteristics which are border-line between the two
classes), the so-called support vectors; new instances
are then classified according to the side of the hy-
perplane they fall into.
In order to handle linearly nonseparable data, the
optimization cost function includes an error minimi-
zation term to penalize the wrongly classified train-
ing instances.
See the references provided in the text for a
technical description of SVMs.
TRAINING
FEATURES
EXTRACTION
TRAINING CLASSIFICATION
TRAINING
FEATURES
EXTRACTION
TRAINING CLASSIFICATION
Figure 5: Supervised procedure based on SVM.
Our proposed supervised procedure for tissue
segmentation consists in three main steps (see Figure
5):
1) Training Features Extraction. In order to ob-
tain a good generalization of the SVM, a skilled op-
erator was asked to select from a large number of
real-life tissue images small rectangular regions
wherein both connective and epithelial tissue were
present. The images showed various staining levels
and very different characteristics of tissue shape and
intensity distribution.
In each representative sample the operator manu-
ally traced the boundaries of connective and epithe-
lial tissue. Then a NxN square sliding window was
FULLY-AUTOMATED SEGMENTATION OF TUMOR AREAS IN TISSUE CONFOCAL IMAGES - Comparison
between a Custom Unsupervised and a Supervised SVM Approach
119
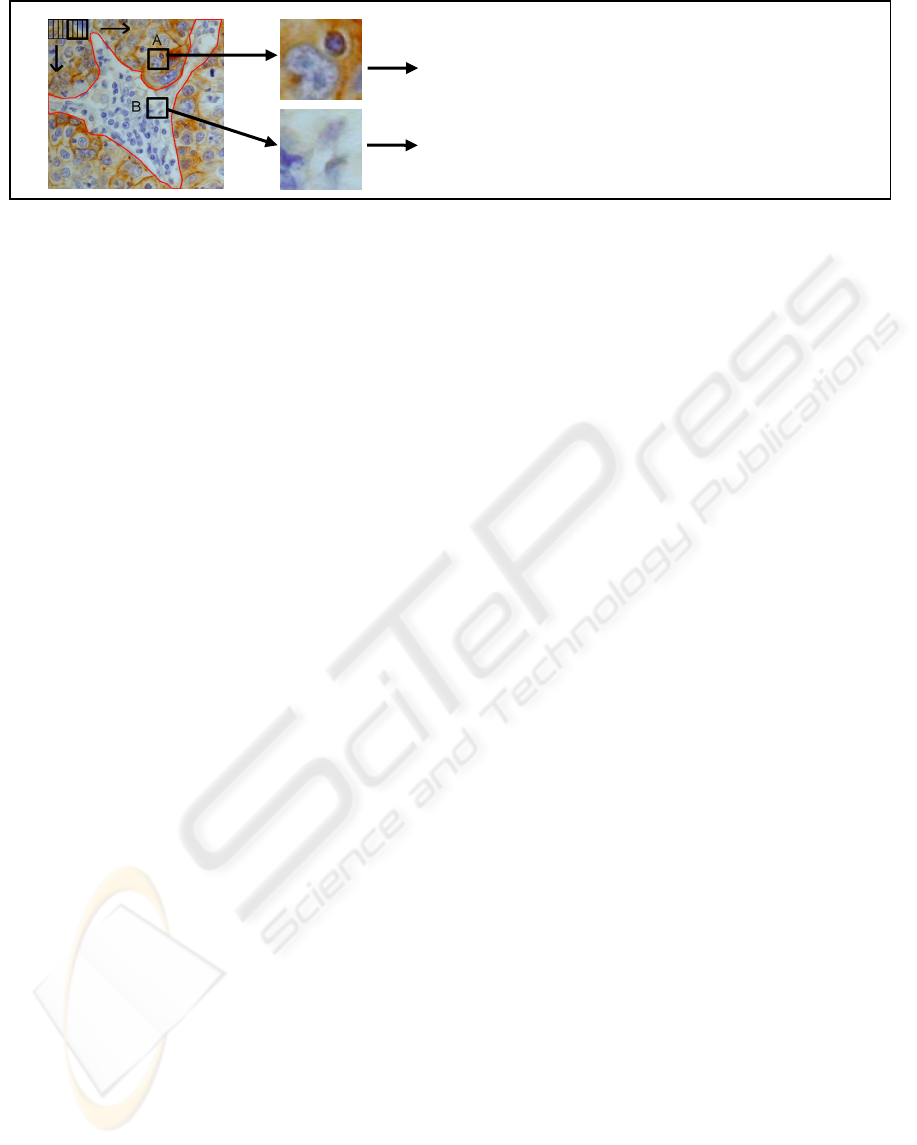
horizontally and vertically shifted over the samples
(shift value s), thus covering the entire surface of the
image; for each shifted window, a features vector
was generated with the RGB values of 256 equally-
spaced pixels (see Figure 6, parameters set-up in
Section 3.2).
In this way, a features vector of 3x256 variables
was created for each single shift.
A +1 label was assigned to windows with a
prevalence of epithelial tissue pixels, a -1 label to
windows with a prevalence of connective tissue pix-
els.
2) Training. The labelled features vectors were fed
into the SVM for the training; for details about the
parameters set-up see Section 3.2.
3) Classification. The optimized SVM obtained in
the training step is used to perform tissue classifica-
tion for new images.
For this purpose, the input images are processed
to generate features vectors as in step 1 which are
fed into the trained SVM. At the end of the classifi-
cation, the SVM automatically associates positive
labels to epithelial patterns and negative labels to
connective patterns. The output is then processed to
reconstruct a two-dimensional result as in Figure 8.
3 IMPLEMENTATION
The algorithm was implemented in Java as a plugin
for ImageJ, a public domain image analysis and
processing software which runs on all the standard
operating systems (Windows, Mac OS, Mac OS X
and Linux): therefore it is totally hardware-
independent, flexible and upgradeable. We inherited
the whole class hierarchy of the open-source ImageJ
1.37 API and the free plugins for color deconvolu-
tion (Landini) and K-means clustering (Sacha) and
we implemented our own functions and classes. A
user-friendly interface enables the user to set differ-
ent parameters values without modifying the source
code.
For the supervised procedure we used the cSVM
tool for binary classification (Anguita, 2005), since
it uses the state-of-art optimization method SMO,
i.e. Sequential Minimal Optimization (Platt, 1999).
This cSVM tool implements the algorithm described
in (Wang, 2004), which was successfully used to
solve different real world problems. Our ImageJ
plugins for features vectors generation and output
reconstruction were integrated to the SVM tool.
The parameters of the proposed algorithms were
empirically tuned by a skilled operator after running
several experiments on a large dataset of real tissue
images which showed very different characteristics
of staining intensity, resolution, EGF-R/TGF-alpha
activity level, tissue shape. In the following subsec-
tions, we report some details about the implementa-
tion of both the unsupervised and the supervised
classification procedures and we outline the experi-
mental set-up of the main parameters.
3.1 Unsupervised Procedure
The number of clusters k (see Section 2.1 point 3)
was set to 4 after running the algorithm with values
varying from 2 to 5 and evaluating each time K-
means performance in terms of sensibility (power to
detect connective components) and selectivity
(power to avoid misclassification of epithelial com-
ponents). For values lower than 4 we often experi-
enced a very good sensibility but a not sufficient
selectivity; for higher values the sensibility was fre-
quently poor. A
k value equal to 4 assured a good
performance of K-means in all the tested images.
The size threshold T
S
(see Section 2.1 point 4)
was varied from 1000 to 5000 pixels with a step of
1000 and was finally set to 3000. Increasing values
led to a progressive improvement of selectivity in
the connective tissue selection; with values higher
Figure 6: Generation of the features vectors for SVM training. A NxN square window is horizontally and vertically shifte
d
on the sample, thus covering the entire surface of the image. For each shift a features vector is generated with RGB values o
f
256 equally spaced pixels, as for Window A and Window B. Epithelial instances are labelled with a +1, connective instances
with a -1.
Features vector : [
r
1
g
1
b
1
r
2
g
2
b
2
…
r
256
g
256
b
256
]
Label : -1 (CONNECTIVE TISSUE)
Features vector : [
r
1
g
1
b
1
r
2
g
2
b
2
…
r
256
g
256
b
256
]
Label : +1 (EPITHELIAL TISSUE)
BIOSIGNALS 2008 - International Conference on Bio-inspired Systems and Signal Processing
120
than 3000 the lack in sensibility was often not ac-
ceptable. Similarly, the circularity threshold T
C
(see Section 2.1 point 4) was decreased from 0,9 to
0,3. A value of 0,7 assured a good selectivity en-
hancement without altering sensibility in any of the
images.
The edge threshold T
E
(see Section 2.1 point 5)
was increased from 20% to 35% with a step of 5%,
evaluating each time the parameter performance in
terms of selectivity enhancement and sensibility
preservation. A value of 25% assured the best im-
provement in selectivity without altering sensibility
in any of the tested images.
3.2 Supervised Procedure
The window size N for features vectors generation
(see Section 2.2 point 1) should grant a visible
differentiation between connective and epithelial
tissue; since nuclei are blue-colored and quite
similar in both the tissues, the window has to be
large enough to contain a whole nucleus and some
surrounding tissue. On the other hand, lower-sized
windows allows a better selectivity.
After running several experiments with values
varying from 16 to 72 pixels, N was set to 32 for
x200 images and to 64 for x400 images.
Since the optimal window size depends on image
resolution, x200 and x400 images were respectively
classified with SVM trained with x200 and x400
samples.
The shift value s (see Section 2.2 point 1) was
set to N/4, which granted the best compromise
between selectivity of classification and
computational time.
After running experiments with linear, gaussian
and polynomial kernels, we finally chose the
normalized polynomial kernel shown in Equation 3,
where x
1
and x
2
are feature vectors, n=768 is the
input space dimension and p=2 is the kernel
hyperparameter; see (Wang, 2004) for technical
details).
(3)
4 EXPERIMENTAL RESULTS
We tested the performance of both the algorithms on
a large dataset extracted from real tissue images
which presented positive reactions at the EGF-R or
at the TGF-alpha receptor activation (see Figure 1
for examples); reactions are localized in cellular
membranes for EGF-R and in cytoplasm for TGF-
alpha. Images were acquired from different samples
with two different enlargements, x200 or x400.
A skilled operator was asked to manually draw
the boundaries of connective tissue in each of the
testing datasets. The manual segmentations per-
formed by the operator were pixel-by-pixel com-
pared to those obtained by both the unsupervised
and the supervised algorithms. Connective tissue
selection was evaluated in terms of sensibility (i.e.
power to detect connective tissue) and selectivity
(power to avoid misclassification of non-connective
tissue): for this purpose, the percentage of respec-
tively connective and non-connective pixels which
were equally classified by manual and automated
segmentation was calculated. The segmentation ac-
curacy was then calculated as weighted average of
sensibility and selectivity, as in Equation 4.
(4)
Different weights were used because sensibility
is more critical for automated measures of protein
()
()
()
()
pp
p
nxxnxx
nxx
xxK
+⋅+⋅
+⋅
=
2211
21
21
,
ySelectivitySensibilitAccuracy ⋅+⋅=
3
1
3
2
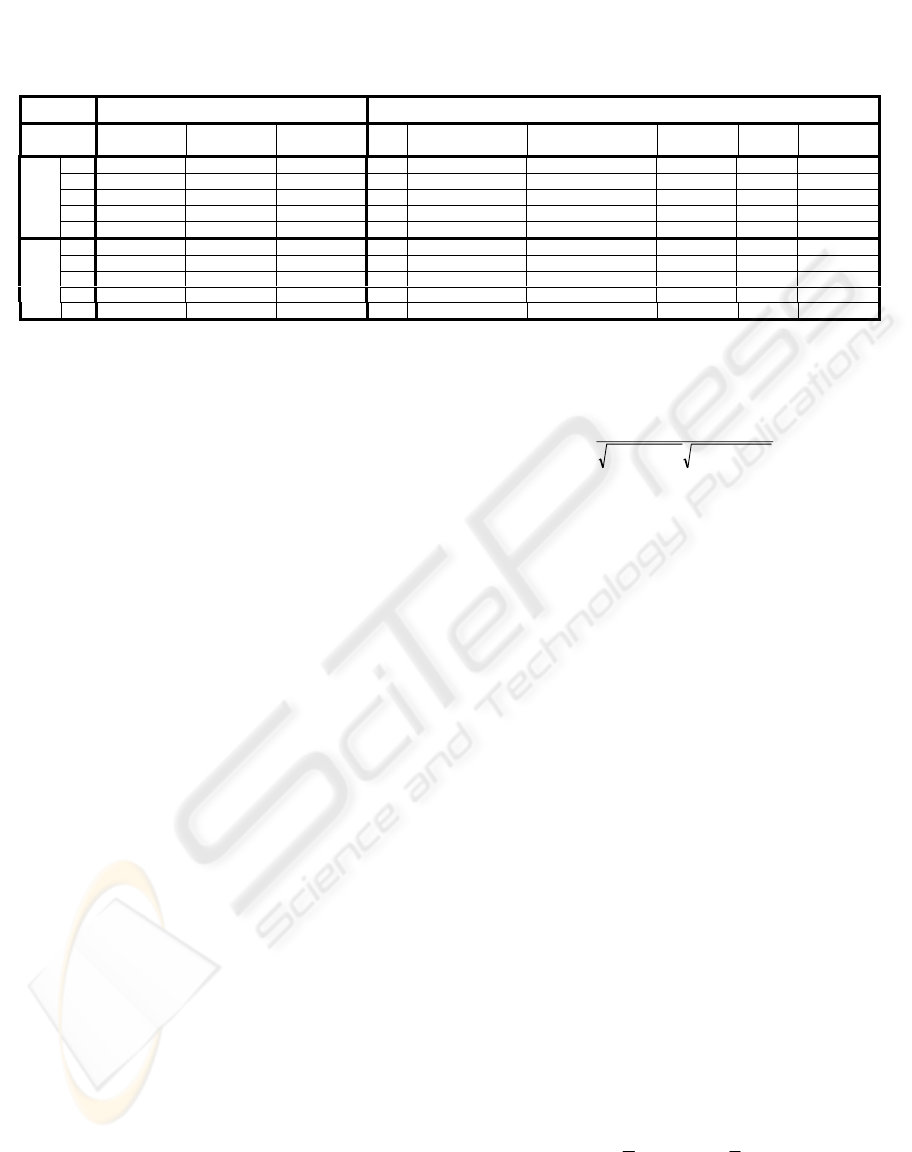
Table 1: Experimental results of unsupervised and supervised classifications. As outlined in Section 3.2, in supervised
classification two different SVMs trained respectively with x200 and x400 samples were used (the number of training
instances extracted from each dataset and the total number of training instances are reported for both x200 and x400 classi-
fiers). Training instances were removed from the validation dataset, which was considerably larger.
UNSUPERVISED ALGORITHM SUPERVISED ALGORITHM
Dataset
Sensibility
(%)
Selectivity
(%)
Accuracy
(%)
Number of
training instances
Number of
validation instances
Sensibility
(%)
Selectivity
(%)
Accuracy
(%)
1 81,89 90,54 84,77 1692 28308 57,91 91,38 69,07
2 94,64 84,94 91,41 912 20263 94,05 79,20 89,10
3 95,21 97,99 96,14 220 20192 91,09 94,75 92,31
4 86,60 87,32 86,84 408 19142 84,41 91,18 86,66
x200
tot
3232 91137
5 91,77 86,20 89,91 558 6942 67,48 82,35 72,43
6 91,30 78,56 87,05 640 6860 66,48 90,02 74,32
7 99,67 93,33 97,56 252 7248 93,53 87,46 91,51
x400
8 89,21 86,28 88,23 300 5888 87,29 85,39 86,66
tot
1750 28688
FULLY-AUTOMATED SEGMENTATION OF TUMOR AREAS IN TISSUE CONFOCAL IMAGES - Comparison
between a Custom Unsupervised and a Supervised SVM Approach
121
activity, which is the principal application targeted
by our method: in fact, in order to obtain a reliable
measure, it is fundamental to eliminate as much as
possible non representative tissues from the range of
interest; on the contrary, erroneous removal of some
epithelial regions is more tolerable, since it has a
lower influence on the final measure.
Results obtained for both the automated algo-
rithms are reported in Table 1. The number of train-
ing instances extracted from each dataset and the
total number of training instances are reported too
for both x200 and x400 SVMs. The classification
performance was evaluated on a large validation
dataset which did not include the patterns used for
training.
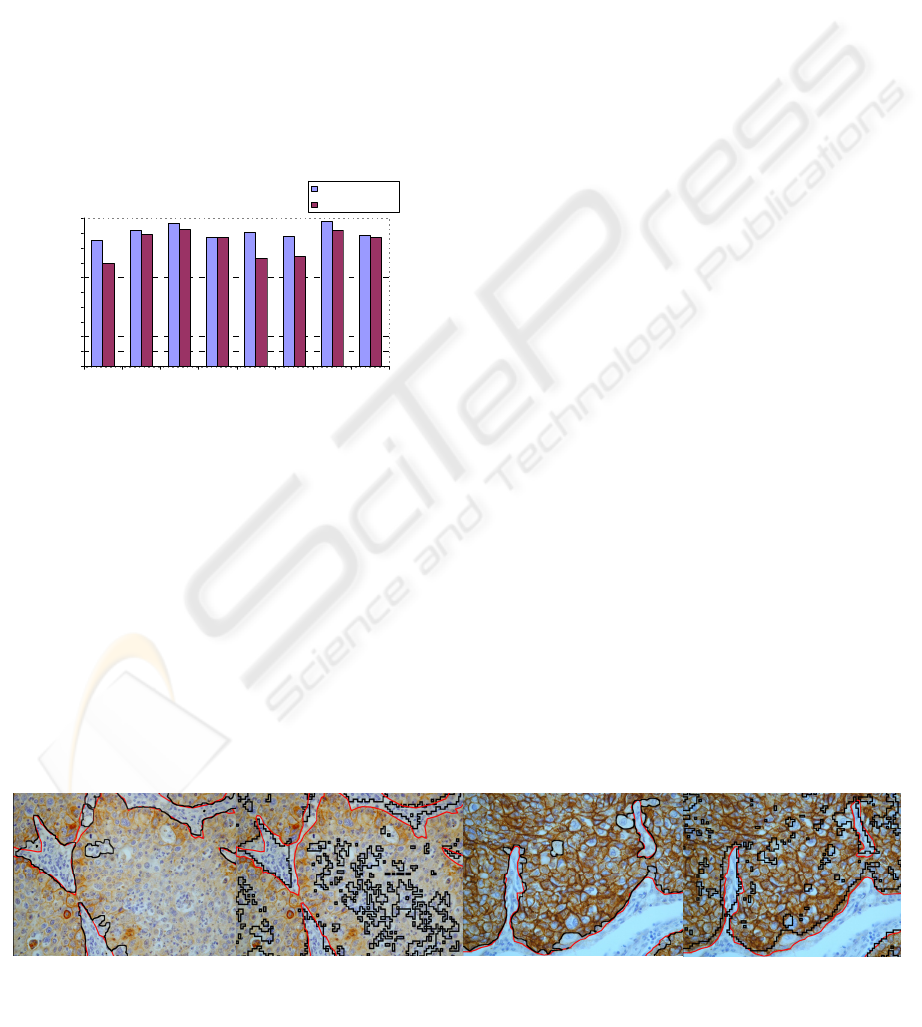
Some examples of tissue segmentation are shown
in Figure 8.
Accuracy of tissue segmentation
0,00
10,00
20,00
30,00
40,00
50,00
60,00
70,00
80,00
90,00
100,00
12345678
Da ta s e t
%
UNSUPERVISED
SUPERVISED
Figure 7: Accuracy of tissue segmentation; comparison
between unsupervised and supervised procedure.
As shown in Table 1 and Figure 7, our unsuper-
vised procedure achieved the best results: this
method performed tissue segmentations highly com-
parable with those provided by the skilled operator
in all the testing datasets; mean accuracy was
90,24%, with values generally around 90% and al-
ways above approximately 85%. SVM performed
worse in all the tested datasets; mean accuracy was
about 7,5% lower than our unsupervised method.
As we previously outlined, SVM is a theoreti-
cally superior machine learning method which has
often been shown to achieve great classification
performance compared to other learning algorithms
across most application fields and tasks including
image processing (Angelini et al., 2006; Cai, 2003;
Muller et al., 2001; Osuna, 1997). However, in this
case its classification performance was poor because
of the intrinsic complexity of the images targeted by
our method: in fact, these images showed very dif-
ferent characteristics of staining, tissue shape and
intensity distribution. Because of the heterogeneity
of the representative features of each class, it was
impossible for the supervised method to obtain a
satisfying separability of connective and epithelial
tissue.
Images heterogeneity was less critical for the un-
supervised approach, since differently from SVMs it
is based only on the characteristics of the input im-
age and not on a fixed model of the ground truth.
On the other hand, our unsupervised method’s
selectivity is influenced by tissue composition: in
fact, since the number of clusters is a-priori fixed,
some epithelial regions with low brown staining are
often misclassified in images without any connective
tissue.
Despite this eventuality is unlikely, since pure-
epithelial tissue samples are very uncommon (and
we reasonably suppose that the operator would es-
cape the automated tissue segmentation in this case),
we are working on the solution of the problem: in
particular, the introduction of an adaptive number of
clusters is in development.
As regards the supervised approach, other learn-
ing methods such as neural networks and artificial
neural networks (ANN) will be tested in the future.
5 CONCLUSIONS
We presented a fully-automated unsupervised tissue
image segmentation method that allows to distin-
guish tumor areas in immunohistochemical images
and disregard non pathological areas such as connec-
tive tissue. This procedure is critical for automated
protein activity quantification in tumor tissues in
Figure 8: Examples of tissue segmentation performed by the unsupervised (a) and the supervised (b) algorithm (manual
segmentation in red, automated segmentation in black).
(1-a) (2-a) (2-b)(1-b)
BIOSIGNALS 2008 - International Conference on Bio-inspired Systems and Signal Processing
122

order to analyze the pathology dynamics and devel-
opment.
We described the original processing steps we
designed. Finally, we carried out an extensive ex-
perimental evaluation on a large set of heterogene-
ous images that demonstrated the high accuracy
achievable by the proposed technique (90% on aver-
age) compared to a more traditional approach based
on Support Vector Machines (SVM).
As future work, we will compare the proposed ap-
proach to artificial neural networks (ANN), and we
will eventually study the possibility of their integra-
tion.
ACKNOWLEDGEMENTS
We acknowledge the Dep. of Pathology of the
S.Luigi Hospital of Orbassano in Turin, Italy, for
providing IHC images and for the helpful and stimu-
lating discussions.
REFERENCES
Angelini, E, Campanini, R., Iampieri, E., Lanconelli, N.
Masotti, M., Roffilli, M., 2006. Testing the perform-
ances of different image representation for mass clas-
sification in digital mammograms. Int. J. Mod. Phys.
17(1):113-131.
Anguita, D., Boni, A., Ridella, S., Rivieccio F., Sterpi, D.,
2005. Theoretical and Practical Model Selection
Methods for Support Vector Classifiers. Springer,
Studies in Fuzziness and Soft Computing, Support
Vector Machines: Theory and Application.
Brey, E.M., Lalani, Z., Hohnston, C., Wong, M., McIntire,
L.V., Duke, P.J., Patrick, C.W., 2003. Automated se-
lection of DAB-labeled tissue for immunohistochemi-
cal quantification. In J. Histochem. Cytochem., 51(5),
pp.575-584.
Cai, C.Z., W.L.Wang, Y.Z: Chen, 2003. Int.J.Mod.Phys.
14:575.
Demandolx D, Davoust J. , 1997. Multiparameter image
cytometry: from confocal micrographs to subcellular
fluorograms. Bioimaging. 4:159-169.
Dybowski R., 2000. Neural computation in medicine:
perspectives and prospects. Proc. ANNIMAB-1. pp.
27-36.
E. Osuna, R. Freund, F. Girrosi, 1997. Training Support
Vector Machines: an Application to Face Detection.
IEEE Computer Society Conference on Computer Vi-
sion and Pattern Recognition (CVPR'97). pp. 130.
Ficarra, E., Macii, E., De Micheli, G., 2006. Computer-
aided evaluation of protein expression in pathological
tissue images. In Proc. of IEEE CBMS‘06., pp.413-
418.
Jain, A.K., Dubes, R.C., 1988. Algorithms for clustering
data, Prentice Hall.
Landini, G., 2007. Software, http://www.dentistry.bham.ac
.uk/landinig/software/software.html
Malpica N, de Solorzano CO, Vaquero JJ, Santos A,
Vallcorba I, Garcia-Sagredo JM, del Pozo F, 1997.
Applying watershed algorithms to the segmentation of
clustered nuclei. Cytometry. 28(4): 289-297.
Muller K.R:, S. Mika,G. Ratsch, K. Tsuda, 2001. IEEE
Trans. Neural Networks, 12:181.
Nattkemper, T.W., 2004. Automatic segmentation of digi-
tal micrographs: A survey. Medinfo, 11(Pt 2):847-51.
Nedzved A, Ablameyko S, Pitas I., 2000. Morphological
segmentation of histology cell images. ICPR. 1:500-3.
Platt, J., 1999. Fast training of support vector machines
using sequential minimal optimization. In Scholkopf,
B., Advances in kernel methods-support vector learn-
ing. MIT Press, Cambridge, MA, USA.
Rasband, W.S., ImageJ, U. S. National Institutes of
Health, Bethesda, Maryland, USA, rsb.info.nih.gov/ij/.
Ruifrok, A.C., Johnston, D.A., 2001. Quantification of
histochemical staining by color deconvolution. In
Anal.Quant.Cytol.Histol., 23(4), pp.291-299.
Ruifrok, A.C., Katz, R., Johnston, D., 2004. Comparison
of quantification of histochemical staining by Hue-
Saturation-Intensity (HSI) transformation and color
deconvolution. In Appl. Immunohisto. M. M., 11(1),
pp.85-91.
Sacha, J., K-means clustering, http://ij-plugins.sourceforge
.net/plugins/clustering/index.html.
Statnikov, A., Aliferis, C.F., Tsamardinos, I., Hardin, D.,
Levy, S., 2005. A comprehensive evaluation of multi-
category classification methods for microarray gene
expression cancer diagnosis. In Bioinformatics, 21(5),
pp.631-643.
Taneja, T.K., SK.Sharma Markers of small cell lung can-
cer. World Journal of Surgical Oncology, Vol(2):10.
Vapnik, V., 1998. Statistical learning theory, Wiley-
Interscience, New York, NY, USA.
Wang, L., 2004. Support vector machines: theory and
applications, Springer.
FULLY-AUTOMATED SEGMENTATION OF TUMOR AREAS IN TISSUE CONFOCAL IMAGES - Comparison
between a Custom Unsupervised and a Supervised SVM Approach
123
