
STANDING JUMP LOFT TIME MEASUREMENT
An Acceleration based Method
Susana Palma, Hugo Silva, Hugo Gamboa
Plux – Biosensor Engineering, Lisbon, Portugal
Pedro Mil-Homens
Human Kinetics Faculty, Lisbon, Portugal
Keywords: Biomechanics, jump analysis, accelerometer, force platform, signal processing.
Abstract: This paper describes two methods for the measurement of loft time in vertical jumps using signals from an
acceleration sensor. The vertical jump accelerometer characteristic curve is presented and notable regions
corresponding to key stages of the kinetic activity are identified. Using the accelerometer signals along three
dimensions two different algorithms were devised to compute the loft time. These algorithms are based on
the morphology of the signal. The first uses the the maximum value of the curve during the landing stage;
the second uses the time interval between minimum and maximum values of the acceleration during the
flight and landing stages, respectively. To validate these algorithms, a standard algorithm to compute the
loft time from force platform signals was employed and these values taken as ground truth. Performance
assessment was performed by computing the relative errors between the loft time determined from the force
signal and the values obtained with each of the proposed approaches. Preliminary results for a set of 60
jumps let to relative errors of 7.0% for the first method and 2.9% for the second method.
1 INTRODUCTION
Vertical jumps are part of a variety of sports. In
athletic field vertical jump measurements are used
both to optimize and measure the performance of
various types of movements.
Performance of standing vertical jumps can be
accessed by measuring the time the athlete is in the
air – jump loft or flight time (Linthorne N. P., 2001).
The typical approach for measuring the loft time
uses force platform signals. With this approach the
jump must be performed while standing on the force
platform, that collects vertical force data. Force-time
curves contain kinetic and temporal information that
can be used to determine parameters that objectively
measure the performance of athletic movements
(Dowling, 1993). These platforms are rectangular
metal plates provided with force sensors and
connected by cabling to a data acquisition system
and computer. Due to their weight (ranging from
about 11 kg to 57 kg) and dimensions (usually
between 0.4 m × 0.6 m and 1.2 m × 1.2 m)
(amtiweb) the platforms are usually used only in
laboratory work, restrained the outside work by the
portability issues.
Acceleration data can be used to study the
characteristics of human movement (Hassan, M. R.,
2006) and assess parameters that identify one's state
of physical activity. In jumping studies, acceleration
signals are also an important source of information.
In this paper we present two different algorithms for
determining vertical jumps loft times using a three
axial accelerometer. In this case, the portability
issues are lessened because the accelerometer and
the acquisition system employed are light-weighted
wireless devices.
The two algorithms were applied to a set of 60
vertical jumps and validated with a standard
algorithm for computation of loft time from force
platform signals.
Like on the vertical force curve, six interest
regions can be identified on the acceleration-time
curve: rest, preparation, take-off, flight, landing. and
recovery. Following the last stage a rest period can
also be present. Figure 1 shows the vertical force
393
Palma S., Silva H., Gamboa H. and Mil-Homens P. (2008).
STANDING JUMP LOFT TIME MEASUREMENT - An Acceleration based Method.
In Proceedings of the First International Conference on Bio-inspired Systems and Signal Processing, pages 393-396
DOI: 10.5220/0001069203930396
Copyright
c
SciTePress
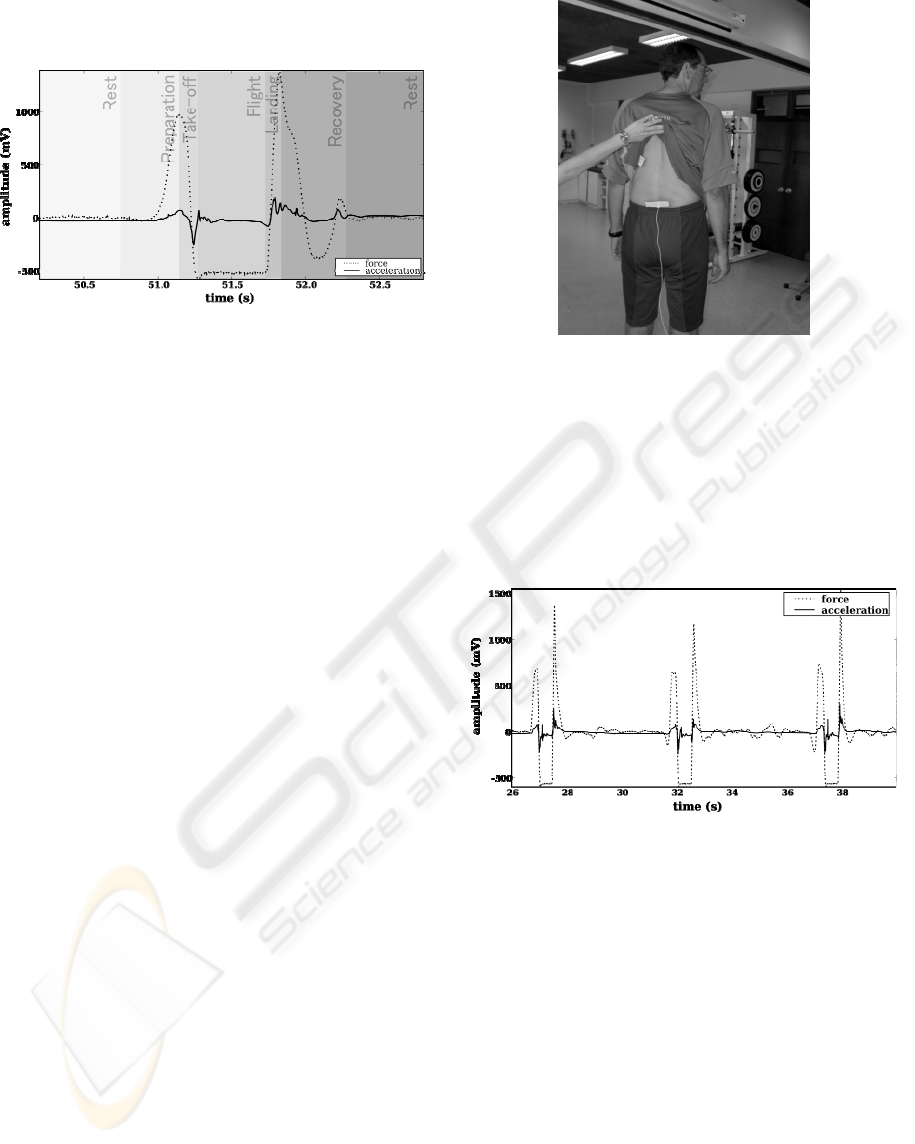
and acceleration signals acquired during a vertical
squat jump.
Figure 1: Stages of a vertical squat jump.
Some key points can be identified on the
acceleration signal that are characteristic of the
different stages of the jump and that are repeated as
a pattern when a series of jumps is acquired. The
biggest oscillations of the signal are noticed at the
beginning of the flight stage and the landing stage -
when the jumper leaves the ground and when his
feet first contact the ground after the flight,
respectively. A recovery phase follows the landing.
During this period of time the acceleration oscillates
and converges to its rest value which is reached
when the jumper finishes the jump. The fact that the
flight stage is clearly demarcated on the force curve
is usually used to compute the duration of the flight
– loft time. As we can see in Figure 1, the
acceleration curve has also characteristic features
that can be related with the loft time. Two of these
features were used in this work to estimate the
duration of the flight stage.
2 MATERIALS
The experimental set-up consisted of a bioPlux8
wireless electrophysiological data acquisition system
(Silva, H., 2005, plux.info) to which we connected a
xyzPlux triaxial accelerometer and a force platform
(AMTI- LG 6-4-2000). With this apparatus force
and acceleration (along three dimensions) were
synchronously recorded during the vertical standing
jumps.
The accelerometer was placed at the jumper's
low back on the skin surface (Figure 2). The force
platform signal was used for result comparison.
Figure 2: Placement of the accelerometer at the jumper's
low back skin.
3 METHODS
The methodology for determining the flight time
was based on the morphological analysis of the
acceleration curves of a set of 60 jumps.
Figure 3: Acceleration and force curves of a series of 3
vertical jumps.
By comparing the acceleration curve of a set of
jumps with the respective vertical force curve
(Figure 3) we observe that some of the acceleration
curve characteristic features seem to be related with
the duration of the flight stage, namely at the flight
and landing stages. Using notable points of these
stages we devised two different algorithms to
compute the loft time. The average acceleration
curve was determined from the acceleration signals
of the three dimensions and low passed using a
moving average filter using a window of 250 points
(Proakis J. G.,1995). Each of the algorithms uses
different measurements of time and amplitude taken
from this signal.
The first algorithm uses the landing stage curve
amplitude (Figure 4). This stage is characterized by
BIOSIGNALS 2008 - International Conference on Bio-inspired Systems and Signal Processing
394
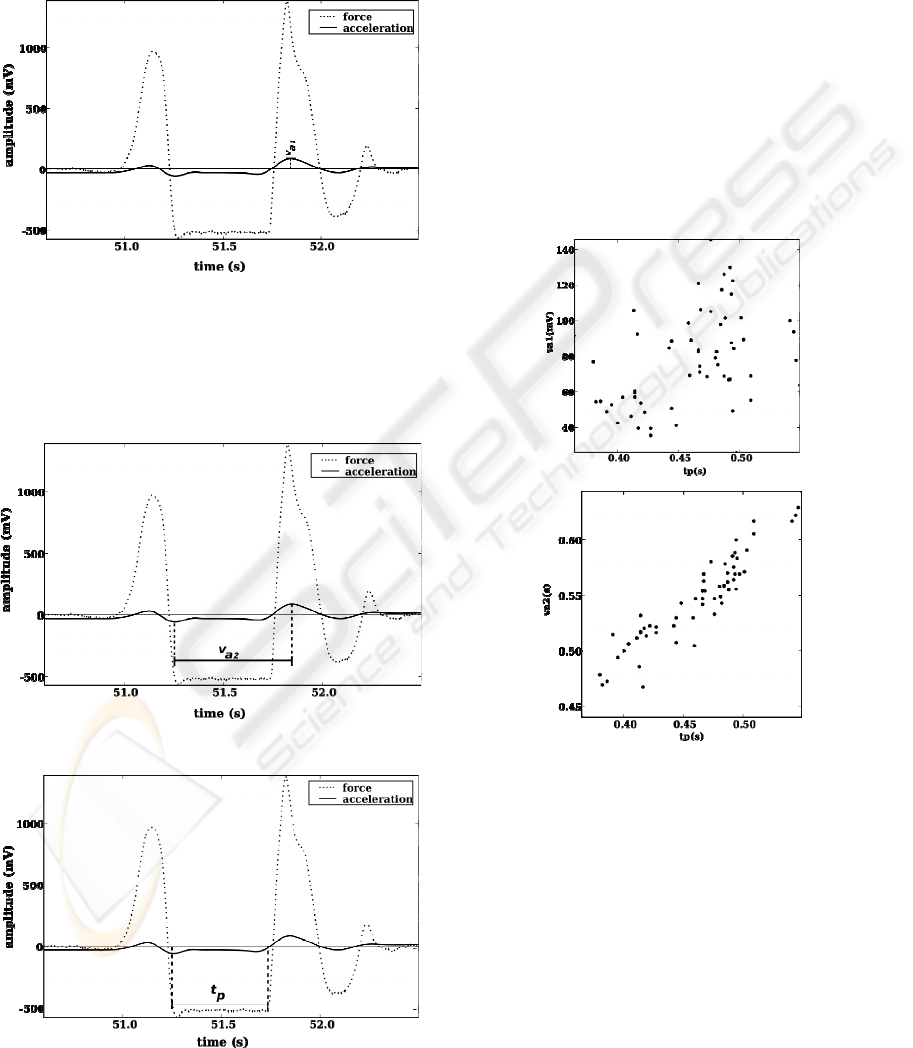
sharp variations of the acceleration signal due to the
vibration of the accelerometer when the feet first
contact the force platform on the landing. The low-
passed signal obtained from the smoothing still
preserves this impact peak whose amplitude (v
a1
)
was measured and used as a predictor variable for
the loft time.
Figure 4: Jump parameter used on the first algorithm.
The second algorithm determines the time
interval between the minimum of the smoothed
signal on the flight stage and the impact peak. With
this algorithm, a direct measure of the loft time is
obtained (Figure 5).
Figure 5: Jump parameter used on the second algorithm.
Figure 6: Jump parameter used by the standard algorithm.
For result comparison purposes, we determined
the jump loft time of the 60 jumps from the force
platform signal and took these values as ground
truth. A standard algorithm was employed that
computes the time during which the jumper is not
touching the force platform - the time interval
between the take-off and landing instants - where the
force signal has a negative plateau (Figure 6).
4 RESULTS
The two independent variables measured on the
acceleration signal (v
ai
) were plotted against the loft
time determined from the force platform signal (t
p
).
The scattergrams of these two variables are shown in
Figure 7.
(a)
(b)
Figure 7: Scattergrams of the loft time measured with the
standard algorithm versus (a) the variable measured with
algorithm 1 and (b) the variable measured with algorithm
2.
A high correlation between the loft time
measured from the force platform signal and the
time interval measured from the acceleration curve
(v
a2
) can be seen is Figure 7b. This is a much better
predictor of the flight time than the amplitude of the
landing stage impact peak (r=0.382 and r=0.933
respectively). The regression equations for both
variables are given by (1) and (2):
STANDING JUMP LOFT TIME MEASUREMENT - An Acceleration based Method
395

14
104,102106,406
−−
×× +v=t
a1p1
(s)
(1)
0,0680,967
−
a2p2
v=t (s)
(2)
Using these equations we can obtain estimates of
the loft time (t
pi
) from the variables measured from
the accelerometer signal (v
ai
).
The loft time relative error associated with each
of the algorithms i was determined for each jump j
(δ
εij
), taking as “real” loft times the values measured
from the force platform signal(t
pj
).
(
)
1,2 1,... 60
pp
jij
ε
ij
p
j
tt
δ =,i=;j=,
t
−
(3)
The accuracy of the algorithms was assessed by
determining the corresponding average loft time
relative errors:
δ
εi
=
∑
δ
εij
n
,i= 1,2 j=1,..., 60
(4)
The results led to relative errors of 7,0% for the
first algorithm and 2,9% for the second algorithm
Taking as reference the mean loft time determined
for the set of 60 jumps with the regression equations
(1) and (2) these relative errors correspond to 32 ms
and 13 ms, respectively.
Both algorithms are also affected by a common
base error of 0.1% which is characteristic of the
acquisition unit and inversely proportional to its
sampling rate.
Usually, when the force platform is used to
determine the loft time an associated error of 0,5% is
introduced because the algorithm is susceptible of
the parameters chosen by the user as the initial and
final points of the flight stage. In contrast, the
algorithms we propose are automatic.
5 CONCLUSIONS
The time interval between the minimum acceleration
value of the flying stage and the maximum
acceleration value of the landing stage is the best of
the two devised measures, showing a good
correlation with the real loft times (r=0.933 and
δ
ε
.=2,9%).
Although associated with errors, these
preliminary results indicate that these algorithms are
good alternative methods for the computation of loft
time, taking advantage of the use of an
accelerometer instead of a force platform, which is
more expensive and less portable.
In addition to the flight time other parameters
used to assess the performance of the jump can be
found on the acceleration signal, such as the height
of the jump. Furthermore, information on the
dynamic behaviour of the jumper, namely during the
flight stage can also be obtained from the
acceleration signal, which is impossible to study
with only the vertical force signal.
In the future, we plan to study the load
distribution between inferior members during the
take-off and landing stages by combining
acceleration and force analysis and study the on-
flight behaviour of the jumper.
REFERENCES
Dowling J., Vamos, L., 1993, J., Identification of Kinetic
and Temporal Factors Related to Vertical Jump
Performance, Applied Biomechanics, 9.
Linthorne, N. P., 2001, Analysis of standing vertical jumps
using a force platform, Am. Journal of Phys., 69 (11).
Hassan R., Begg R. K., Khandoker A. H., Stokes R., 2006,
Automated Recognition of Human Movement in Stress
Situations, Proceedings of the 2
nd
Internationsl
Workshop on Biosignal Procesing and Classification –
BPC 2006, INSTICC Press.
Silva H., Gamboa H., Viegas V., Fred A., 2005, Wireless
Physiologic Data Acquisition Platform., 2005.
Proceedings of the 5
th
Conference on
Telecomunications Confele.
http://www.plux.info
http://www.amtiweb.com/bio/force_platforms.htm
Proakis J. G., Manolakis D., 1995, Digital Signal
Processing: Principles, Algorithms and Applications,
Pearson US Import & PHIPEs, 3
rd
International
Edition.
BIOSIGNALS 2008 - International Conference on Bio-inspired Systems and Signal Processing
396
