
EVALUATION OF NOVEL ALGORITHM FOR SEARCH OF
SIGNAL COMPLEXES TO DESCRIBE COMPLEX
FRACTIONATED ATRIAL ELECTROGRAM
V. Kremen and L. Lhotska
Gerstner Laboratory, Department of Cybernetics, Czech Technical University in Prague, Technicka 2,Prague 6, CZ-166 27
Keywords: Wavelet transform, atrial fibrillation, atrial electrogram, signal complexes.
Abstract: Complex fractionated atrial electrograms (CFAEs) represent the electrophysiologic substrate for atrial
fibrillation (AF). Progress in signal processing algorithms to identify CFAEs sites is crucial for the
development of AF ablation strategies. Individual signal complexes in CFAEs reflect electrical activity of
electrophysiologic substrate at given time. We developed and tested a novel algorithm based on wavelet
transform. This algorithm enables to find individual signal complexes in CFAEs automatically and based
on that the CFAEs complexity can be described in a novel way. The method was tested using a
representative set of 1.5s A-EGMs (n = 113) ranked by an expert into 4 categories: 1 - organized atrial
activity; 2 - mild; 3 - intermediate; 4 - high degree of fractionation. Individual signal complexes were
marked by an expert in every A-EGM in the dataset. This ranking was used as gold standard for comparison
with the novel automatic search method. Achieved results indicate that use of appropriate level of wavelet
signal decomposition could carry high level of predictive information about the state of electrophysiologic
substrate for AF and is efficient to help to describe the level of complexity of CFAEs in a novel way.
1 INTRODUCTION
Atrial fibrillation (AF) is a cardiac arrhythmia
characterized by very rapid and uncoordinated atrial
activation with a completely irregular ventricular
response (Fuster et. al., 2006). Radiofrequency
ablation of atrial areas that triggers or sustains AF is
a nonfarmacological treatment available recently
(Calkins and Brugada, 2007).
During AF, multiple wavefronts propagate
continuously through the right and left atria,
separated by anatomical and functional barriers
(Houben and Allessie, 2006). This can be
electrophysiologically manifested as hierarchical
distribution of dominant frequency (Sanders and
Berenfeld, 2005) or complex fractionated
electrograms (CFAEs) (Nademanee and McKenzie,
2004) during endocardial mapping. Local dominant
frequency analysis of AF is burdened by many
methodological problems of spectral analysis
(Kadish and Goldberger, 2006). Therefore the
software support for electroanatomical mapping
system is focused on objective description and space
representation of CFAEs distribution most recently.
Algorithms for automatic classification (pattern
recognition) are generally based on classification
techniques or description of signal, using features
extracted from recorded and preprocessed signals.
Such algorithms, if they are implemented, could also
suggest level of complexity or degree of
fractionation of particular AEGM signals recorded
during AF.
Till now there is only a single known approach.
However it is not published in full scope, but only in
company brochure (user manual) (Ensite NavX
TM
,
2006). This algorithm assesses level of fractionation
of AEGM signal using calculation and signal
processing in time domain and describes signal by
only one feature which relates to degree of
fractionation of the signal.
We aim to describe AEGM signal in a new
universal way, which helps us to extract features of
the signal and to classify its complexity. There are
signal complexes (figure 2) in every AEGM signal,
which are related to electrical activation of
electrophysiologic substrate during AF. These signal
complexes (SCs) can be found automatically and
then used for several features extraction (degrees of
freedom of the signal), which could be used for
416
Kremen V. and Lhotska L. (2008).
EVALUATION OF NOVEL ALGORITHM FOR SEARCH OF SIGNAL COMPLEXES TO DESCRIBE COMPLEX FRACTIONATED ATRIAL ELECTRO-
GRAM.
In Proceedings of the First International Conference on Bio-inspired Systems and Signal Processing, pages 416-419
DOI: 10.5220/0001069404160419
Copyright
c
SciTePress
automatic evaluation of electrogram complexity (or
level of fractionation) in next stages.
Therefore in this paper we want to introduce a
new method of AEGM signal processing which
enables to localize above mentioned SCs
automatically with adequate efficacy. We describe a
novel method for AEGM processing (searching of
SCs), based on the wavelet transform signal
analysis, which is a well known technique in the
signal processing domain. We also introduce the
design of a wavelet filter of AEGM signal which is
used before search of SCs itself.
2 METHODOLOGY
We used a representative dataset (n = 113) of atrial
electrograms (A-EGMs), which were pre-selected by
an expert from a large database of A-EGMs. This
database was recorded during AF mapping
procedures. Signals were sampled by frequency 977
Hz during AF procedure and resampled to 1 kHz
after that. Each pre-selected A-EGM signal in this
dataset is 1500 ms long. The expert signal selection
was driven by the intention to get a good quality
signals with respect to low noise and high
information value of signal for later evaluation of
degree of A-EGMs fractionation by an expert.
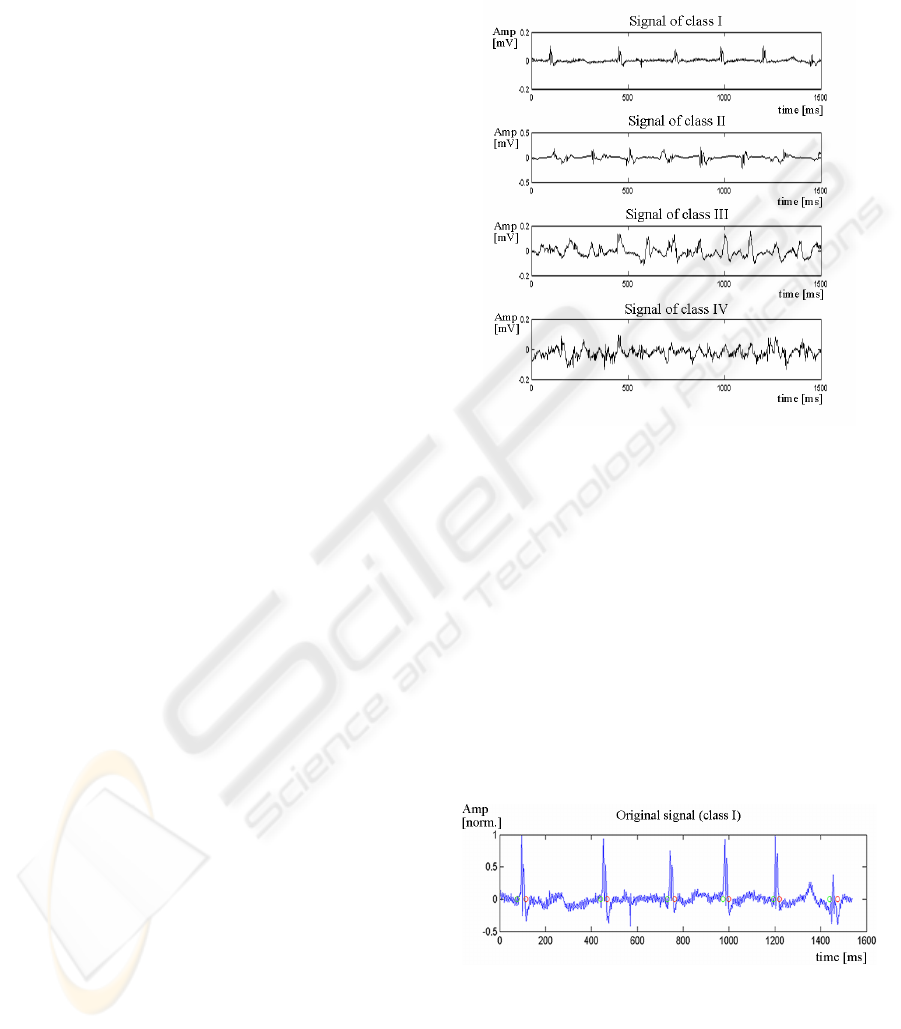
Although the degree of fractionation is supposed to
be naturally continuous we decided to make a four
degree set of classes (Figure 1.).
Three experts used these four categories for
ranking (1 – organized atrial activity, n = 24; 2 –
mild, n = 40; 3 – intermediate, n = 36; 4 - high
degree of fractionation, n = 13.). Individual SCs
(points of interest) were found manually by an
expert in every A-EGM in dataset (Figure 2). The
beginning and the end of every SC was marked by
an expert for all found SCs thru the whole dataset of
used CFAEs. This expert ranking of the beginnings
and the ends of SCs was used as gold standard for
comparison with outputs of the newly introduced
automatic search method (ASM) and evaluation of
ASM effectiveness.
In many applications the Continuous Wavelet
Transform (CWT) is used to decompose a signal
into wavelets, small oscillations that are highly
localized in time. Whereas the Fourier transform
decomposes a signal into infinite length sines and
cosines, effectively losing all time-localization
information, the CWT's basis functions are scaled
and shifted versions of the time-localized mother
wavelet. The CWT is used to construct a time-
frequency representation of a signal that offers very
good time and frequency localization. The CWT is
an excellent tool for mapping the changing
properties of non-stationary signals. When a signal
is regarded non-stationary, the CWT can be used to
identify stationary sections of the data stream.
Figure 1: Four complex fractionated electrograms are
shown. These are representatives of each ranking class of
degree of fractionation ranked by an expert. From the top
to bottom: 1 – organized atrial activity; 2 – mild, 3 –
intermediate; 4 - high degree of fractionation.
The discrete wavelet transform (DWT) is an
implementation of the wavelet transform using a
discrete set of the wavelet scales and translations
obeying some defined rules. In other words, this
transform decomposes the signal into mutually
orthogonal set of wavelets, which is the main
difference from the CWT. The wavelet packet
method is a generalization of wavelet decomposition
that offers a richer range of possibilities for signal
analysis.
Figure 2: Original CFAE signal recorded during AF
mapping procedure. Expert ranking of the signal is into
class I. Depicted amplitude is normalized with respect to
maximal absolute value of this particular CFAE signal.
Green circles denote the beginnings of SCs and red circles
the ends of SCs found automatically by ASM with
optimized parameters.
EVALUATION OF NOVEL ALGORITHM FOR SEARCH OF SIGNAL COMPLEXES TO DESCRIBE COMPLEX
FRACTIONATED ATRIAL ELECTROGRAM
417
We used such multilevel decomposition of CFAE
signal for preprocessing (denoising) of the signal
and for automatic detection of points of interests
(SCs) in the signal. Simple and efficient algorithms
exist for both wavelet packet decomposition and
optimal decomposition selection. We chose the
algorithm implemented and described in Matlab
(function „wavedec“, „waveden“) (Matlab Wavelet
Toolbox 3.0, 2006). As a mother wavelet we chose a
Coiflet wavelet of order four. The selection of
mother wavelet was driven by outcomes of
optimization experiments performed using a Particle
Swarm Optimalization algorithm (Lhotska and
Macas, 2007) where this type of wavelet showed the
best results for our purposes of signal preprocessing
(filtering) and searching of SCs.
Filtering (de-noising) of CFAEs signals was
performed using wavelet transform filter based on
multilevel signal decomposition and thresholding of
detailed coefficients (Mallat, 1999). The mentioned
mother wavelet was used to decompose signal into 5
levels (Daubechies, 1992). Detail coefficients were
thresholded by soft-thresholding (Donoho, 1995)
with these settings of thresholds (level 1 to level 5):
0.02, 0.04, 0.008, 0.008 and 0.008. Reconstruction
of the signal was computed by wavelet
reconstruction based on the original approximation
coefficients and the modified detail coefficients of
levels from 1 to 5. Additional step of CFAEs signals
preprocessing was done by thresholding of the signal
with value of threshold 0.003 mV. Sample of CFAE
signal ranked by an expert into class I, where
described preprocessing technique was performed, is
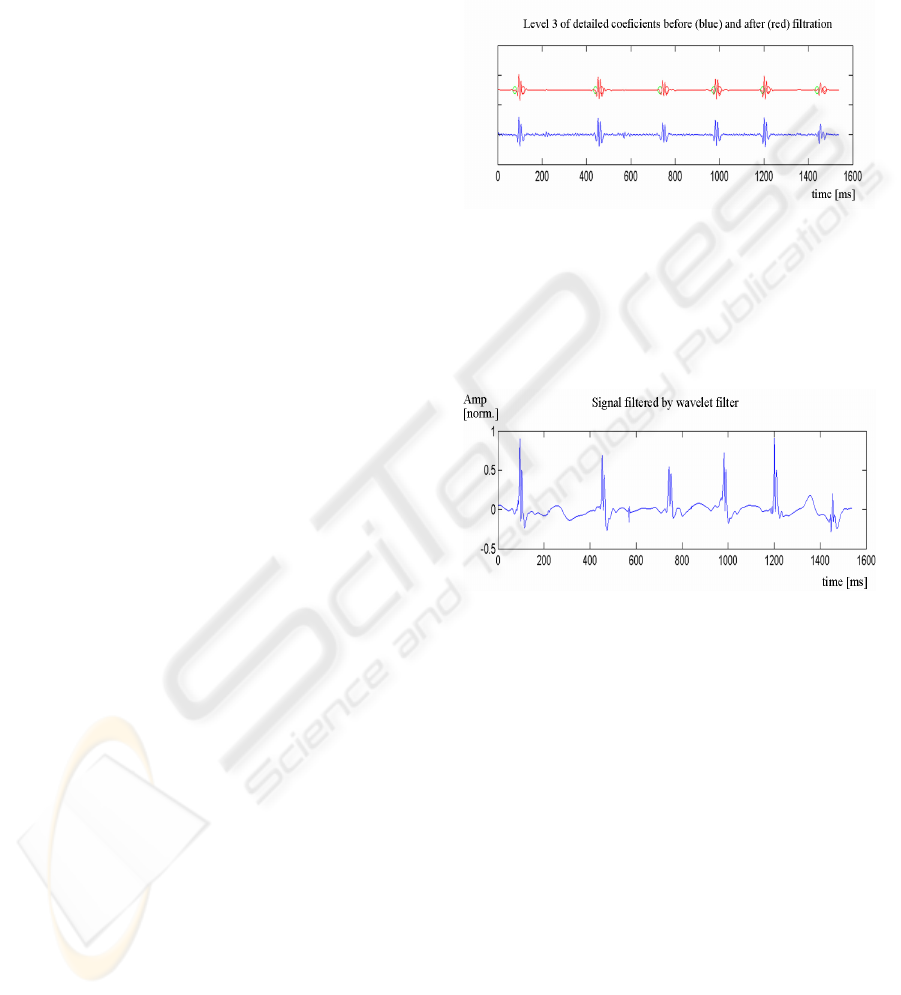
shown in Figure 4.
ASM itself was the next step. It was based again
on wavelet multilevel decomposition of filtered
signal. The signal was decomposed again into 5
levels using Coiflet wavelet of order four. The level
3 of detailed coefficients showed the best transform
to find proper SCs (Figure 3). Therefore the
reconstruction of the detailed coefficients of a signal
(L3) of given wavelet decomposition structure was
performed at level 3 (L3). Figure 3 shows the
difference between L3 before and after signal
preprocessing. Normalization of L3 was performed
with respect to maximal absolute value of given L3
values to obtain uniform signals across the dataset
for next stages of SCs detection. Thresholding of
normalized L3 signal values was performed with
value of threshold 0.014. Then all parts of the signal,
where absolute value of amplitude was higher than
0, were marked as peaks with amplitude 1. These
peaks were related to time localization of electrical
activity of AF substrate in individual CFAE signals.
The last step of the algorithm consists in joining
all peaks that lie very close to each other into one
SC. Therefore all peaks whose inter-distance was
closer than threshold 5 ms were joined together and
they were marked as one individual SC (Figure 2
and 3).
Figure 3: Reconstruction of the detailed coefficients of a
signal from figure 1 of given wavelet decomposition
structure performed at level 3 (L3). Blue signal shows L3
before wavelet filtering. Red signal is L3 reconstruction
after filtering. Green circles denote the beginnings of SCs
and red circles the ends of SCs found automatically by
ASM with optimized parameters.
Figure 4: CFAE signal from figure 1 filtered by above
mentioned wavelet filter. Depicted amplitude is
normalized with respect to maximal absolute value of this
particular CFAE signal.
All mentioned optional parameters of CFAE
signal preprocessing algorithm and ASM itself (level
used for searching of SCs and filtering, thresholds,
and inter-segment distance threshold) were
optimized by Particle Swarm Optimization
algorithm (PSO), to get optimal parameters settings
with respect to hit rate of ASM in comparison to
expert marking of SC. The details and utilization of
PSO is out of scope of this paper.
3 RESULTS
We evaluated the presented algorithm by calculating
its hit rate, which was defined by using standard
criteria of specificity. The overall results of ASM
BIOSIGNALS 2008 - International Conference on Bio-inspired Systems and Signal Processing
418

sensitivity through all classes of CFAEs are shown
in Table 1.
The best results were achieved in class I and II,
where the signification of SCs can be performed
very precisely by an expert. There is low sensitivity
of ASM to approach the signals of class IV to find
and confirm the SCs signified by an expert.
4 CONCLUSIONS
The newly introduced ASM is able to find SCs with
high sensitivity in class I and II and is worse to
approach the expert SC classification in classes III
and IV in the used dataset. The expert can hardly see
and relate the electropathologic AF substrate
activation in signal of classes III and IV to
individual SCs and he/she can hardly properly mark
corresponding beginnings and ends of the SCs. That
means there could be incorrective error of
classifying SCs in the used gold standard. It could be
pandering that ASM could disclose hidden
characteristics of the CFAE signal related to
electropathologic AF substrate. These could be
hardly seen in time domain only, especially at
signals of class III and IV.
We could therefore use the features extracted
from found SCs for CFAE signal description and
evaluation of CFAE signal complexity. Therefore it
might be suitable to use description of CFAE signal
based on such time domain characteristics. Good
descriptor for separation of classes of CFAE signals
could be an intersegment distance of SCs or SCs
fractionation itself.
Table 1: Hit rate of ASM with optimal parameters setting
for each class of AEGM signals separately. SCs of given
dataset, marked by an expert were used as gold standard.
Sensitivity
Class I
100%
Class II
98.2%
Class III
92.6%
Class IV
63.89%
But as the results suggest we could use also
CFAEs signals descriptors based on characteristics
of mentioned wavelet level decomposition. The
decomposition can serve to find more hidden
features of CFAE signals, which could help us to
distinguish between CFAE classes. Especially class
III and IV could be difficult to distinguish with
features extracted in time domain only. Future work
will show if this new approach of automatic
description of level of complexity of CFAE signal
will have good results comparable to expert ranking.
ACKNOWLEDGEMENTS
This work has been supported by the MEYS of the
Czech Republic (under project No. MSM
6840770012 "Transdisciplinary Biomedical
Engineering Research II").
REFERENCES
Fuster V, Ryden LE, Cannom DS, et al. ACC/AHA/ESC
2006. Guidelines for the management of patients with
atrial fibrillation. Circulation 2006; 114:257-354.
Calkins H, Brugada J, Packer DL, et al.
HRS/EHRA/ECAS expert consensus statement on
catheter and surgical ablation of atrial fibrillation:
recommendations for personnel, policy, procedures
and follow-up. Heart Rhythm 2007;4:816-61.
Houben RPM, Allessie MA. Processing of intracardiac
electrograms in atrial fibrillation. Diagnosis of
electropathological substrate of AF. IEEE Eng Med
Biol Mag 2006; 25: 40-51.
Sanders P, Berenfeld O, Hocini M, et al. Spectral analysis
identifies sites of high-frequency activity maintaining
atrial fibrillation in humans. Circulation 2005;
112:789-97.
Nademanee K, McKenzie J, Kosar E, et al. A new
approach for catheter ablation of atrial fibrillation:
mapping of the electrophysiologic substrate. J Am
Coll Cardiol 2004; 43:2044-53.
Ng J, Kadish AH, Goldberger JJ. Effect of electrogram
characteristics on the relationship of dominant
frequency to atrial activation rate in atrial fibrillation.
Heart Rhythm 2006; 3:1295-305.
Ensite NavX
TM
Navigation and Visualisation Technology
(Fractionation Mapping Tool Procedure Guide, Ensite
6), pp. 2-8, St. Jude Medical, 2006.
Matlab Wavelet Toolbox 3.0 reference manual. The
MathWorks, Inc. 2006.
Lhotská, L. - Macaš, M.: Particle Swarm Optimization for
Processing and Analysis of Biological Signals. In
Proceedings of Workshop 2007. Prague: CTU, 2007.
Mallat, S. A Wavelet tour of Signal Processing. 2. edition.
ISBN/ISSN:0-12-466606-X. Academic Press. 1999.
Daubechies I.: Ten lectures on Wavelts, CBMS-NSF,
SIAM, 61, Philadelphia, Pennsylvania, USA, 1992.
Donoho, D.L. (1995), "De-noising by soft-thresholding,"
IEEE Trans. on Inf. Theory, 41, 3, pp. 613-62
EVALUATION OF NOVEL ALGORITHM FOR SEARCH OF SIGNAL COMPLEXES TO DESCRIBE COMPLEX
FRACTIONATED ATRIAL ELECTROGRAM
419
