
DIFFERENCES IN PHYSIOLOGICAL RESPONSES TO THE
INTENSITY OF MENTAL STRESS
Chi’e Soga, Chikamune Wada
Graduate School of Life Science and Systems Engineering, Kyushu Institute of Technology
2-4 Hibikino, Wakamatsu-ku, Kitakyushu, Fukuoka, 808-0196, Japan
Shinji Miyake
University of Occupational and Environmental Health, Japan
1-1 Iseigaoka, Yahatanishi-ku, Kitakyushu, Fukuoka, 807-8555, Japan
Keywords: Autonomic nervous system, RRI, plethysmogram, skin potential level, blood pressure, mental workload.
Abstract: It is widely understood that mental stress produces various physiological changes. Though the relationship
between mental stress and physiological response has been extensively reported, few reports have tried to
clarify the relationships between various physiological responses and the intensity level of stress. In this
study, we investigated autonomic nervous system activities to find a physiological index based on which we
can evaluate the intensity of mental stress. As a result, we found that there were different response patterns
for each physiological index. We consider that each physiological index shows different feelings and/or
situations related to mental stress.
1 INTRODUCTION
In our country, the increase in psychiatric disorders,
such as depression and schizophrenia, is noted. The
number of suicides per year has been steadily high in
recent years, with more than 30,000 people a year
since 1998. This increase in psychiatric disorders
and high rate of suicide are serious problem in
Japan.
It is believed that these daily stresses play a role
in a
number of psychiatric disorders. If we can
evaluate daily stress quantitatively and determine
our own or other people mental state, this could
contribute to the prevention of various diseases
caused by mental stress.
It is widely understood that physiological
chan
ges induced by mental stress are related to the
autonomic nervous system, and can affect the heart
rate, blood pressure and plethysmogram. The
relationship between mental stress and physiological
feedback has been extensively reported (Takatsu et
al., 2000, Mishima, Kubota and Nagata, 1999).
We also consider that establishing a quantitative
ev
aluation method for mental stress will help
prevent diseases caused by mental stress. It is
necessary to examine the intensity of stress to realize
a quantitative evaluation of mental stress. However,
few reports have tried to clarify the relationships
between physiological responses and the intensity of
stress. In this paper, we investigated the autonomic
nervous system activity in the three conditions for
the intensity of mental stress.
2 METHOD
We used a mental arithmetic task as the mental
workload and measured the physiological and
subjective responses.
2.1 Task
A target three-digit number, several two-digit
numbers and an OK button were displayed on a
computer screen. The participants
were required to
select th
e combination of three two-digit numbers
whose sum is equal to the target number and click
the OK button.
Whenever a participant clicked the
298
Soga C., Wada C. and Miyake S. (2008).
DIFFERENCES IN PHYSIOLOGICAL RESPONSES TO THE INTENSITY OF MENTAL STRESS.
In Proceedings of the First International Conference on Bio-inspired Systems and Signal Processing, pages 298-301
DOI: 10.5220/0001069702980301
Copyright
c
SciTePress
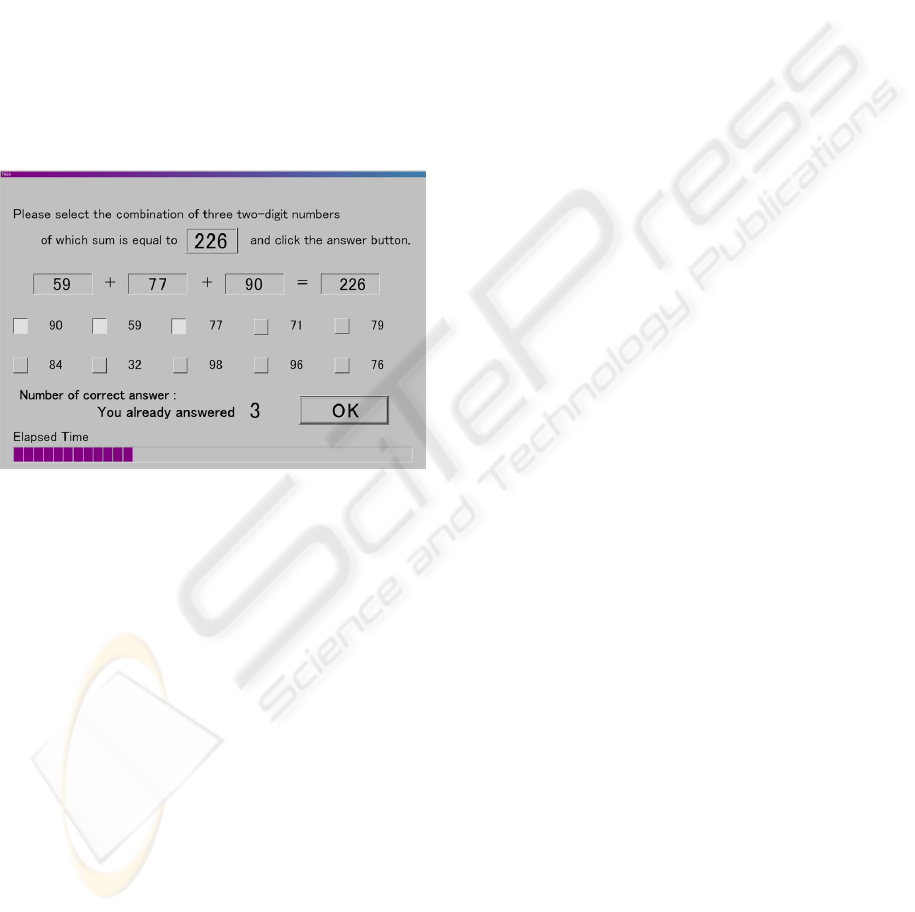
OK button, the sum of the selected numbers was
shown on the screen. If the sum was equal to the
target number, the next arithmetic question was
displayed. The participant could choose different
combinations of numbers until the right one was
chosen. The elapsed time and the number of correct
answers were also displayed on the screen. The task
screen is shown in Figure 1.
The three conditions were used for the intensity
of mental stress. The conditions were as follows:
TASK1 (High level): The number of
two-digit
number is ten.
TASK2 (Medium level): The number of
two-
digit
number is eight.
TASK3 (Low level): The number of
two-digit
number is five.
Figure 1: Mental arithmetic task screen of high level.
2.2 Physiological Measurements and
Subjective Assessment
We measured the electrocardiogram (ECG),
plethysmogram (PTG), blood pressure (BP), tissue
blood pressure (TBV) and skin potential levels
(SPL). These signals were recorded in a PC at a 1-
kHz sampling rate. Also, stroke volume (SV) and
cardiac output (CO) were obtained every heartbeat.
The R-R interval (RRI), LF/HF ratio, systolic
blood pressure (SBP), diastolic blood pressure
(DBP), mean blood pressure (MBP=DBP+(SBP-
DBP)/3), baroreceptor reflex sensitivity
(BRS=square root of (LF of SBP/LF of RRI)),
amplitude of the PTG and total peripheral resistance
(TPR=MBP/CO) were calculated.
The National Aeronautics and Space
Administration Task Load Index (NASA-TLX),
Profile of Mood States (POMS) and the semantic
differential method (SD method) were used to obtain
the subjective responses.
The NASA-TLX is a widely used subjective
workload assessment technique (Hart and Staveland,
1988). The WWL value was calculated. The POMS
consists of 65 adjectives and assesses six mood
states dimensions. We used 24 adjectives related to
Tension-Anxiety (TA), Vigor (V) and Fatigue (F)
for reducing the participant’s burden. The SD
method comprising seventeen items was used to
assess the participants’ emotions.
2.3 Procedure
The participants were familiarized with what to
expect during the task before the start of the
experiment. Each participant underwent the
experiment procedure once.
The experimental procedure was as follows:
1. Rest1 (6 min: PRE1)
2. High level arithmetic (6 min: TASK1)
3. POMS, NASA-TLX and SD method
4. Rest2 (6 min: PRE2)
5. Medium level arithmetic (6 min: TASK2)
6. POMS, NASA-TLX and SD method
7. Rest3 (6 min: PRE3)
8. Low level arithmetic (6 min: TASK3)
9. POMS, NASA-TLX and SD method
10. Rest4 (6 min: POST)
The participants were instructed to provide at
least fifteen correct answers in six minutes and not
to give up until the six-minute run was finished. If
the participants completed the task (i.e. gave the
minimum number of correct answers) before the
deadline, they were required to continue giving
correct answers. After six minutes, the run was
finished, and the participants were asked to cease the
mental arithmetic activity even if they had not
completed the task. The number of correct answers
was displayed on the screen to let the participants
know when the task was completed.
2.4 Participants
Sixteen healthy male graduate students aged 21 to
32 (average: 23.8 yrs.) participated in this study. All
participants gave their written informed consent.
DIFFERENCES IN PHYSIOLOGICAL RESPONSES TO THE INTENSITY OF MENTAL STRESS
299
3 DATA ANALYSIS
3.1 Statistical Analysis
The data were divided into seven 6-minute blocks
(PRE1, TASK1, PRE2, TASK2, PRE3, TASK3 and
POST). All parameters were standardized for each
participant.
The results were analyzed by repeated
measures of analysis of variance (ANOVA) using
SPSS 11.0J. The degree of freedom was adjusted
using the Greenhouse-Geisser correction. Tukey’s
honestly significant difference (Tukey’s HSD) test
was used in the post-hoc analysis.
3.2 Subjective Assessment
Three factors (FACTOR1, FACTOR2 and
FACTOR3) were obtained from the seventeen items
of the SD method using Factor Analysis. The factor
scores, NASA-TLX scores, POMS scores and all
physiological indices were standardized for each
participant. The correlation coefficients of 48 pairs
of subjective assessments and physiological indices
were calculated.
4 RESULTS AND DISCUSSION
4.1 Differences in Physiological
Response
The WWL value of Task3 was significantly low
(p<0.05). The results of the multiple comparison
revealed that there were no significant differences in
WWL value between Task1 and Task2. This result
indicated that the condition of Task3 was simpler
than the conditions of the other two tasks.
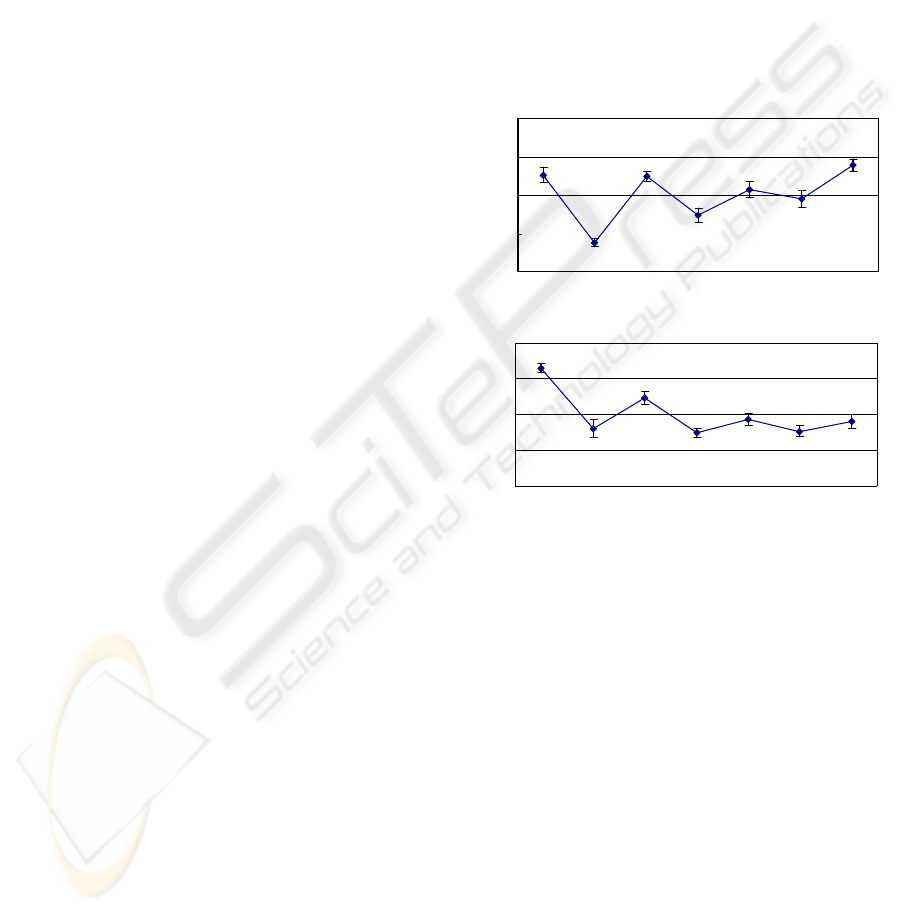
There were two patterns for each physiological
response in both different cases: task periods and the
resting periods. Figure 2 shows the averages of the
SPL and the amplitude of the PTG for all the
participants. Both parameters were significantly
lower in TASK1 and TASK2 comparing with resting
periods. The SPL values indicated that the changes
during the task were smaller when the difficulty
level became low. The RRI, SBP, DBP, BRS and
TPR showed a tendency similar to that of the SPL.
The amplitude of the PTG indicated that the
responses after the completion of the task (during
rest) were smaller when the difficulty level became
low. The TBV, CO and SV showed a tendency
similar to the amplitude of the PTG. There was no
discernible tendency in the LF/HF ratio.
In a previous study, we found that there were
different recovery patterns for each physiological
index (Soga, Miyake and Wada, 2007). In this study,
there were also different recovery patterns for the
various physiological indices. These results suggest
that each physiological response corresponds to
different feelings and/or situations. A difference in
response during the task might correspond to
“Executing task” and the feeling of “Tension.” A
difference in response after the task might
correspond to “Task performance” and the feeling of
“Regret.”
-2
-1
0
1
2
PRE1 TASK1 PRE2 TASK2 PRE3 TASK3 POST
Standardized Scor
SPL
e
-2
-1
0
1
2
PRE1 TASK1 PRE2 TASK2 PRE3 TASK3 POST
Standardized Scor
Amplitude of PTG
e
Figure 2: The average changes in the physiological
responses for each block. The bars indicated the standard
errors of the mean.
4.2 Correlation Coefficient between the
Subjective Measurements and the
Physiological Indices
There were significant correlation between the
FACTOR1 score and the DBP (r=-0.340; p<0.05),
MBP (r=-0.312; p<0.05) and SPL (r=0.506;
p<0.001). There were significant correlation
between the FACTOR2 score and the SPL (r=0.322;
p<0.05). The FACTOR3 score significantly related
to the SBP (r=-0.350; p<0.05), DBP (r=-0.378;
p<0.05), MBP (r=-0.364; p<0.05), BRS (r=0.415;
p<0.01), RRI (r=0.433; p<0.01) and SPL (r=0.312;
p<0.05). The FACTOR1 consisted of the following
items: “Difficult-Easy,” “Troublesome-Smooth,” “I
felt the task duration was short-I felt the task
duration was long,” etc. Therefore we consider that
BIOSIGNALS 2008 - International Conference on Bio-inspired Systems and Signal Processing
300

the FACTOR1 relates to the degree of difficulty of
the task. The FACTOR2 consisted of the following
items: “Dislike-Like,” “Boring-Interesting” and “I
want to execute the task-I don’t want to execute the
task.” The FACTOR3 was as follows: “Respond
randomly-Respond after proper calculation.” We
consider that the FACTOR2 relates to the
participants’ concentration and the FACTOR3
relates to the participants’ attitude.
The NASA-TLX revealed that there were
significant correlation between the TD and SPL (r=-
0.676; p<0.001), and the OP and the amplitude of
the PTG (r=-0.324; p<0.05). The POMS showed that
there were significant correlation between V and the
SPL (r=-0.381; p<0.05), and F and the amplitude of
the PTG (r=-0.308; p<0.05).
Although some physiological indices seemed to
correlate with the subjective assessments because
the correlation values were small, there were only
three blocks for standardization, and all the data
were pooled. At least, we consider that each
physiological response corresponds to different
feelings and/or situations. This suggests that the
classification of physiological responses according
to the results of the subjective assessment is helpful
in investigating the complex information contained
in each physiological index. In our past study, we
found that the SPL related to the time pressure (Soga,
Miyake and Wada, 2007). In this study, the SPL
results showed a tendency similar to that found in
our past study. Therefore we consider that the SPL is
a sensitive index for the estimation of mental stress.
5 CONCLUSIONS
We found that there were two patterns for each
physiological response of the autonomic nervous
system during the task periods and the resting
periods at three different difficulty levels (high,
medium and low). Significant difference in PTG
amplitude between task and after task resting period
was disappeared in the last two blocks (TASK3 and
POST). In addition, we found that there were
significant correlation between the physiological
changes and the subjective assessments.
These results suggest that each physiological
response corresponds to different feelings and/or
situations related to mental stress. Further
experiment should be done to confirm this result.
Our final aim is to establish a quantitative evaluation
method for mental stress.
REFERENCES
Hart S H. and Staveland L. E., 1988. Elsevier Science
Publishers B.B., pp.139-183, Amsterdam Development
of NASA-TLX (Task Load Index): Result of Empirical
and Theoretical Research, In P. A. Hancock and N.
Meshkati (eds.), Human Mental Workload.
Mishima N, Kubota S and Nagata S, 1999. Psychotherapy
and Psychosomatics, Vol.68, No.4, 207-213,
Psychological correlates of relaxation induced by
standard autogenic training.
Soga C, Miyake S, Wada C, 2007. SICE Annual
Conference 2007, 1366-1371, Recovery patterns in the
physiological responses of the autonomic nervous
system induced by mental workload.
Takatsu H, Munakata M, Ozaki O, Yokoyama K,
Watanabe Y and Tanaka K, 2000. T.IEEE Japan,
Vol.120-C, No.1, 104-110, An evaluation of the
quantitative relationship between the subjective stress
value and heart rate variability (in Japanese).
DIFFERENCES IN PHYSIOLOGICAL RESPONSES TO THE INTENSITY OF MENTAL STRESS
301
