A CORRECTIVE FRAMEWORK FOR FACIAL FEATURE
DETECTION AND TRACKING
Hussein O. Hamshari, Steven S. Beauchemin
Department of Computer Science, University of Western Ontario, 1151 Richmond Street, London, Canada
Denis Laurendeau
Department of Electrical and Computer Engineering, Universit´e Laval, Qu´ebec, Canada
Normand Teasdale
Departement de Medecine Sociale et Preventive Faculte de Medecine, Universit´e Laval, Qu´ebec, Canada
Keywords:
Face, facial feature, recognition, detection, tracking, corrective tracking, integrated framework, real-time.
Abstract:
Epidemiological studies indicate that automobile drivers from varying demographics are confronted by dif-
ficult driving contexts such as negotiating intersections, yielding, merging and overtaking. We aim to detect
and track the face and eyes of the driver during several driving scenarios, allowing for further processing of
a driver’s visual search pattern behavior. Traditionally, detection and tracking of objects in visual media has
been performed using specific techniques. These techniques vary in terms of their robustness and computa-
tional cost. This research proposes a framework that is built upon a foundation synonymous to boosting. The
idea of an integrated framework employing multiple trackers is advantageous in forming a globally strong
tracking methodology. In order to model the effectiveness of trackers, a confidence parameter is introduced
to help minimize the errors produced by incorrect matches and allow more effective trackers with a higher
confidence value to correct the perceived position of the target.
1 INTRODUCTION
Our study of visual patterns of interest in drivers is
facilitated through the development of a robust com-
puter vision system. The intelligent system, devel-
oped as part of this project, is aimed at reinforcing
behaviors characterizing skilled drivers separate from
behaviors that are sub-optimal. To achieve such an
objective, new methods and tools are developed based
on the extraction of three types of information from
video streams captured during driving scenarios: head
motion in 3D space, eye motion (gazing), and facial
expressions of the driver in response to different stim-
uli.
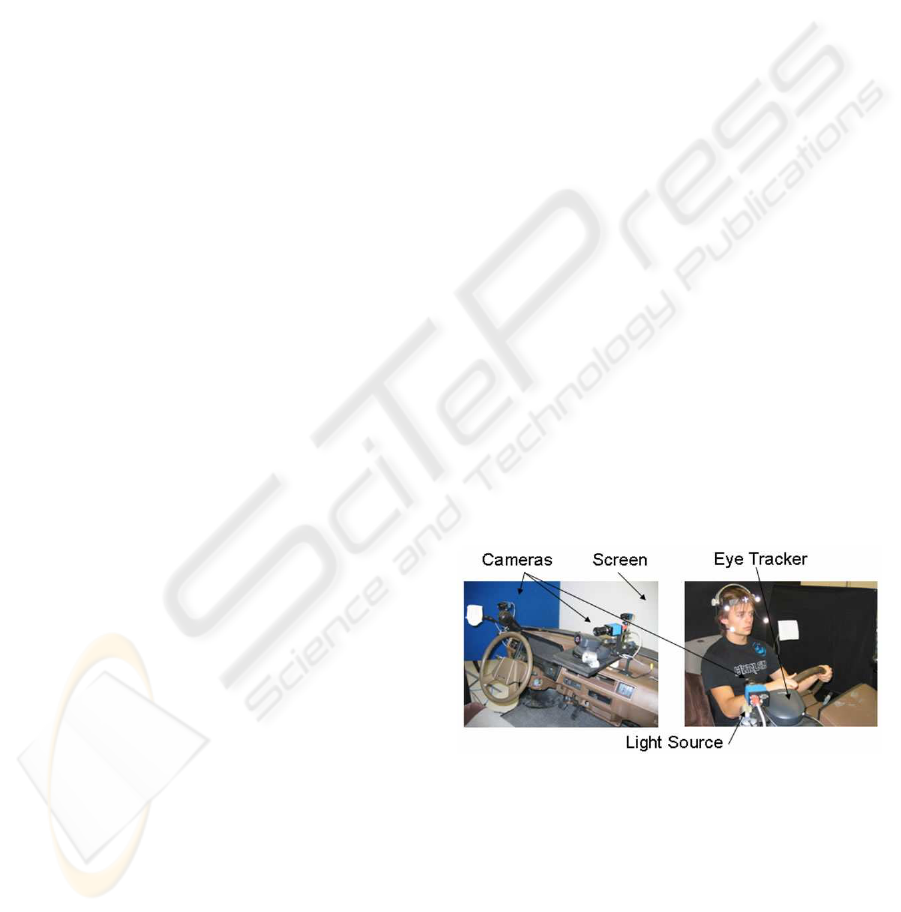
The camera setup for this project allows for sev-
eral computer vision applications. Figure 1 shows the
schematics for the simulator and how the cameras are
put together to provide maximum knowledge of the
surrounding environment. The computer vision sys-
tem is comprised of: i) A set of three Black & White
firewirevideo cameras, ii) an infrared lighting system,
Figure 1: The simulator setup showing the different compo-
nents used for data acquisition.
iii) a virtual reality screen onto which the driving sce-
narios are projected (Figure 2), and iv) an eye tracker
camera.
Given the various tasks set out for the project, this
contribution is only concerned with the detection and
tracking of selected facial features in the given video
sequences from the three camera inputs. We aim to
130
O. Hamshari H., S. Beauchemin S., Laurendeau D. and Teasdale N. (2008).
A CORRECTIVE FRAMEWORK FOR FACIAL FEATURE DETECTION AND TRACKING.
In Proceedings of the Third International Conference on Computer Vision Theor y and Applications, pages 130-138
DOI: 10.5220/0001070401300138
Copyright
c
SciTePress
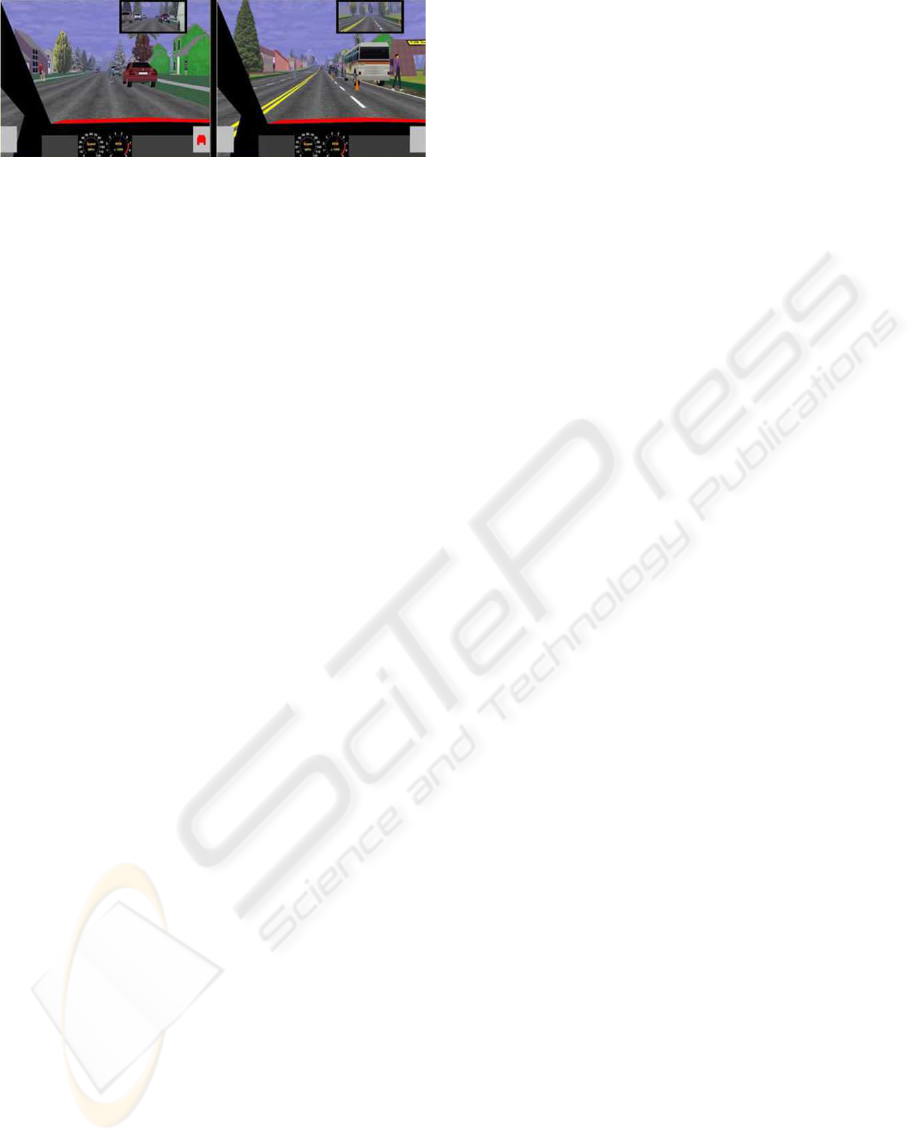
Figure 2: Virtual reality screens showing different driving
contexts: left). Pedestrians crossing the street, and right) a
bus stopped on the roadside.
detect and track the face and eyes of the driver dur-
ing several driving scenarios, allowing for further pro-
cessing of a driver’s visual search pattern behavior.
Figure 3 shows the input from the three cameras.
2 BACKGROUND
The techniques developed by Leinhart and Maydt
(Leinhart and Maydt, 2002) extend upon a machine-
learning approach that has originally been proposed
by Viola and Jones (Viola and Jones, 2001). The
rapid object detector they propose consists of a cas-
cade of boosted classifiers. Boosting is a machine
learning meta-algorithm used for performing super-
vised learning. These boosted classifiers are trained
on simple Haar-like, rectangular features chosen by
a learning algorithm based on AdaBoost (Freund and
Schapire, 1995). Viola and Jones have successfully
applied their object detection method to faces (Vi-
ola and Jones, 2004), while Cristinacce and Cootes
(Cristinacce and Cootes, 2003) have used the same
method to detect facial features. Leinhart and Maydt
extend the work of Viola and Jones by establishing a
new set of rotated Haar-like features which can also
be calculated very rapidly while reducing the false
alarm rate of the detector. In the techniques proposed
by Zhu and Ji (Zhu and Ji, 2006), a trained AdaBoost
face detector is employed to locate a face in a given
scene. A trained AdaBoost eye detector is applied
onto the resulting face region to find the eyes; a face
mesh, representing the landmark points model, is re-
sized and imposed onto the face region as a rough es-
timate. Refinement of the model by Zhu and Ji is ac-
complished by fast phase-based displacement estima-
tion on the Gabor coefficient vectors associated with
each facial feature. To cope with varying pose scenar-
ios, Wang et al. (Wang et al., 2006) use asymmetric
rectangular features, extended by Wang et al. from
the original symmetric rectangular features described
by Viola and Jones to represent asymmetric gray-level
features in profile facial images.
Shape modeling methods for the purpose of fa-
cial feature extraction are common among computer
vision systems due to their robustness (Medioni and
Kang, 2005). Active Shape Models (Cootes et al.,
1995) (ASM) and Active Appearance Models (Cootes
et al., 1998) (AAM) possess a high capacity for fa-
cial feature registration and extraction. Such effi-
ciency is attributed to the flexibility of these meth-
ods, thus compensating for variations in the appear-
ance of faces from one subject to another (Ghrabieh
et al., 1998). However, a problem displayed by both
ASM and AAM techniques is the need for initial reg-
istration of the shape model close to the fitted solu-
tion. Both methods are prone to local minima oth-
erwise (Cristinacce and Cootes, 2004). Cristinacce
and Cootes (Cristinacce and Cootes, 2006) use an
appearance model similar to that used in AAM, but
rather than approximating pixel intensities directly,
the model is used to generate feature templates via
the proposed Constrained Local Model (CLM) ap-
proach. Kanaujia et al. (Kanaujia et al., 2006) em-
ploy a shape model based on Non-negative Matrix
Factorization (NMF), as opposed to Principal Compo-
nent Analysis (PCA) traditionally used in ASM meth-
ods. NMF models larger variations of facial expres-
sions and improves the alignment of the model onto
corresponding facial features. Since large head rota-
tions make PCA and NMF difficult to use, Kanaujia et
al. use multi-class discriminative classifiers to detect
head pose from local face descriptors that are based
on Scale Invariant Feature Transforms (SIFT) (Lowe,
1999). SIFT is typically used for facial feature point
extraction on a given face image and works by pro-
cessing a given image and extracting features that are
invariant to the common problems associated with ob-
ject recognition such as scaling, rotation, translation,
illumination, and affine transformations.
3 TECHNIQUE DESCRIPTION
Our approach makes use of several techniques for
processing input sequences of drivers following given
scenarios in the simulator. Such techniques have been
used successfully on their own (Leinhart and Maydt,
2002; Lowe, 1999) and as part of a more extended
framework (Kanaujia et al., 2006). Acceptable face
and facial feature detections were produced at good
success rates. Each technique used in our framework
is treated as a module and these modules are classified
into two major groups: detectors, and trackers. Detec-
tors localize the facial regions automatically and lay a
base image to be used for tracking by other modules.
A base image is a visual capture of a particular facial
A CORRECTIVE FRAMEWORK FOR FACIAL FEATURE DETECTION AND TRACKING
131
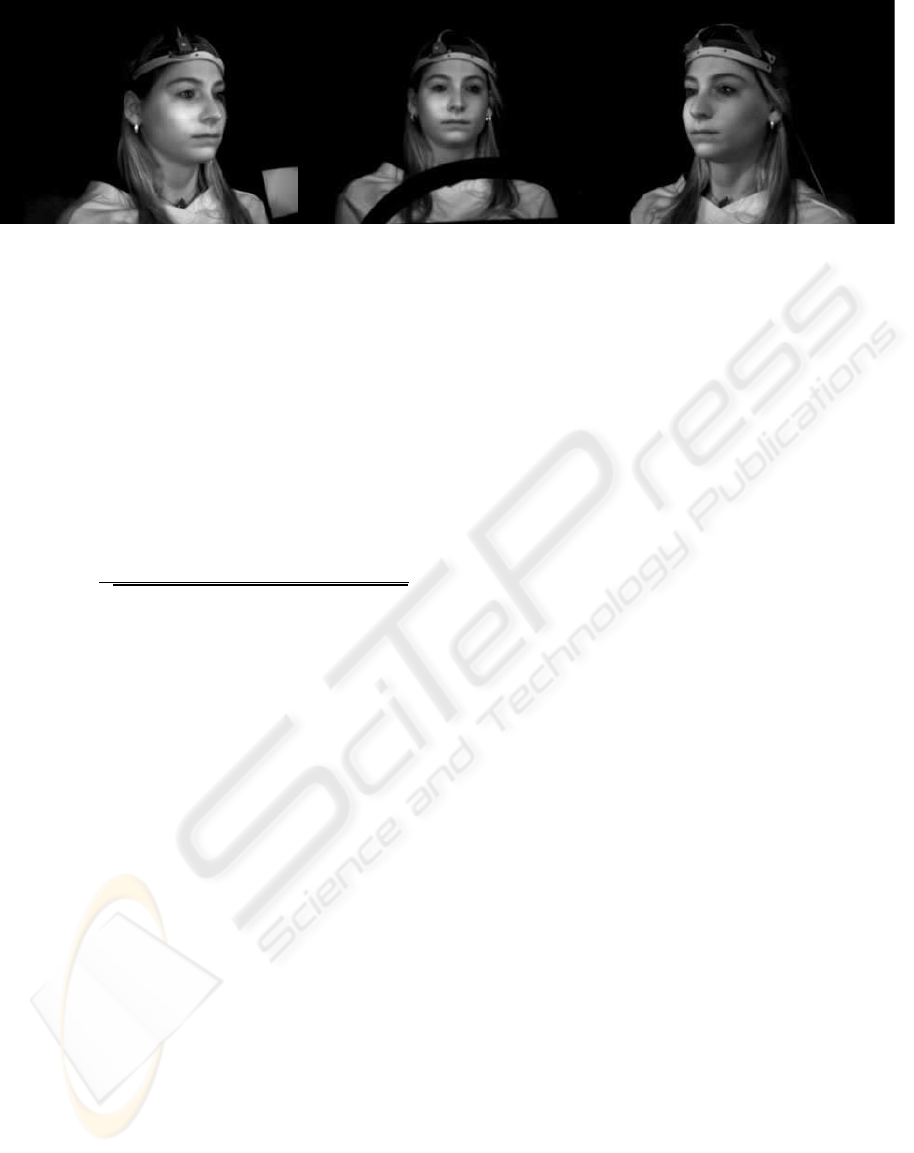
Figure 3: Visual input taken from the three cameras mounted on the simulator.
region and can be used to perform a match against
several other regions throughout the input sequence.
Trackers use the base image set out by the detec-
tors and employ matching algorithms to retrieve the
correct position of the same facial region across fol-
lowing frames. Our framework uses a tracker based
on Scale-Invariant Feature Transform (SIFT) (Lowe,
1999) and a second tracker that uses a normalized cor-
relation coefficient (NCC) method as follows:
˜
R(x, y) =
∑
h−1
y
′
=0
∑
w−1
x
′
=0
˜
T(x
′
,y
′
)
˜
I(x+x
′
,y+y
′
)
q
∑
h−1
y
′
=0
∑
w−1
x
′
=0
˜
T(x
′
,y
′
)
2
∑
h−1
y
′
=0
∑
w−1
x
′
=0
˜
I(x+x
′
,y+y
′
)
2
where
˜
T(x
′
, y
′
) = T(x
′
, y
′
)−
¯
T,
˜
I(x+x
′
, y+y
′
) = I(x+
x
′
, y+ y
′
)−
¯
I, and where
¯
T and
¯
I stand for the average
value of pixels in the template raster and current win-
dow of the image, respectively. T(x, y) is the value of
the template pixel in the location (x, y) and I(x, y) is
the value of the image pixel in the location (x, y).
The rapid object detector (ROD) proposed by Vi-
ola and Jones (Viola and Jones, 2001) is a hybrid in
that it can be classified as both a detector and tracker;
it is employed to detect the face and localize the eyes,
while the SIFT and NCC trackers only deal with the
eye regions. Often, a tracker in our framework may
lose a target due to fast movement of the driver’s
head; a false positive base image may be registered
at that time and the off-target tracker may eventually
be tracking the wrong region as a consequence. As
a detector, the ROD localizes the face and facial fea-
tures automatically. As a tracker, it is used to track
the eyes in between frames and to correct off-target
trackers allowing for a second registration of a base
image. Figure 4 shows an example of how a tracker
can lose its target and provide misleading informa-
tion with regards to the position of the eyes. One
could argue that only one registration of the base im-
age should be used. However, given that the classifier
is not perfect, and is vulnerable according to its as-
sociated false positive rate, the base image registered
could be an invalid region of the face, incorrectly per-
ceived as an eye. Several base image registrations are
therefore needed along the sequence.
The framework uses a look-up table composed of
blurred, scaled down Gaussian images. The Gaussian
pyramid method (Burt and Adelson, 1983) creates a
stack of images that are successively smaller; the base
image of the pyramid is defined as the original im-
age and each image at any given level is composed
of local averages of pixel neighborhoods of the pre-
ceding level of the pyramid. Detectors employed in
our framework process the highest level of the pyra-
mid first. In the case where an object of interest is not
detected, the next level down is processed in a sim-
ilar manner. The bottom-up approach used to detect
faces and eyes in our framework reduces the process-
ing time required by the detectors.
The three cameras available on the cockpit of the
simulator provide all views of the driver necessary to
achieve continuous tracking: A tracker may lose its
target if the driver was to check his/her blind spot,
but given the camera setup installed onto the cock-
pit, a driver can be studied at all times. In order to
achieve continuous tracking, the framework must de-
tect a change in a driver’s head pose, and act upon
such an event accordingly by flipping between the
available views. For each frame that is processed by
the ROD tracker, the framework keeps track of the
number of hits and misses for the left m
L
and right
m
R
eyes within a detected face. Hits lower the value
of m
L
or m
R
whereas misses increase their values ac-
cordingly. A switch from one view to another occurs
when the value of either m
L
or m
R
exceeds a certain
threshold τ, signifying that one (or two) of the eyes
are being missed, leading to the conclusion that a head
pose is in progress. Depending on which eye has been
repeatedly missed, the appropriate view is placed as
the primary view and processed until another switch
is needed.
3.1 Corrective Tracking
The various methods used in our framework produce
good results, whether for detecting or tracking objects
VISAPP 2008 - International Conference on Computer Vision Theory and Applications
132
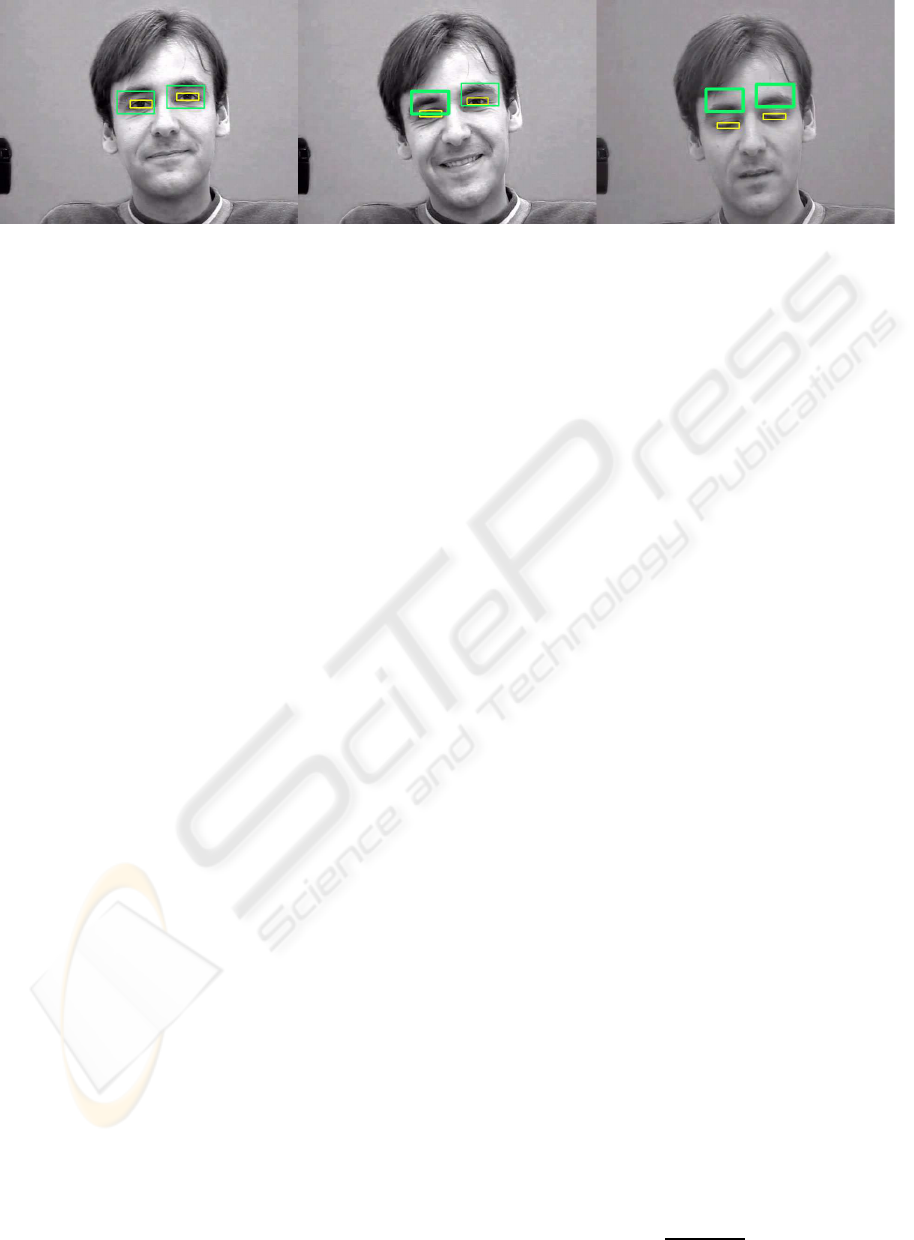
Figure 4: An example sequence where a tracker loses its target, performed on an annotated sequence of a talking face,
available at Dr. Tim Cootes’ website (Cootes, 2007). From left to right: a). The eyes, the tracker’s target in this case, have
been acquired and are tracked throughout several frames, b) the person’s head moved by a significant amount and a base
image was registered according to the interval set, c) and, since the base image, registered by the tracker, is a false positive,
tracking is now being performed on the wrong region of the face.
of interest in a given scene. The quality of the Haar-
based classifier used by the rapid object detector is
determined by its ability to correctly predict classifi-
cations for unseen (negative)examples. The classifier
must be evaluated with a set of examples that is sep-
arate from the training set of samples used to build
it. In many cases, some of the negative examples that
should be used during the training phase of the clas-
sifier are missed and, in such a case, errors are intro-
duced when the same negative example is seen by the
classifier. Detectors and trackers can be corrective in
that errors introduced by one module in our frame-
work are likely to be corrected by one or more of the
modules throughout the input sequence. An off-target
tracker can be corrected by a hybrid detector/tracker
in order to allow for a second registration of a base
image of the eye and, vice versa, where a false pos-
itive detection of the eye region by the hybrid detec-
tor/tracker can be rectified by one or more trackers
with a true positive base image.
The framework has been designed with growth
in mind: extra trackers may need to be added to in-
crease the accuracy of the system as a whole. A
fourth tracker has been developed to illustrate the ease
of adding extra components to the framework. The
fourth tracker simply searches for the lowest aver-
age intensity over a m×n neighborhood of pixels in a
given region of interest; this operation, given a region
close to the eyes, translates to finding the darkestareas
in that region. Hence, the tracker now acts as a naive
Pupil Finder (PPL). A possible problem could occur
when the PPL tracker targets the eyebrows rather than
the pupil when considering the darkest regions; both
the pupils and the brows display comparable neigh-
borhood intensities and can be mistaken for one an-
other by the naive tracker. However, given that there
are other correcting trackers employed by the frame-
work, such problems can be easily and automatically
rectified by the other trackers. It is important to note
that the PPL method is less vulnerable to the off-target
tracking problem discussed previously mainly due to
the fact that it does not use a base image to perform
the search. Thus, an off-target PPL can be set on-
target by any given detector through a single true pos-
itive detection.
3.2 Confidence Parameter
Trackers process each eye separately. Once a tracker
processes a given frame within the input sequence, a
displacement vector
−→
v is produced, which tells the
distance from the previous position of the eye to its
new position at the most recent frame, and the de-
tection window is placed accordingly. Since the ac-
curacy of each tracker differs, a confidence parame-
ter ω is introduced to restrict weak trackers from in-
correctly displacing the detection window. The SIFT
tracker, for example, is more reliable than the NCC
tracker and, as a result, should be given a higher con-
fidence value than that of NCC.
Given the trackers used by our framework, three
displacement vectors are produced: The ROD tracker
vector
−→
v
R
, the SIFT tracker vector
−→
v
S
, the NCC tracker
vector
−→
v
N
, and the PPL tracker vector
−→
v
P
. Addition-
ally, three associated confidence parameters are set
for each of the trackers: ω
R
, ω
S
, ω
N
, and ω
P
. Ap-
plying a separate confidence parameter to each of the
vectors produced by the trackers minimizes the er-
rors produced by incorrect matches and allows track-
ers with a higher confidence value to correct the per-
ceived position of the eye through the displacement of
the detection window. The displacement of the detec-
tion window is then computed as follows:
−→
V
t
=
∑
n
i=0
ω
i
−→
v
i
∑
n
i=0
ω
i
(1)
A CORRECTIVE FRAMEWORK FOR FACIAL FEATURE DETECTION AND TRACKING
133
where n is the total number of trackers employed, ω
i
and
−→
v
i
are the associated confidence parameter and
displacement vector, respectively, for tracker i, and
−→
V
t
is the final displacement vector produced after pro-
cessing frame t. (1) assumes that each tracker i pro-
duces a displacement vector
−→
v
i
based on the process-
ing of the same exact region R(x, y) of the eyes at
each frame. The computational cost of running all the
trackers at each frame is great; Section 3.3 illustrates
how (1) can be simplified to increase the performance
of the framework.
3.3 Interval Parameter
Running all trackers in our framework at every frame
is computationally expensive. A more efficient solu-
tion is to only employ a single tracker at any given
frame, as it helps increase the frame rate and pro-
duce smoother movement of the detection window.
An interval parameter κ is given to each tracker.
The NCC tracker can be run at more frequent inter-
vals in the framework than SIFT and, as a result, can
be given a smaller interval parameter. In addition to
the confidence parameter, the definition of long-term,
short-term, and real-time corrective tracking are ex-
tended to include the interval parameter.
Given the three trackers used by our framework,
three interval parameters are assigned: κ
R
, κ
S
, κ
N
,
and κ
P
. Since some of the components of our frame-
work, namely the SIFT and NCC trackers, need to
register a base image to employ their matching algo-
rithms on their assigned frames, two additional inter-
val parameters are set : κ
S
base
and κ
N
base
. The overall
timeline is reflected in Figure 5.
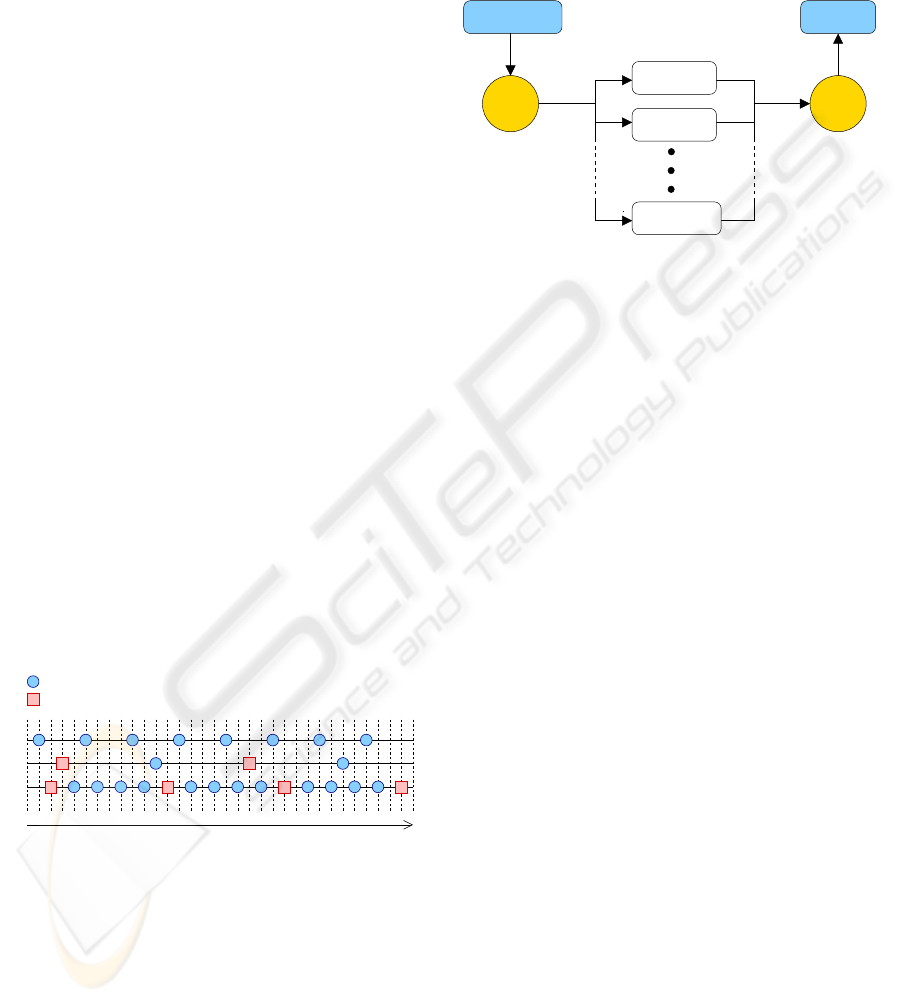
ROD
Register base image
Process
SIFT
NCC
Timeline
Figure 5: An example of a processed timeline according to
the assigned interval parameters for each of the three track-
ing component in our framework.
Since each frame in the sequence is only pro-
cessed by one component in our framework, dictated
by the interval parameters given to each tracker, (1) is
simplified as follows:
−→
V
t
= ω
i
−→
v
i
(2)
Addition of the vectors is eliminated from the
computation of (1) since each frame t is only pro-
cessed by a single tracker i.
3.4 Integration Algorithm
Run tracker
Tracker 1
Tracker 2
Tracker N
Update
κ ω
Figure 6: An overview of the tracker selection process em-
ployed by our framework.
The following describes, in detail, the algorithm em-
ployed by our framework:
1. Acquire new frame: Given the selected view
thought to contain a face, a new frame is acquired.
2. Build Gaussian pyramid: Once a new frame is
acquired, a Gaussian pyramid is built according to
Section 3.
3. Detect a face: The face detector is applied to the
entire scene, in search of a profile face.
4. Track the eyes: If the eyes have not been detected
by the system yet, the eyedetector is run on the re-
gions of interest. In the case where the eyes have
already been registered by the trackers, the sys-
tem employs the appropriate tracker on the ROI,
according to the associated interval κ.
5. Update detection windows: The detection win-
dow for the left and right eyes are updated ac-
cording to the displacement vector produced by
the tracker employed, and adjusted using the con-
fidence parameter ω associated with the tracker.
Figure 6 illustrates the tracker selection process.
6. View switching assessment: Once the frame has
been fully processed, results from the detectors
and some of the trackers are used to assess the
current, primary view, according to the thresholds
set in Section 3. A view switch is performed if
necessary.
4 RESULTS
To accurately determine the true positive and false
positive rates, our framework needs to compute the
VISAPP 2008 - International Conference on Computer Vision Theory and Applications
134
number of true and false positives as well as the num-
ber of true and false negatives; this is shown in Fig-
ure 7. The computation of true (or false) positives (or
negatives) is performed at a fine pixel level to achieve
accuracy. The number of true positives, for example,
is calculated as the area where the detected and ac-
tual (ground truth) regions intersect, outlined in green
on Figure 7. The true positive rate (or sensitivity) is
computed as:
α
T
=
TP
TP+ FN
(3)
where TP and FN are the total number of true posi-
tives and false negatives found, respectively, and α
T
is the true positive rate in the range [0. . . 1]. The false
positive rate (or 1 - specificity) is computed as:
α
F
=
FP
FP+ TN
(4)
where FP and TN are the total number of false posi-
tives and true negatives found, respectively, and α
F
is
the false positive rate in the range [0. . . 1].
eye
not eye
eye
not eye
Region
Actual
Detected
Region
Image
TNFN
FPTP
Figure 7: An illustration determining true positives (TP),
false positives (FP), true negatives (TN), and false negatives
(FN). In the image representation on the right of this figure,
the solid-line box shows the true position of a given eye
(ground truth), whereas the dashed-line box shows the de-
tected region of the eye.
Computing the true positive and false positive
rates at such a fine level provides an accurate rep-
resentation to be used in plotting the Receiver Op-
erating Characteristic (ROC) curves for our method.
However, an actual classification does not need to be
described at such a fine pixel level for a true outcome
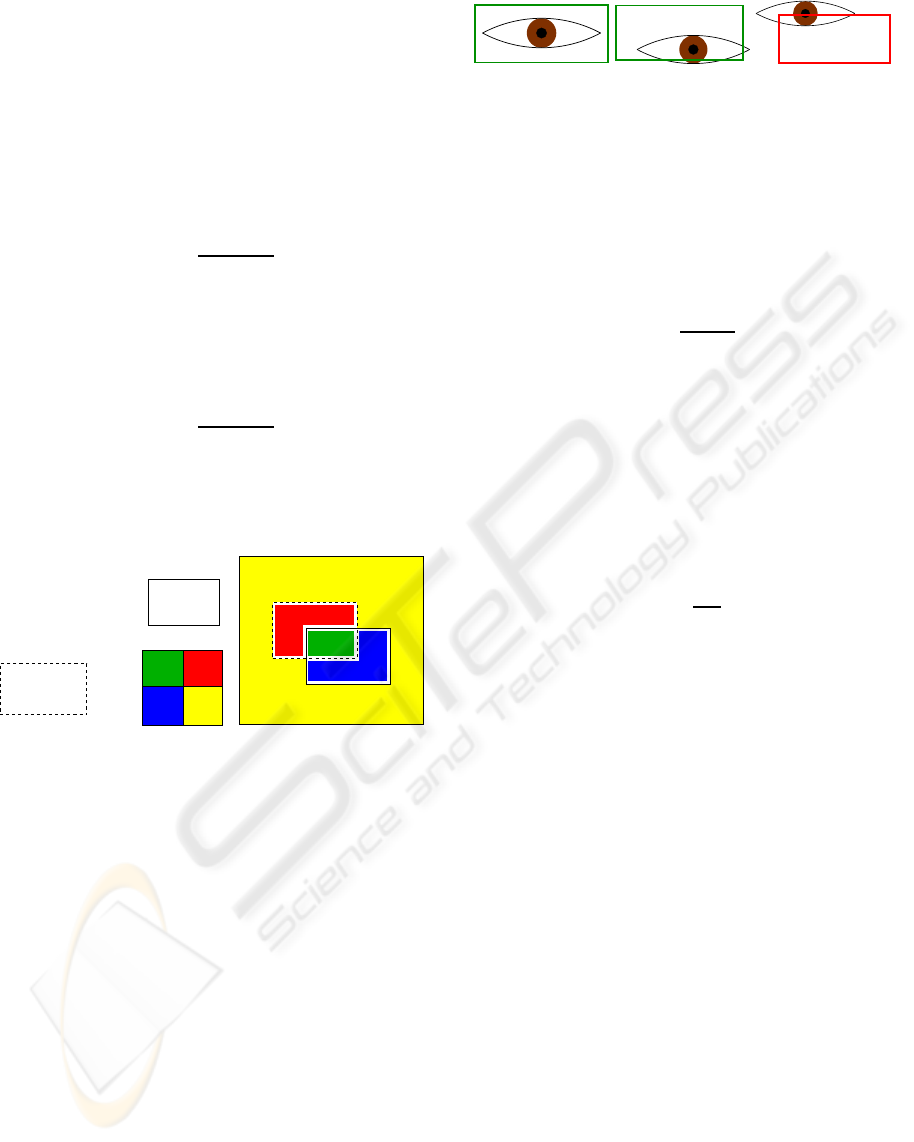
to occur. Figure 8 shows three detection windows. In
Figure 8a, the detection window encapsulates the en-
tire region of the eye, and is hence considered to be a
hit. Figure 8c is classified as a miss since the detection
window deviates almost completely from the eye re-
gion, covering only a small fraction of true positives.
Figure 8b, however,does cover the majority of the eye
region, and therefore can be considered as a hit since
it correctly classifies the region as containing an eye.
(a) Perfect hit (b) Acceptable hit (c) Miss
Figure 8: An illustration showing two hits (a) and (b), and
one miss (c), in determining whether or not the detection
window covers an eye.
As a result, we follow to describe a coarser
method for quantifying a hit rate based on whether
or not the detection window contains an eye:
α
H
=
H
H + M
(5)
where H and M are the total number of hits and
misses, respectively, and α
H
is the hit rate in the range
[0. . . 1]. The coverage of the number of true positives
as a fraction of the actual (ground truth) region of the
eye from Figure 7 can be modeled as per (3). To en-
sure that we also model false positives into our hit-
miss classification scheme, the number of true posi-
tives as a fraction of the number of false positives is
accounted for as follows:
α
D
=
TP
FP
(6)
where TP and FP are the number of true positives
and false positives, respectively. The number of hits
H and misses M can then be computed as follows:
S
t
=
1 (α
T
t
≥ ρ
T
) ∧ (α
D
t
≥ ρ
D
)
0 otherwise
(7)
where α
T
and α
D
are the true positive fractions dis-
cussed previously, at frame t, and ρ
T
and ρ
D
are
thresholds by which leniency can be given to how a
hit is counted. A hit occurs when S is 1; otherwise, a
miss is counted.
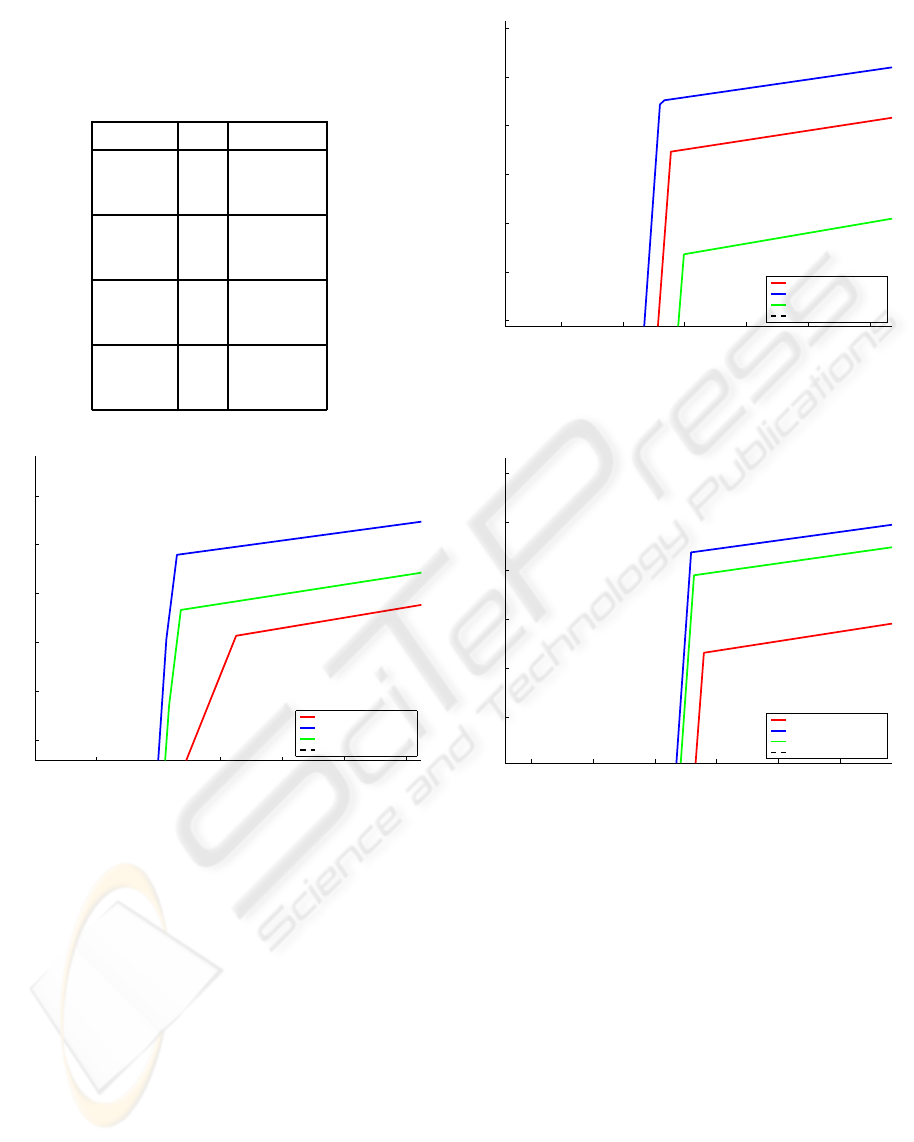
4.1 Confidence Parameter ω
The following experiments were performed to test
the performance of the separate methods when using
varying values for ω; the values of ω were sampled at:
0.1, 0.3, 0.5, 0.7, 0.9, and 1.0. The NCC, SIFT, and
PPL methods also employ the ROD method at a less
frequent interval to lessen the vulnerability to the off-
target tracking problem. The values showing the best,
worst, and average levels of performance are shown
on Figures 9 to 12. The area under the ROC curve
(AUC) was also computed for each curve to outline
the accuracy of the methods with respect to the as-
signed confidence parameters. The AUC values for
A CORRECTIVE FRAMEWORK FOR FACIAL FEATURE DETECTION AND TRACKING
135
the curves in Figures 9 to 12 are summarized in Table
1.
Table 1: The AUC for curves produced when the confidence
parameter is varied.
Method ω AUC
0.1 0.878150
ROD 0.7 0.895555
1.0 0.883620
0.1 0.883433
NCC 0.3 0.889503
1.0 0.871861
0.1 0.882617
SIFT 0.9 0.882617
1.0 0.891356
0.1 0.891356
PPL 0.5 0.919164
1.0 0.930864
0 0.02 0.04 0.06 0.08 0.1 0.12
0.76
0.78
0.8
0.82
0.84
0.86
false positive rate
true positive rate
Rapid Object Detector (ω)
ω = 0.1
ω = 0.7
ω = 1.0
Line of no discrimination
Figure 9: ROC curves for the ROD method showing the
three, most descriptive curves.
4.2 Framework Integration
The following experiments were done to test the per-
formance of the methods when they are integrated to-
gether into a single, correctiveframework. The values
showing the best, worst, and average levels of perfor-
mance are shownon Figures 13 and 14. The AUC was
also computed for each curve to outline the accuracy
of the methods after integration. The AUC values for
the curves in Figures 13 and 14 are summarized in
Table 2.
5 CONCLUSIONS
The ROD is run more frequently when it is employed
on its own. The NCC, SIFT, and PPL methods em-
0.03 0.04 0.05 0.06 0.07 0.08
0.78
0.79
0.8
0.81
0.82
0.83
0.84
false positive rate
true positive rate
Normalized Correlation Coefficient (ω)
ω = 0.1
ω = 0.3
ω = 1.0
Line of no discrimination
Figure 10: ROC curves for the NCC method showing the
three, most descriptive curves.
0.02 0.03 0.04 0.05 0.06 0.07
0.8
0.81
0.82
0.83
0.84
0.85
false positive rate
true positive rate
Scale−Invariant Feature Transform (ω)
ω = 0.1
ω = 0.9
ω = 1.0
Line of no discrimination
Figure 11: ROC curves for the SIFT method showing the
three, most descriptive curves.
ploy the ROD method less frequently. As a result,
the ROD is meant to produce slightly better results
than any of the other methods due to the fact that
the detector is run more frequently. Off-target track-
ing problems help lower the performance of the NCC
and SIFT methods, given that the detector is not al-
lowed to run as often as when it is employed on its
own (ROD method). The PPL method gives the best
results with a 3.5% performance increase over the
ROD method. As explained in Section 3.1, the PPL
method is less vulnerable to off-target tracking prob-
lems, and, as a result, is shown to produce excellent
results over the other methods. The SIFT method
employs computationally expensive algorithms that
lower the frame rate of the system. As a result, SIFT
processes frames at the lowest level of the Gaussian
VISAPP 2008 - International Conference on Computer Vision Theory and Applications
136
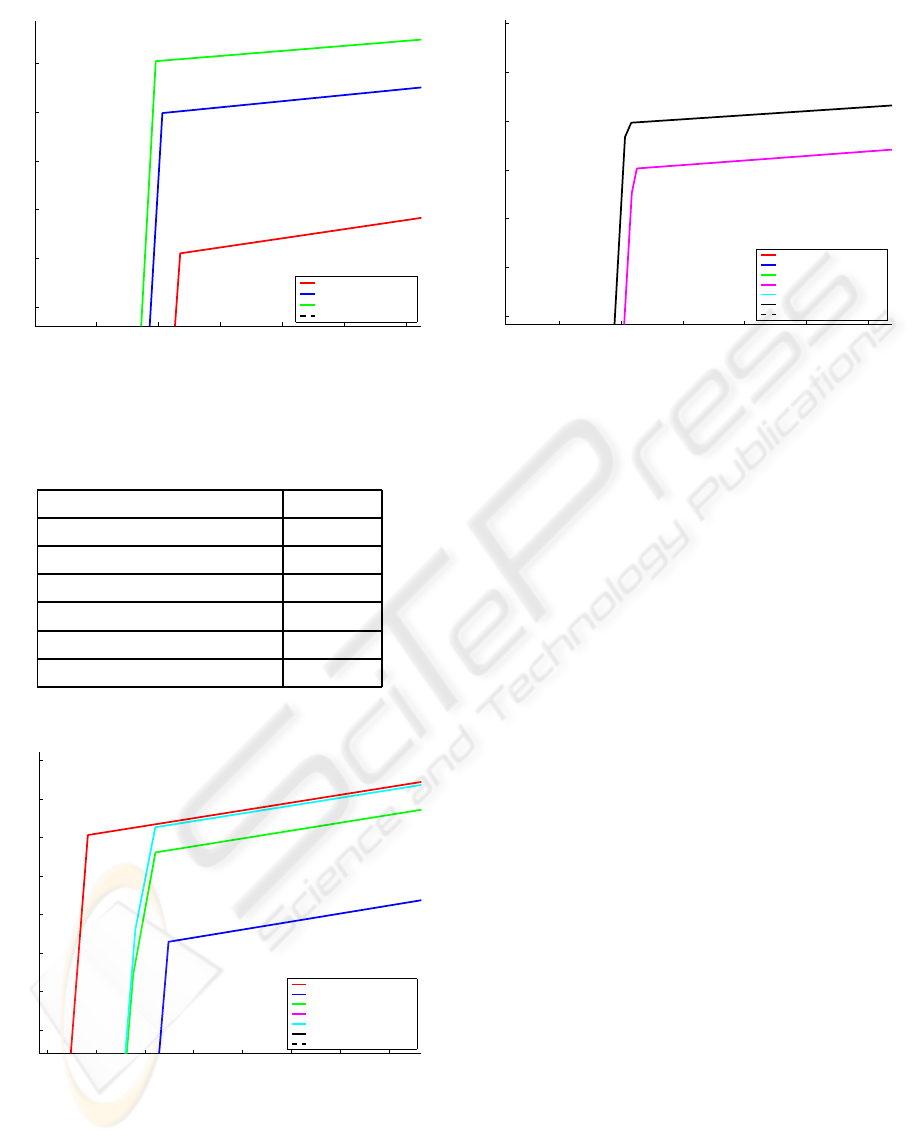
0 0.02 0.04 0.06 0.08 0.1 0.12
0.8
0.82
0.84
0.86
0.88
0.9
false positive rate
true positive rate
Pupil Finder (ω)
ω = 0.1
ω = 0.5
ω = 1.0
Line of no discrimination
Figure 12: ROC curves for the PPL method showing the
three, most descriptive curves.
Table 2: The AUC for curves produced through integration
of the various methods.
Method AUC
ROD 0.879225
ROD + NCC 0.874807
ROD + SIFT 0.877594
ROD + PPL 0.934116
ROD + NCC + SIFT 0.878237
ROD + NCC + SIFT + PPL 0.939404
0.048 0.05 0.052 0.054 0.056 0.058 0.06 0.062
0.798
0.8
0.802
0.804
0.806
0.808
0.81
0.812
false positive rate
true positive rate
Framework Integration
ROD
ROD + NCC
ROD + SIFT
ROD + PPL
ROD + NCC + SIFT
ROD + NCC + SIFT + PPL
Line of no discrimination
Figure 13: ROC curves showing the performance of the
methods employed by the framework, and the integration
of those methods into a single, corrective framework. Only
ROD, NCC, SIFT, and ROD + NCC + SIFT methods are
shown on this graph.
0.03 0.04 0.05 0.06 0.07 0.08
0.88
0.89
0.9
0.91
0.92
0.93
0.94
false positive rate
true positive rate
Framework Integration
ROD
ROD + NCC
ROD + SIFT
ROD + PPL
ROD + NCC + SIFT
ROD + NCC + SIFT + PPL
Line of no discrimination
Figure 14: ROC curves showing the performance of the
methods employed by the framework, and the integration
of those methods into a single, corrective framework. Only
PPL and ROD + NCC + SIFT + PPL methods are shown on
this graph.
pyramid that is employed in our framework. How-
ever, and as can be seen in our results, the perfor-
mance of the SIFT tracker is also lowered, to maintain
an acceptable frame rate.
The confidence parameters were chosen according
to the results presented in Section 4.1. The optimal
curve with the best AUC value was chosen and the ex-
periments were conducted accordingly. As mentioned
previously in this section, the NCC and SIFT methods
produced lower results than the ROD method due to
the fact that ROD was run more frequently when em-
ployed on its own. However, the integration of ROD,
NCC and SIFT is shown to produce results close to
that of the ROD method alone, as can be seen in Fig-
ure 13. The PPL method produced the best results
when compared to the ROD, NCC, and SIFT meth-
ods (all employed individually on top of the ROD
method). However, the integration of ROD, NCC,
SIFT, and PPL method further increases the perfor-
mance of the system by 0.5% over the PPL method.
The full integration of the methods into a single, cor-
rective framework then shows a performance boost of
6%. In terms of hit rate, which is a measure slightly
coarser than the true positiverate (as explained in Sec-
tion 4), the ROD method, when used alone, produces
a hit rate of 92.6285%. However, when integrating
the entire set of methods into the framework to work
together, the hit rate is increased to 99.4499%.
With a high level of accuracy comes a high level
of cost. All the experiments were performed on a lap-
top running a Intel
R
Pentium
R
M processor at 2.00
GHz. The mean frame rate when employing the ROD
method alone is found to be 16.8835 frames per sec-
A CORRECTIVE FRAMEWORK FOR FACIAL FEATURE DETECTION AND TRACKING
137

ond. The integration of the methods lowers the frame
rate to 12.3193 frames per second. The reason for
the low frame rate through integration comes back to
the implementation of SIFT, as it is computationally
costly. A slight change in configuration of the param-
eters for the framework could, potentially, produce
higher frame rates at excellent performance levels.
This research is based on the hypothesis that vi-
sual search patterns of at-risk drivers provide vital in-
formation required for assessing driving abilities and
improving the skills of such drivers under varying
conditions. Combined with the signals measured on
the driver’s body and on the driving signals of a car
simulator, the visual information allows a complete
description and study of visual search pattern behav-
ior of drivers.
REFERENCES
Burt, P. and Adelson, E. (1983). The laplacian pyramid
as a compact image code. In IEEE Transactions on
Communications, volume 4, pages 532–540.
Cootes, T. (2007). Images with annotations of a talking
face. Available at:
http://www.isbe.man.ac.uk/
˜
bim/data/talking_face/talking_face.html
.
November 4th, 2007.
Cootes, T., Cooper, D., Taylor, C., and Graham, J. (1995).
Active shape models - their training and application.
Computer Vision and Image Understanding, 61:38–
59.
Cootes, T., Edwards, G., and Taylor, C. (1998). Active
appearance models. In Conf. Computer Vision, vol-
ume 2, pages 484–498.
Cristinacce, D. and Cootes, T. (2003). Facial feature detec-
tion using adaboost with shape constraints. In Proc.
British Machine Vision Conference, pages 231–240.
Cristinacce, D. and Cootes, T. (2004). A comparison of
shape constrained facial feature detectors. In Proc.
Int. Conf. Automatic Face and Gesture Recognition,
pages 375–380.
Cristinacce, D. and Cootes, T. (2006). Feature detection
and tracking with constrained local models. In Proc.
British Machine Vision Conference, pages 929–938.
Freund, Y. and Schapire, R. (1995). A decision-theoretic
generalization of on-line learning and an application
to boosting. In European Conference on Computa-
tional Learning Theory, pages 23–37.
Ghrabieh, R. A., Hamarneh, G., and Gustavsson, T. (1998).
Review - active shape models - part ii: Image search
and classification. In Proc. Swedish Symposium on
Image Analysis, pages 129–132.
Kanaujia, A., Huang, Y., and Metaxas, D. (2006). Emblem
detections by tracking facial features. In Proc. IEEE
Computer Vision and Pattern Recognition, pages 108–
108.
Leinhart, R. and Maydt, J. (2002). An extended set of haar-
like features for rapid object detection. In Proc. Int.
Conf. Image Processing, volume 1, pages 900–903.
Lowe, D. (1999). Object recognition from local scale-
invariant features. In Proc. Int. Conf. Computer Vi-
sion, volume 2, page 1150.
Medioni, G. and Kang, S. (2005). Emerging Topics in Com-
puter Vision. Prentice Hall.
Viola, P. and Jones, M. (2001). Rapid object detection using
a boosted cascade of simple features. In Proc. IEEE
Computer Vision and Pattern Recognition, volume 1,
pages 511–518.
Viola, P. and Jones, M. (2004). Robust real-time face detec-
tion. Int. J. Comput. Vision, 57:137–154.
Wang, Y., Liu, Y., Tao, L., and Xu, G. (2006). Real-time
multi-view face detection and pose estimation in video
stream. In Conf. Pattern Recognition, volume 4, pages
354–357.
Zhu, Z. and Ji, Q. (2006). Robust pose invariant facial
feature detection and tracking in real-time. In Proc.
Int. Conf. Pattern Recognition, volume 1, pages 1092–
1095.
VISAPP 2008 - International Conference on Computer Vision Theory and Applications
138
