
4D WARPING FOR ANALYSING MORPHOLOGICAL CHANGES
IN SEED DEVELOPMENT OF BARLEY GRAINS
Rainer Pielot, Udo Seiffert
Leibniz-Institut für Pflanzengenetik und Kulturpflanzenforschung (IPK)
Corrensstraße 3, D-06466 Gatersleben, Germany
Bertram Manz
2
, Diana Weier
1
, Frank Volke
2
and Winfriede Weschke
1
1
Leibniz-Institut für Pflanzengenetik und Kulturpflanzenforschung (IPK)
Corrensstraße 3, D-06466 Gatersleben, Germany
2
Fraunhofer Institut für Biomedizinische Technik (IBMT)
Ensheimer Str. 48, D-66386 St. Ingbert/Saar, Germany
Keywords: Warping, NMR, registration.
Abstract: NMR imaging allows to obtain 3D-images by non-invasive treatment of biological structures. In this study
intensity-based warping is evaluated by comparing it to landmark-based warping for a four-dimensional
analysis of morphological changes in seed development of barley. The datasets of barley grains are obtained
at certain development stages by NMR. Warping algorithms reconstruct intermediate physically non-
measured stages. The landmark-based procedure consists of automatic definition of landmarks and
subsequent distance-weighted warping. The intensity-based approach uses iterative intensity-based warping
for definition of the displacement vector field and distance-weighted volume warping for generation of the
virtual intermediate dataset. The approaches were tested with four datasets of barley at different
development stages. As a result, the intensity-based approach is highly applicable for analysis of
morphological changes in NMR datasets and serves as a tool for an extensive 4D analysis of seed
development in barley grains.
1 INTRODUCTION
The accurate four-dimensional analysis of
developing biological structures requires adequate
techniques. In case of high-resolution NMR scans of
biological structures, 4D warping can serve as a tool
for visualization of morphological changes
(Thompson and Toga, 1998; Shen and Davatzikos,
2003; Toga and Thompson, 2003; Shen, 2004).
Analysis of seed development of barley encloses the
detection of complex morphological change
patterns. Therefore we investigate fast and robust
warping strategies for applicability in biological
image processing. Warping is a class of image
processing techniques, which deals with nonlinear
geometric transformations. According to the
determination of the spatial correspondence between
a source and a target image, warping algorithms can
be divided into two classes (Toga, 1998, Maintz and
Viergever, 1998): Model-based approaches use
high-level information, such as point landmarks
(Bookstein, 1989; Franz et al., 1999; Whitbeck and
Guo, 2006), contours (Subsol, 1998; Wang et al.,
2004) and surfaces of anatomical structures
(Davatzikos, 1996; Thompson and Toga, 1996,
2002). In contrast, intensity-based warping methods
maximize local gray value correlation to match the
source to the target image (Bajcsy and Kovacic,
1989; Ashburner et al, 1999). Hybrid approaches try
to combine model-based and intensity-based
techniques (Johnson and Christensen, 2002). The
major drawback of pure intensity based methods is
the incapacity to handle large deformations. To
overcome these limitations, Christensen et al. have
published (in 1996) a viscous fluid based warping
procedure, which allows highly nonlinear, but
335
Pielot R., Seiffert U., Manz B., Weier D., Volke F. and Weschke W. (2008).
4D WARPING FOR ANALYSING MORPHOLOGICAL CHANGES IN SEED DEVELOPMENT OF BARLEY GRAINS.
In Proceedings of the Third International Conference on Computer Vision Theory and Applications, pages 335-340
DOI: 10.5220/0001073803350340
Copyright
c
SciTePress
smooth and topology preserving, deformations with
a relatively high computational cost. A faster
derivative of the viscous fluid registration was
published by Bro-Nielsen and Gramkow in 1996
using a convolution filter in a scale-space framework
(Bro-Nielsen and Gramkow, 1996). Another well-
known approach of iteratively registering an image
is the “Demon's Algorithm” (Thirion, 1996, 1998),
which can be considered as an approximation of the
viscous fluid registration (Bro-Nielsen and
Gramkow, 1996).
The time- and memory consuming step of fluid
registration procedures is solving the linear PDE. In
this study we present new iterative approach that
performs the calculation of the displacement vector
field (DVF) by bloc-matching and by minimizing a
threshold function to get fast computation and few
memory consumption. Distance-weighted warping
performs the subsequent volume transformation of
all voxels of the source image to the target image
using the DVF as geometric information. The
method was applied to gradient images, which are
obtained from the gray value datasets (see Material
& Methods).
This approach was compared to a fast and robust
landmark-based approach with an iterative intensity-
based approach. The manual definition of a
sufficient amount of landmarks is subjective and
time-consuming, therefore the 3D landmarks were
automatically generated. The automatic definition of
an adjustable number of landmarks is based on 3D
differential operators (Rohr, 1997).
NMR-imaging allows to obtain 3D-images by
non-invasive treatment of the biological material,
and was successfully applied to barley grains
(Glidewell, 2006). The aim of the presented study is
the evaluation of two different warping strategies for
transformation of interindividual NMR datasets of
barley grains at different development stages. The
transformation helps to analyze morphological
changes during seed development by reconstructing
a complete time series of NMR datasets. The
measured NMR datasets at distinct time points are
serving as reference for the iterative warping
procedure. The approaches were evaluated by
calculation of global cross correlation and volume
overlap index between the warped and the target
dataset over time.
2 MATERIAL & METHODS
In this study 4 NMR datasets at different
development stages are used (3 Days After
Flowering (DAF), 3.5, 9, and 10 DAF). The datasets
are divided into two groups to examine seed
development at an early stage (3 DAF + 3.5 DAF)
and at a relatively late stage (9 DAF + 10 DAF).
Each group is processed separately and inde-
pendently, i.e. 3 DAF is transformed to 3.5 DAF and
9 DAF is warped to 10 DAF.
Both pairs of datasets are differing in size and
represent different growth patterns, so that they were
chosen out of 16 measured datasets as examples to
demonstrate the method under dissimilar conditions.
The reconstruction of seed development between 3
DAF and 3,5 DAF was chosen due to enormous
morphological changes between these time points.
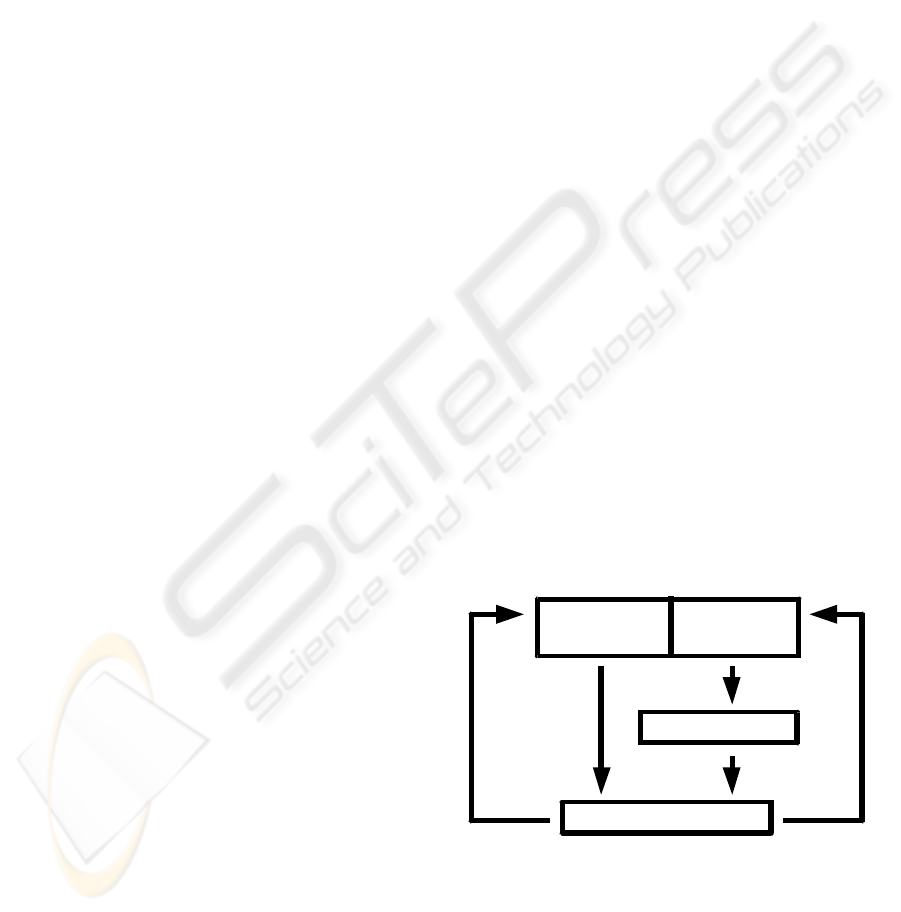
The general work flow is as follows: After
obtaining the datasets, a manual rigid alignment of
the 3D images to each other ensures best starting
conditions. Then, as the first step in an iterative
process, the gray value datasets were duplicated and
the copies were converted to a gradient dataset.
Subsequently the registration process generates the
displacement vector field (DVF) to determine the
spatial correspondence between the source and the
target image. The last step is the volume warping of
the non-converted source gray value dataset. The
iteration cycle starts again with the gradient
calculation of a copy of the warped dataset. After a
predefined number of iterations the whole process
stops. Fig. 1 shows the general scheme.
Figure 1: Diagram of general work flow.
2.1 NMR-Imaging and Image
Preprocessing
A Bruker DMX 400 NMR spectrometer (Bruker,
Rheinstetten, Germany) with a Micro2.5 imaging
Grayvalue Gradient
Image Image
Definition of DVF
Volumewarping
VISAPP 2008 - International Conference on Computer Vision Theory and Applications
336

probe was used for the MRI (Magnetic Resonance
Imaging) experiments. All three-dimensional images
were recorded using a standard T1-weighted 3D
spin-echo pulse sequence with a repetition time T
r
of
300 ms and an echo time T
e
of 4.4 ms. The image
resolution was 31 µm along the axial and 16 µm
along the transverse directions and dimensions of the
datasets are 512x175x256 voxels (9 DAF, 10 DAF)
and 194x124x256 voxels (3 DAF, 3.5 DAF),
depending on the size of the biological structures.
The datasets were converted to a gray value
resolution of 8 bit, contrast enhanced and manually
put into the same orientation. Afterwards they were
manually aligned to each other, as an important
prerequisite for the registration process.
2.2 Landmark-based Approach
The automatic definition of landmarks is based on
3D operators for the detection of point landmarks in
MR images. The operator consists of first partial
derivatives of the voxels and detects corners and
saddle-points of biological structures. To ensure
correct correspondence of the detected reference
points, a 3D grid is placed on each dataset to define
non-overlapping subvolumes. Only if a corres-
ponding subvolume contains a reference point in
both datasets, these reference points are defined as
landmarks. The spatial difference of a pair of
corresponding landmarks denotes a displacement
vector. For the time-series the length of the
displacement vectors are successively reduced to
realize a reverse „growth“. At each timepoint, a
volume warping is performed.
The displacement vectors describe the DVF,
therefore the same distance-weighted volume
warping method is used as in the intensity-based
approach.
2.3 Iterative Intensity-based Approach
As the first step in an iterative process, the gray
value datasets were duplicated and the copies were
converted to a gradient dataset. Subsequently the
registration process generates the displacement
vector field (DVF) to determine the spatial
correspondence between the source and the target
image. The last step is the volume warping of the
non-converted source gray value dataset. The
iteration cycle starts again with the gradient
calculation of a copy of the warped dataset. After a
predefined number of iterations the whole process
stops.
Pretests without conversion into gradient images
showed poor results probably due to differing
contrast in the NMR datasets.
The first step of the iteration cycle is to calculate
the gradient image of the source and the target
dataset by application of a sobel mask. Therefore the
registration is performed on the gradient dataset and
not on the original gray value datasets. Based on
linear elasticity properties of a deformed body,
which are described by the Navier-Stokes equation,
the gradient of local similarity between the target
and the deformed image represents the body forces.
The strength of deformation is regulated by the
internal forces. To overcome the limitations of only
small deformations, the whole process becomes
iterative by adding time to it.
The presented approach changes this model to a
simpler and faster algorithm by reducing the core
problem of time-consuming solving of PDEs to a
minimization problem. The internal forces are
simplified to a simple threshold function s(u(x,t)):
min)),(()),(( =
+
tts xubxu (1)
The body forces b(u(x,t)) are determined by the
local sum of squared differences of the voxel values
of the source dataset S and the target dataset T:
∑
−+=
2
))()),((()),(( xxuxxub TtSt (2)
and the threshold function is defined as:
⎩
⎨
⎧
<
>
∞
=
∑
∑
ct
ct
ts
|)),(|(
|)),(|(
0
)),((
xu
xu
xu
(3)
where c depicts a predefined threshold value. In this
study the non-critical value of c was set to 5,
therefore the maximal length of a displacement
vector cannot exceed this value. In contrast to
common iterative elastic matching algorithms, the
displacement vectors are only determined for rigid
displacement of local subvolumes of 10 x 10 x 3
voxel. Therefore the calculation of the DVF can be
described as a very fast bloc-matching process.
For each local subvolume the best displacement
is determined by minimizing eq. (1). After the
registration procedure the DVF contains M vectors,
each vector can be taken as the spatial difference
between the points v
i
in the target image and x
i
in the
source image. These points are called registration
points.
4D WARPING FOR ANALYSING MORPHOLOGICAL CHANGES IN SEED DEVELOPMENT OF BARLEY GRAINS
337
The volume warping requires a robust and fast
warping method to handle a large number of
displacement vectors obtained by the registration
step. We chose a distance-weighted warping
algorithm to ensure mathematical robustness even
with a high number of displacement vectors. The
smoothness of the transformation is controlled by a
global parameter.
The transformation function r(x) of the used
warping method calculates the displacement of each
voxel x by the weighted sum of all displacement
vectors:
∑
∑
−
=
−
=
−
+=
1
0
1
0
)(
])[(
)(
M
i
i
M
i
iii
w
w
r
x
xvx
xx
(4)
The weighting function consists of a global
weighting factor β and the Euclidean distance of the
point x to the reference point x
i
:
)])()([(
iii
zzyyxx
i
ew
−−−
=
β
(5)
To decrease computational efforts, only
reference points with a distance value smaller than a
given threshold are used for further calculation. The
global weighting factor β shapes the transformation:
a high value results in local and coarse
transformations whereas a low value yields smooth
displacements. For the intensity-based approach we
set β to 0.02. In case of the landmark-based
approach a value of 0.10 is used.
After generation of the gray value dataset by this
distance-weighted warping algorithm, the warped
dataset is duplicated, then the copy is converted into
a gradient dataset and fed into the next iteration
cycle. Due to the lack of a reliable convergence
criterion, the whole process was stopped after a
predefined number of 30 iteration cycles.
3 RESULTS
All calculations were performed on an SMP Opteron
850 system with Linux 2.6.13. In case of the early
development stage the intensity-based approach uses
17,136 vectors (landmark-based: 1,071 landmarks)
and in case of the late development stage 57,600
vectors (landmark-based: 3,120 landmarks) are used
for the volume warping.
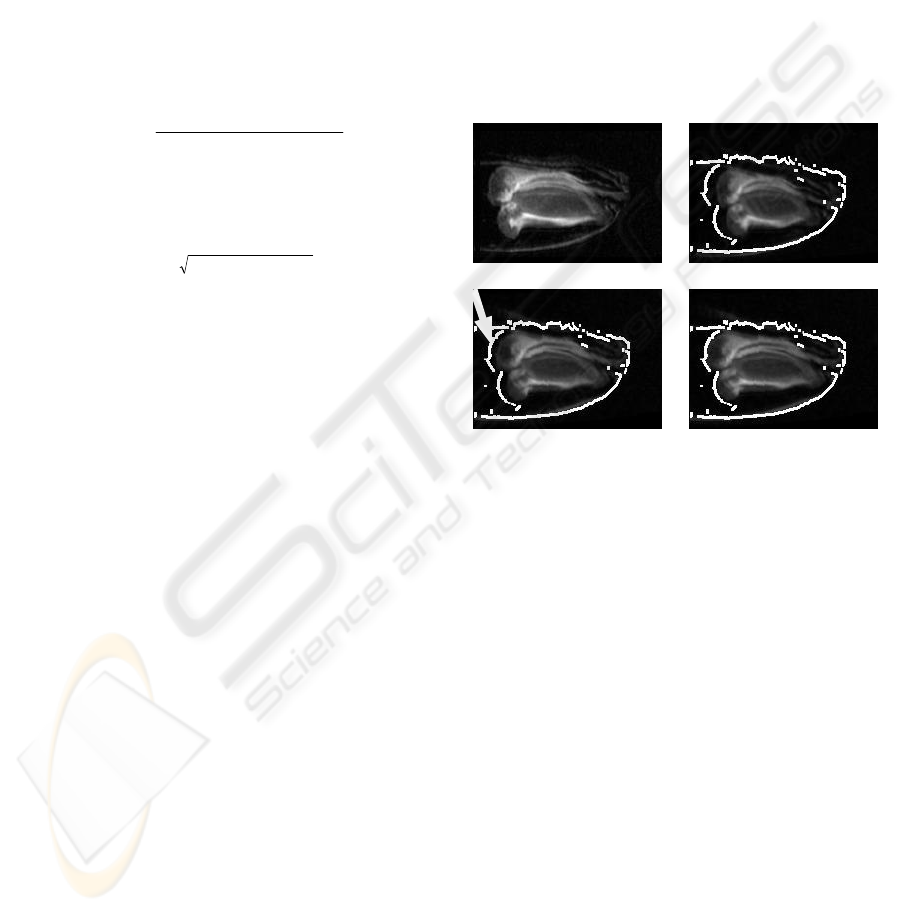
In case of the early development stage fig. 2
shows one single slice (z=126) out of the volumes.
The original NMR datasets were cropped at their left
ends, because the caryopsis does not reach the
glumes completely. The upper row shows on the left
the target and on the right the source dataset with an
automatically generated outer contour of the target.
The lower row shows the warped dataset at the same
z-position after 5 resp. 30 iteration cycles. It can be
seen, that the warping process simulates nonlinear
growth of the caryopse, until the most left part of the
caryopse reaches the position of the same structure
in the target dataset.
Figure 2: Single slice (z=126) from NMR datasets (early
development stage). Upper row: Target dataset and source
dataset with outer contour of target. Lower row: Warped
dataset after 5 and 30 iterations. The arrow depicts the
outer contour of the caryopse to demonstrate the iterative
process of transformation.
Fig. 3 shows for the late development stage the
results of the intensity-based approach one single
slice (z=126) of the target dataset (upper row, left)
and on the right the corresponding slice of the source
dataset together with the outer contour of the target
dataset. In the middle row the warped datasets after
5 and 30 iterations resp. are depicted. For a better
evaluation the lower row shows magnifications. It
can be seen, that the shapes of the biological
structures became more similar to each other.
Target: 3,5 DAF Source: 3 DAF
After 5 iterations After 30 iterations
VISAPP 2008 - International Conference on Computer Vision Theory and Applications
338
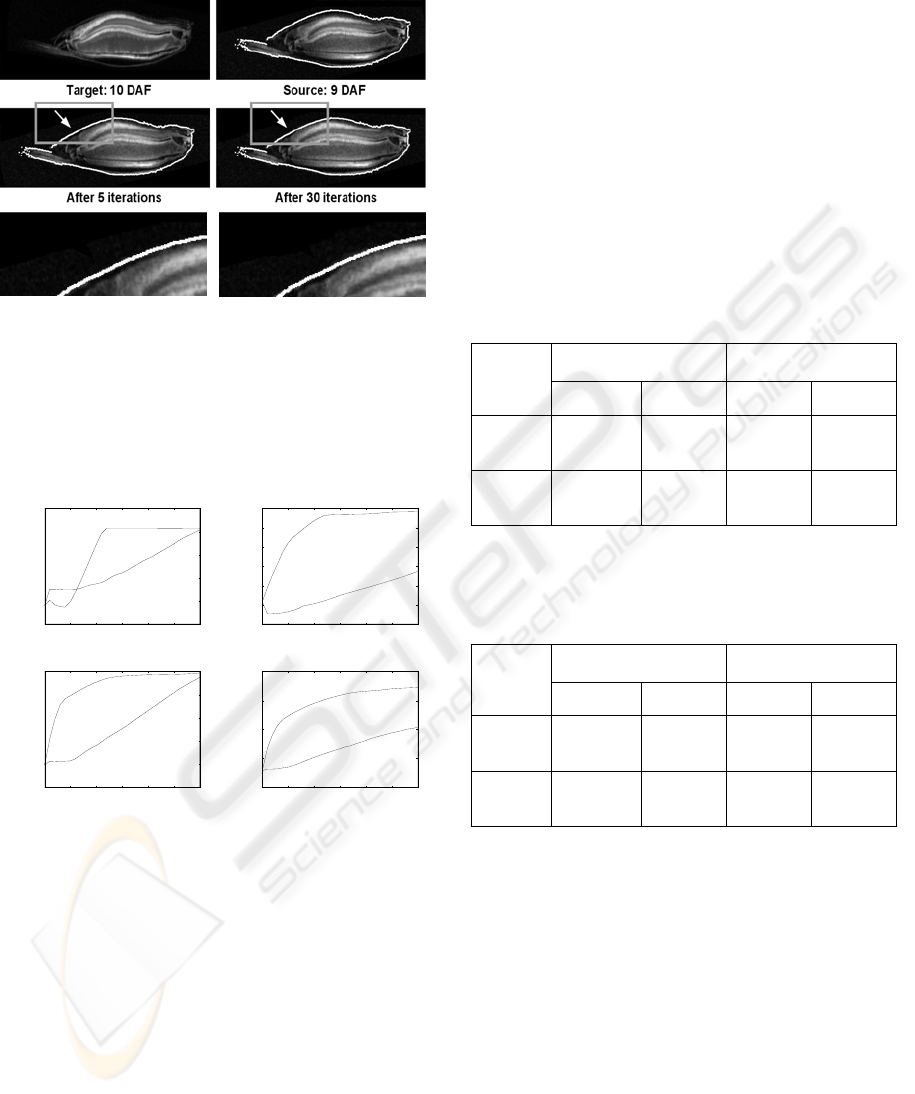
Figure 3: Single slice (z=126) from NMR datasets (late
development stage). Upper row: Target dataset and source
dataset with outer contour of target. Middle row: Warped
dataset after 5 and 30 iterations. The arrows depict a
prominent location to see the iterative process of
transformation. Lower row: Magnifications of the marked
regions.
Figure 4: Increase of the global cross correlation
coefficient and the volume overlap index during the
iterations. The thicker curve depicts the results of the
intensity-based approach and the thinner curve the results
of the landmark-based approach. The iterations were
stopped after 30 cycles. a) and b): early development
stage, c) and d): late development stage.
The increase of the global cross correlation
coefficient (cc) and the volume overlap index (voi)
is shown in Fig. 4. The global cross correlation
measures the similarity of the global gray value
distribution, whereas the volume overlap index
quantifies the 3D geometric correspondence. In case
of the intensity-based approach, a rapid increase of
similarity in terms of the used quality functions
shows a strong transformation at the beginning of
the iterations. After about 15 iterations the similarity
increases only slightly. In case of landmark-based
warping the increase is more or less linear after
about 5 iterations. However, best results after 30
iterations are obtained by the intensity-based
approach.
The increase of similarity in terms of the used
similarity functions is summarized in tab. 1 (early
development stage) and tab. 2 (late development
stage).
Table 1: Increase of similarity (early development stage).
The global cross correlation coefficient before warping
between target and source dataset was 0.7359 and the
volume overlap index was 0.5462.
Intensity-based Landmark-based
cc voi cc voi
After 5
iterations
0.7394
+0.48%
0.6680
+22.30%
0.7495
+1.85%
0.5256
-3.77%
After 30
iterations
0.8025
+9.05%
0.7335
+34,29%
0.8014
+8.90%
0.6091
+11.52%
Table 2: Increase of similarity (late development stage).
The global cross correlation coefficient before warping
between target and source dataset was 0.6790 and the
volume overlap index was 0.7716.
Intensity-based Landmark-based
cc voi cc voi
After 5
iterations
0.7419
+9.26%
0.8115
+5.17%
0.6826
+0.53%
0.7740
+0.31%
After 30
iterations
0.7691
+13.27%
0.8375
+8,54%
0.7551
+11.21%
0.8014
+3.86%
4 CONCLUSIONS
The aim of this study was the investigation of 4D
warping of interindividual NMR datasets of barley
grains at different development stages. The
transformations help to visualize morphological
changes during seed development of barley. We
have developed and evaluated an iterative procedure
to generate virtual datasets using measured NMR
datasets as reference. Similarity measurements by
applying global cross correlation and volume
overlap index as quality functions show an increase
during the iterations. In case of our new method, the
increase of similarity is not linear in terms of the
)
)
0.72
0.74
0.76
0.78
0.80
0.82
0 5 10 15 20 25 30
cross correlation
iteration
0.50
0.54
0.58
0.62
0.66
0.70
0.7
4
0 5 10 15 20 25 30
volume overlap index
iteration
0.66
0.68
0.70
0.72
0.74
0.76
0 5 10 15 20 25 30
cross correlation
iteration
0.76
0.78
0.80
0.82
0.84
0 5 10 15 20 25 30
volume overlap index
iteration
a) b)
c) d)
0.72
0.74
0.76
0.78
0.80
0.82
0 5 10 15 20 25 30
cross correlation
iteration
0.50
0.54
0.58
0.62
0.66
0.70
0.7
4
0 5 10 15 20 25 30
volume overlap index
iteration
0.66
0.68
0.70
0.72
0.74
0.76
0 5 10 15 20 25 30
cross correlation
iteration
0.76
0.78
0.80
0.82
0.84
0 5 10 15 20 25 30
volume overlap index
iteration
a) b)
c) d)
4D WARPING FOR ANALYSING MORPHOLOGICAL CHANGES IN SEED DEVELOPMENT OF BARLEY GRAINS
339

used similarity functions. This is a property of the
used intensity-based warping method. However, up
to now, it is more likely that the growth of the
structures in barley grains between the presented
timepoints is nonlinear. The landmark-based
approach shows a linear increase in terms of the
quality functions, but produces suboptimal results
after a given number of iterations.
The presented algorithm will serve as a tool for
further four-dimensional analysis of seed
development in barley: For further 4D analysis
expression data will be incorporated into the virtual
NMR datasets to visualize time-dependent
localization of e.g. metabolites during development.
For this task the presented iterative procedure
appears to be highly suitable for time-dependent
transformation of one development stage to another
and may prove to be a useful tool to make
morphological changes during seed development
accessible for further analysis.
ACKNOWLEDGEMENTS
This work was supported by a grant of the Deutsche
Forschungsgemeinschaft (DFG) (FKZ WE 1608/2-
1). We would like to thank Dr. Bernd Brückner (IfN
Magdeburg) for help with the calculations.
REFERENCES
Ashburner, J., Andersson, J.L.R., Friston, K.J., 1999.
High-dimensional image registration using symmetric
priors, NeuroImage, 9:619-628
Bajcsy, R., Kovacic, S., 1989. Multiresolution elastic
matching, Computer Vision, Graphics and Image
Processing 46:1-21
Bookstein, F.L., 1989. Principal warps: Thin-plate splines
and the decomposition of deformations, IEEE
Transactions on pattern analysis and machine
intelligence 11:567-585
Bro-Nielsen, M., Gramkow, C., 1996. Fast fluid
registration of medical images, In Visualization in
Biomedical Computing, 1131:267-276
Christensen, G.E., Rabbitt, R.D., Miller, M.I., 1996.
Deformable templates using large deformation
kinematics, IEEE Transactions on Image Processing
5(10):1435-1447
Davatzikos, C., 1996. Spatial normalization of three-
dimensional brain images using deformable images, J.
Comput. Assist. Tomogr., 20(4):656-665
Franz, S., Rohr, K., Stiehl, H.S., Kim, S.-I., Weese, J.,
1999. Validating point-based MR/CT registration
based on semi automatic landmark extraction. In
CARS'99, pp. 233-237
Glidewell, S.M., 2006. NMR imaging of developing
barley grains, Journal of Cereal Science, 43:70-78
Johnson, H.J., Christensen, G.E., 2002. Consistent
landmark and intensity-based image registration, IEEE
Transactions on medical imaging, 21(5):450-461
Maintz, J.B.A, Viergever, M.A., 1998. A Survey of
Medical Image Registration, Med. Image Anal.,
2(1):1-37
Rohr, K., 1997. On 3D differential operators for detecting
point landmarks, Image and Vision Computing, 15(3):
219-233
Shen, D., 2004. 4D Image warping for measurement of
longitudinal brain changes. In Proceedings of the 2004
IEEE International Symposium on Medical Imaging,
pp. 904-907
Shen, D., Davatzikos, C., 2003. Measuring temporal
morphological changes robustly in brain MR images
via 4-dimensional template warping, NeuroImage,
21:1508-1517
Subsol, G., 1998. Crest lines for curve-based warping. In
Brain warping, Academic Press, San Diego
Thirion, J.-P., 1996. Non-rigid matching using demons,
Proc. Int. Conf. Computer Vision and Pattern
Recognition (CVPR'96)
Thirion, J.-P., 1998. Image matching as a diffusion
process: an analogy with maxwell's demons, Medical
Image Analysis, 2:243-260
Thompson, P.M., Toga, A.W., 1996. A surface-based
technique for warping three-dimensional of the brain,
IEEE Transactions on Medical Imaging, 15(4):1-16
Thompson, P.M., Toga, A.W., 1998. Anatomically-driven
strategies for high-dimensional brain image warping
and pathology detection, In Brain Warping (Toga,
A.W, Ed.), pp. 311-336, Academic Press, San Diego
Thompson, P.M., Toga, A.W., 2002. A framework for
computational anatomy, Computing and Visualization
in Science, 5:13-34
Toga, A.W., 1998. Brain warping, Academic Press, San
Diego
Toga, A.W., Thompson, P.M., 2003. Temporal dynamics
of brain anatomy, Annual Review of Biomedical
Engineering, 5, 119-145
Wang, A.Y., Leow, A.D., Protas, H.D., Toga, A.W.,
Thompson,P.M., 2004. Brain warping via landmark
points and curves with a level set representation, In
Proc. Medical Imaging Computing and Computer
Assisted Intervention (MICCAI), 2004
Whitbeck, M., Guo, H., 2006. Multiple landmark warping
using thin-plate splines. In IPCV'06, pp. 256-263
VISAPP 2008 - International Conference on Computer Vision Theory and Applications
340
