
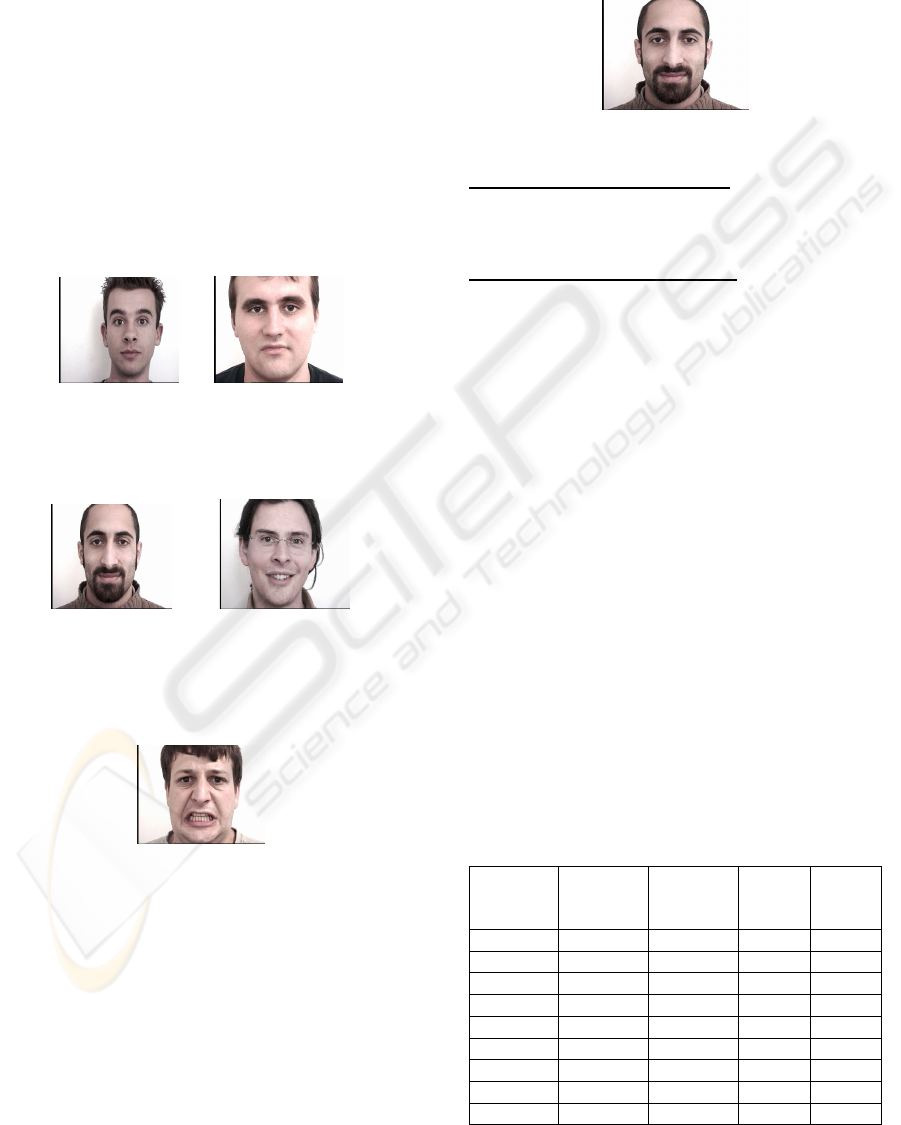
ESTIMATION OF FACIAL EXPRESSION INTENSITY BASED
ON THE BELIEF THEORY
Khadoudja Ghanem
1
, Alice Caplier
2
and Sébastien Stillittano
2
1
Laboratory Lire, Mentouri University , Rue Ain El Bey, Constantine, Algeria
2
GIPSA-lab/DIS 46 avenue Félix Viallet, F-38031 Grenoble, France
Keywords: Facial Expression, intensity estimation, belief theory.
Abstract: This article presents a new method to estimate the intensity of a human facial expression. Supposing an
expression occurring on a face has been recognized among the six universal emotions (joy, disgust, surprise,
sadness, anger, fear), the estimation of the expression’s intensity is based on the determination of the degree
of geometrical deformations of some facial features and on the analysis of several distances computed on
skeletons of expressions. These skeletons are the result of a contour segmentation of facial permanent
features (eyes, brows, mouth). The proposed method uses the belief theory for data fusion. The intensity of
the recognized expression is scored on a three-point ordinal scale: "low intensity", "medium intensity" or "
high intensity". Experiments on a great number of images validate our method and give good estimation
for facial expression intensity. We have implemented and tested the method on the following three
expressions: joy, surprise and disgust.
1 INTRODUCTION
Technology occupies a prominent place in our
society, but the users have not any more time to
adapt themselves to the increasingly complexity of
machines. This is why the machine has to adapt
itself to the user by proposing him/her a convivial
and ergonomic interface.
In order to make the human/computer
communication easier, it is necessary to equip the
machine with an emotional system. According to
(Bui et al., 2002), an emotional system must be
quantitative and able to produce emotions with
various intensities decreasing along the time;
Edwards (Edwards, 1998) stresses the importance of
quantitative models of emotions and is astonished
that few researchers are interested in computation
of emotions intensities. In the scope of an effective
model of the dialogue, it is essential to associate
intensity to the emotion, because it will not influence
the dialogue in the same way according to its degree.
Thus a slightly irritated person will not behave in a
violent way as a furious person against his/her
interlocutor.
Like in psychology, psychoanalysis, biology
(Darwin), philosophy (Descartes), medicine, tele-
formation, the simulation of people in virtual reality,
the control of vigilance for a driver, the interactive
plays or in videoconferences, the recognition of
facial expressions with their intensities is involved
in the making decision process of the behavior of
the interlocutor, that it is a machine or a human
being.
It will be a great challenge and be of practical
significance to estimate expression intensities.
Researchers in facial expressions field are
influenced by Ekman, Friesen and Izard so that
they work generally on the six universal
expressions (joy, disgust, surprise, sadness, anger,
fear). But with the study of the intensity of each
expression, we can make leave sub expressions
classes. For example, for anger we can deduct:
rage, anger or boredom and for fear: anxiety, fear
or terror.
Several computer vision researchers proposed
methods to represent intensity variations (I. Essa
and A. Pentland, 1997) represented intensity
variation in joy using optical flow. (Kimura and
Yachida, 1997) and (Lien. et al., 1998) quantified
intensity variation in emotion-specified expression
and in action units, respectively. These authors did
not, however, attempt the more challenging step of
discriminating intensity variation within types of
facial actions. Instead, they used intensity
measures for the limited purpose of discriminating
between different types of facial actions. (Bartlett,
452
Ghanem K., Caplier A. and Stillittano S. (2008).
ESTIMATION OF FACIAL EXPRESSION INTENSITY BASED ON THE BELIEF THEORY.
In Proceedings of the Third International Conference on Computer Vision Theory and Applications, pages 452-460
DOI: 10.5220/0001076204520460
Copyright
c
SciTePress
1999) tested their algorithms on facial expressions
that systematically vary in intensity as measured by
manual FACS coding. Although they failed to report
results separately for each level of intensity
variation, their overall findings suggest some
success. (Tian et al., 2000) may be the only group to
compare manual and automatic coding of intensity
variations. Using Gabor features and an artificial
neural network, they discriminate intensity variation
in eye closure as reliably as human coders do.
In this article we present a new method to estimate,
from still images, the intensity of a human facial
expression recognized among the six universal
emotions (smile, disgust, surprise, sadness, anger and
fear).
This method is mainly based on the determination of
the degree of geometrical deformations of some
facial features and on the analysis of certain
distances computed on skeletons of expressions. A
skeleton is the result of a contour segmentation of
face permanent features such as eyes, brows and
mouth (See Fig. 1). We compute distances which are
showed on Fig 1, then we define a model for each
considered distance with three score levels of
intensity « Low, Medium and High ». Each distance
relevant to each expression is classified into one of
the three levels or between two levels, with a piece
of evidence associated to each level. While all the
distances are treated, a process of data fusion is
carried out to give a final intensity classification and
consequently deduce new sub expressions.
2 RELATED WORK
Our method is applied to still images on which the
facial expression is supposed to be known. We
compute distances which are showed on Fig 1 and
Fig.2 to estimate expression intensity.
These distances are normalized with respect to the
distance between the centers of both irises. This
makes the analysis independent on the variability of
face dimensions and on the position of the face with
respect to the camera.
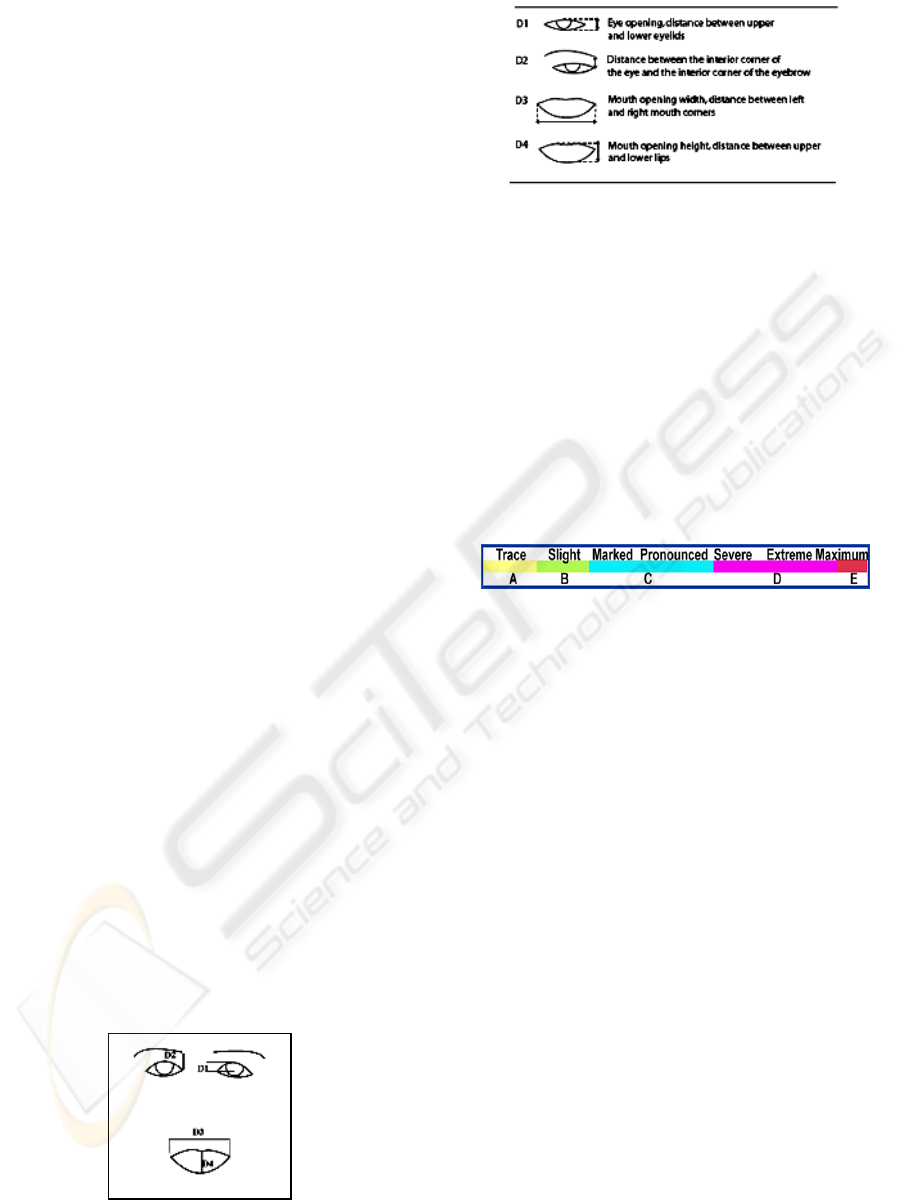
Figure 1: Facial skeleton and characteristic distances.
Figure 2: Characteristic distances computed on facial
skeleton images.
2.1 Relevant Distances for the
Estimation of the Intensity of an
Expression
Ekman proposed a Facial Action Coding System;
his system contains 44 Action Units (AUs) (P.
Ekman, 2002). The intensity of an AU can be
scored on a five-point ordinal scale (A, B, C, D, E)
as shown on Fig. 3. FACS uses conventions or
rules to set thresholds for scoring the intensities of
an AU.
Figure 3: The different levels in scoring intensities of an
action unit (P.Ekman, 2002).
The A-B-C-D-E scoring scale is not an equal
interval scale; the C and D levels cover a larger
range of appearance changes than the other levels,
and most of the AU variations fall in these levels.
The A, B, and E levels are defined as very narrow
ranges. The A and B levels are often confused, the
separation between D and E is difficult to
determine and even the trace of A and the
maximum of E refer to a limited range of
appearance changes.
Combination of two or more AUs changes the AU
intensity. For all these reasons, we have reduced
the number of levels to three: “Low level” replaces
A and B; « Medium level » replaces C and « high
level » replaces D and E. And we suppose that the
three levels are equal.
Whether we score the intensity or not, and which
AUs intensity is scored, will depend on the
purposes of the investigation. In our case we need
to study the mouth’s opening (horizontally and
vertically), eyes’ opening and closing and the
raising of eyebrows.
In the mouth’s region, the AUs 12, 13, 14
correspond to the horizontal opening; in terms of
distance, D3 replaces these three AUs. The AUs
25, 26, 27 correspond to the vertical opening; in
terms of distance, D4 replaces these three AUs.
ESTIMATION OF FACIAL EXPRESSION INTENSITY BASED ON THE BELIEF THEORY
453

In the eye’s region, the AUs 1, 2, 4 represent the
intensity’s variation from low to raised brows. In
terms of distance, D2 replaces these three AUs. The
AUs 41, 42, 43 or 45 represent the intensity’s
variation from slightly drooped to closed eyes. In
terms of distance, D1 replaces these three AUs.
2.2 Belief Theory
Initially introduced by (A. Dempster, 1967) and
(Shafer, 1976), and enriched by (P. Smets, 1994), the
belief theory considers a frame of discernment Ω =
{E1, ...,EN} of N exhaustive and exclusive
hypotheses characterizing some situations. This
means that the solution of the considered problem is
unique and that it is obligatorily one of the
hypotheses of Ω. This approach takes into account
the uncertainty of the input information and allows
an explicit modeling of the doubt between several
hypotheses, for example the different intensities of
expressions. It requires the definition of a Basic
Belief Assignment (BBA) that assigns an elementary
piece of evidence m(A) to every proposition A of the
power set 2
Ω
. The function m is defined as:
m :2
Ω
→ [0, 1]
A → m(A), ∑ m(A) = 1,
A ⊆ Ω
(1)
In our application, the assumption Ei_min
corresponds to the minimum or low expression
intensity of expression i; Ei_moy corresponds to the
medium intensity and Ei_max corresponds to the
maximum or high intensity. 2
Ω
corresponds to single
expression intensities or to combinations of
expression intensities, that is 2
Ω
= {Ei_min, Ei_moy,
Ei_max ,(Ei_min∪Ei_moy), (Ei_moy∪Ei_max),…},
and A is one of its elements. In that definition, any
kind of expression Ei can be considered.
2.3 Definition of Symbolic States
We associate a state variable Vi (1≤ i ≤ 4) to each
characteristic distance Di in order to convert the
numerical value of the distance to a symbolic state.
The analysis of each variable shows that Vi can take
three possible states, Ω’ = {min, moy, max};
2
Ω’
={min, moy, max, minUmoy, moyUmax} where
minUmoy states the doubt between min and moy,
moyUmax states the doubt between moy and max.
We assume that impossible symbols (for example
minUmax) are removed from 2
Ω’
.
2.4 Modeling Process
The modeling process aims at computing the state of
every distance Di and at associating a piece of
evidence. To carry out this conversion, we define a
model for each distance using the states of 2
Ω'
(Figure 4).
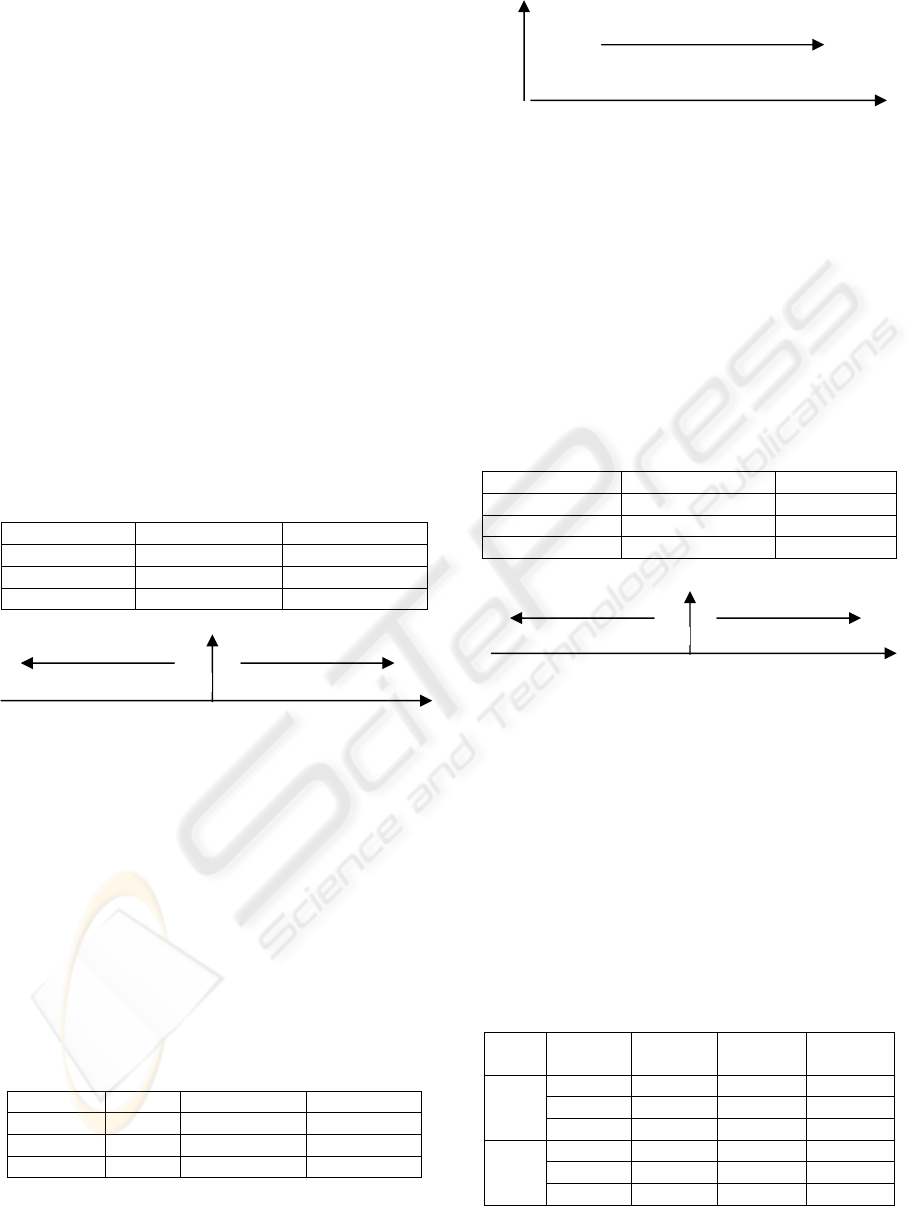
Figure 4: Proposed model.
One model is defined for each characteristic
distance independently of the facial expression. If
the calculated distance increase , we consider the
right half part of the model from i to p thresholds,
and if the calculated distance decrease, we consider
the left half part of the model with from a to h
thresholds like on figures 5,6 and 7. For each value
of Di, the sum of the pieces of evidence of the
states of Di is equal to 1.
m
Di
: 2
Ω
'→ [0 ,1 ]
V
i
→ m
Di
(V
i
)
(2)
The piece of evidence m
Di
(V
i
) is obtained by the
function depicted in Figure 4.
2.5 Definition of Thresholds
Thresholds {a,b,…. P} of each model state are
defined by statistical analysis on
(Hammal_Caplier) Database. The database
contains 21 subjects, it has been divided into a
learning set called HCE
L
and a test set called HCE
. The learning set is then divided into expressive
frames noted HCE
Le
and neutral frames HCE
Ln
.
The minimum threshold a is averaged out over the
minimum values of the characteristic distances
from the HCE
Le
database. Similarly, the maximal
threshold p is obtained from the maximum values.
The middle thresholds h and i are defined
respectively as the mean of minimum and
maximum of the characteristic distances from the
HCE
Ln
. The threshold b is the median of the
characteristic distances values for facial images
assigned to the higher state min, g is the median of
the characteristic distances values for facial images
assigned to the lower state S. The intermediate
threshold d is computed as the mean of the
difference between the limit thresholds a and h
divided by three (according to the supposition in
section 2.1) augmented by the value of the
threshold a. Likewise the threshold e is computed
as the mean of the difference between the limit
thresholds a and h divided by three reduced by the
value of the threshold h. The thresholds c and f are
VISAPP 2008 - International Conference on Computer Vision Theory and Applications
454
computed as the mean of thresholds b and d
respectively e and g. The thresholds from the
positive part of the proposed model are computed
similarly.
2.6 Definition of Expression Intensities
Due to a lack of data, only three expressions (joy,
disgust and surprise) were used to evaluate
expression intensities.
2.6.1 Joy Expression E
1
The most important changes appearing on the face
when smiling are the followings: the corners of the
mouth are going back toward the tears (V
3
goes from
min to max) and the eyes become slightly closed (V
1
goes from max to min see tab.1) so the most
important distances considered in the estimation of
intensity of joy expression are D
1
and D
3
(see Fig.5):
Table 1: Mapping table between characteristic distances
and state variables for joy expression E1.
V1 V3
E1_min Max Min
E1_moy MoyUMax MoyUMin
E1_max Min Max
Figure 5: Evolution of distances in case of joy expression
E
1
.
2.6.2 Surprise Expression E
2
The most important changes appearing on the face
with a surprise expression are: the mouth is opening
vertically (V
4
goes from min to max), the eyes are
opening (V
1
goes from min to max) and eyebrows are
raised (V
2
goes from min to max see tab 2). So the
most important distances considered in the
estimation of intensity of a surprise expression are
D
1
, D
2
and D
4
(see Fig 6).
Table 2: Mapping table between characteristic distances
and state variable for surprise expression E
2
.
V1 V2 V4
E2min Min Min Min
E2moy Moy MoyUMin MoyUMin
E2max Max Max Max
Figure 6: Evolution of distances in case of surprise
expression.
2.6.3 Disgust Expression E
3
The most important changes appearing on the face
with a disgust expression are: the mouth is opening
(V
4
go from min to max) and the eyes become
slightly closed (V
1
go from max to min see tab.3).
So the most important distances considered in the
estimation of intensity of disgust expression are D
1
and D
4
(see Fig. 7).
Table 3: Mapping table between characteristic distances
and state variables for disgust expression E
3
.
V1 V4
E3min Max Min
E3moy MoyUMax Moy
E3max MinUMoy Max
Figure 7: Evolution of distances in case of disgust
expression.
2.7 Logical Rules between Symbolic
States and Facial Expressions
As soon as the characteristic distances states are
assigned to each distance, we have to refine the
process by formulating the joint Basic Belief
Assignment in terms of facial expressions. To do
so, we use tables of logical rules. As an example,
Table 4 gives the logical rules for D
1
and D
3
for the
joy expression.
Table 4: Logical rules for D
1
and D
3
for joy expression.
Vi State
Value
E1_min E1_moy E1_max
Min 0 0 1
Moy 0 1 0
V1
Max 1U0 1U0 0
min 1U0 1U0 0
Moy 0 1 0
V3
max 0 0 1
If a state is reached by an expression, we have ”1”,
and “0” otherwise. This table can be interpreted as:
D1
D4
Min
Max
Min Max
D1, D2, D4
Min Max
D1 D3
Min Max Min Max
ESTIMATION OF FACIAL EXPRESSION INTENSITY BASED ON THE BELIEF THEORY
455
if V
1
= max then the reached expression corresponds
to E1_minUE1_moy, it means that:
m
D1
(max)=m
D1
(E1_minUE1_moy)
m
D1
(moy)=m
D1
(E1_moy)
m
D1
(min)=m
D1
(E1_max)
m
D3
(max)=m
D3
(E1_max)
m
D3
(moy)=m
D3
(E1_moy)
m
D3
(min)=m
D3
(E1_minUE1_moy)
2.8 Data Fusion and Global Belief
Assignment Computation
In order to make the decision about the intensity of
facial expression, the available information m
Di
is
combined to be integrated with the (Dempster, 1967)
combination law (conjunctive combination). For
example we consider two characteristic distances Di
and Dj to which we associate two Basic Belief
Assignments m
Di
and m
Dj
defined on the same frame
of discernment 2
Ω
. Then the joint Basic Belief
Assignment m
Dij
is given using the conjunctive
combination (orthogonal sum) as:
m
Dij
(A) = (m
Di
⊕
m
Dj
)(A)
= ∑m
Di
(B)m
Dj
(C)
B∩C=A
(3)
Where A, B and C denote propositions and B ∩ C
denotes the conjunction (intersection) between the
propositions B and C.
To be more explicit, we consider these Basic Belief
Assignments (see tab.5):
m
D1
(minUmoy)=m
D1
(E1_maxUE1_moy)
m
D1
(moy)=m
D1
(E1_moy)
m
D3
(moy)=m
D3
(E1_moy)
Table 5: Example of combinations of two distances.
D1/D3 E1_minUE1_moy E1_moy
E1_moy E1_moy E1_moy
mD13(E1_moy)=
mD1(E1_minUE1_moy).mD3(E1_moy) + mD1(E1_moy).
mD3(E1_moy)
2.9 Post-processing in Case of Conflict
Some times, the empty set appears in the
combination table of distances. It corresponds to
situations where the values of characteristic distances
leading to symbolic states configuration do not
correspond to any of the definitions of any
expression (see tab.6-7). This has to be related to the
fact that Ω is not really exhaustive .In the reality,
every body expresses his emotions differently, some
times he opens his eyes, raises his eyebrows but does
not open his mouth in the case of surprise (see
Fig.8).
Figure 8: Example of surprise with conflict
m
D1
(moy)=1=m
D1
(E2_moy)
m
D2
(max)=1= m
D2
(E2_max)
m
D4
(moy)=1=m
D4
(E2_moy)
Tables 6-7: Examples of combination of three distances.
D1/D4 E2_moy
E2_moy E2_moy
m
D14
(E2_moy)=m
D1
(E2_moy).m
D4
(E2_moy)
D14/D2 E2_moy
E2_max Ǿ
Error
In these cases, we propose a solution as a post
processing. According to FACS Investigator's
Guide, the number of activated AUs is used to
estimate the intensity of an expression. If only 2
AUs from 4 are activated when an expression is
expressed, we can say that the intensity is not max.
In the same way, when we have one distance which
is not at its limit (max or min), the expression is not
at its limit too (max or min) so it is a medium
expression intensity.
2.10 Decision
The decision is the last step of the process. It
consists in making a choice between three intensity
assumptions and their possible combinations.
Making a choice means taking a risk, except if the
result of the combination is perfectly reliable:
m(Ei)= 1. Here, the selected proposal is the one
with the maximum value of the piece of evidence.
3 EXPERIMENTS AND
RESULTS
3.1 Results on Hammal_Caplier
Database
The best way to experiment our algorithm on
different intensities is to test it on video recordings
VISAPP 2008 - International Conference on Computer Vision Theory and Applications
456
of different subjects expressing different expressions.
The face changes from expressionless to an
expression with maximal intensity, and then changed
back to an expressionless face starting and ending by
a neutral state, passing by different intensities (see
Fig.9). The (Hammal_Caplier) database contains 21
subjects, 3 expressions Joy, Surprise and Disgust and
each video contains 100 frames .
For the expertise step of the Belief theory, we have
considered 10 subjects for each expression. 10 cases
of low intensity which correspond to the first frame
of the video recording where a human expert can
distinguish the first changes on the face; 10 cases
with high intensity which correspond to the apex of
each expression; 10 cases with medium intensity
taken from the video recordings corresponding to
the face changes from the expressionless to the
expression with maximal intensity and 10 other cases
of medium intensity taken from the video recordings
corresponding to changing back to an expressionless
face, images on figures 16,17 and 18 shows different
intensities min, moy and max of joy surprise and
disgust expressions respectively.
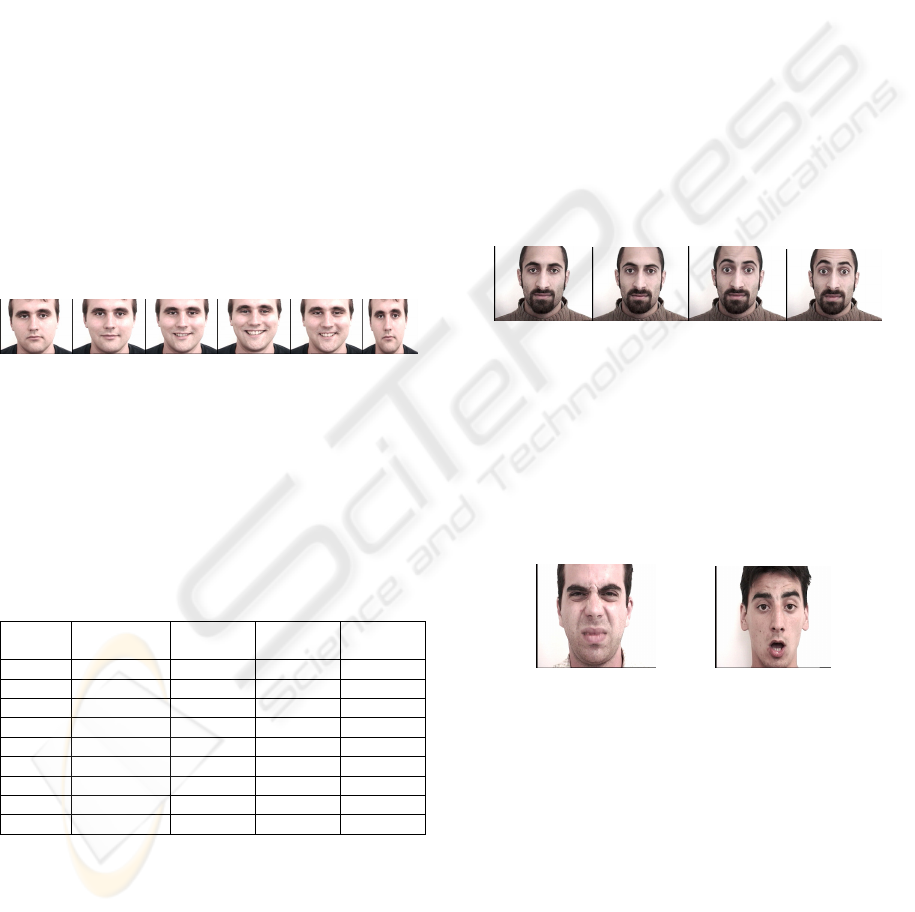
Figure 9: Example of 6 images from a Video recording of a
Joy expression.
As entries of our algorithm, we have the recognized
expression, then different distances are computed,
and the Belief theory is applied to give the results of
table 8:
Table 8: Classification rates in percent for 3 intensities of
each expression from the 3 expressions Joy, Surprise and
Disgust on the HCE database.
Exp. recognized Doubt
min/moy
Doubt
moy/max
Error
E1min 70% 30% 0% 0%
E1moy 95% 0% 5% 0%
E1max 100% 0% 0% 0%
E2min 52,89% 47,11% 0% 0%
E2moy 81,25% 0% 0% 18,75%
E2max 66,66% 0% 0% 33,33
E3min 32,5% 42,5% 0% 25%
E3moy 53,85% 7,69% 0% 38,5%
E3max 62,5% 0% 12,5% 25%
In this table, lines correspond to different intensities
of each of the three expressions (Joy E1; Surprise
E2; Disgust E3), and columns correspond to rates of
different cases. The first column corresponds to rates
of recognized intensity of the appropriate expression,
the second column corresponds to rates of images
from the database for which there is a doubt between
minimum and medium intensity of the expression,
the third column corresponds to rates of images
from the database for which there is a doubt
between the medium and maximum intensity of the
expression and the last column corresponds to the
cases where an error occurs.
We observe that the best results are obtained in
case of joy expression. We observe also that good
rates are obtained when we have medium or
maximum intensity of an expression. On the
contrary rates obtained with minimum intensity are
lower, this can be explained by the fact that the
HCE database has been created to identify
expressions (joy , surprise and disgust) and not to
estimate intensities so most of the subjects can not
express their emotions with minimum intensity for
all features and they do not spend enough time in
expressing minimum intensity of the expression.
They pass directly to the apex of the expression.
For example, in case of surprise we can observe
quick changes to reach the apex expression (see
Fig.10):
Frame 22 Frame 23 Frame 24 Frame 25
Figure 10: Example of video recording of surprise
expression without passing by minimum intensity.
We also observe that although it is about the same
expression, there are some errors; this can be
explained by the fact that most subjects express
emotions by giving the maximum intensity to some
features and not enough to another one, for
example see Fig.11:
mD1(min)=1=mD1(E3max)
mD4(moy)=1=mD4(E3moy)
mD14(Ǿ)=1
Figure 11: Example of conflict in disgust on the left and
surprise expression on the right respectively.
From the left of Figure 11, one can see that the
subject with disgust expression has closed his eyes,
so the piece of evidence given to the state of the
distance D1 correspond to high intensity,
on the
other hand his mouth is hardly open so the piece of
evidence given to the state of distance D4
correspond to medium intensity, the combination
of the two distances gives an error. In the same
mD1(moy)=1=mD1(E2moy)
mD2(moy)=1=mD2(E2moy)
mD4(max)=1=mD4(E2max)
mD124(Ǿ)=1
ESTIMATION OF FACIAL EXPRESSION INTENSITY BASED ON THE BELIEF THEORY
457
way, from the right of Figure 11, one can see that the
subject with surprise expression has opened widely
the mouth so the piece of evidence given to the state
of distance D4 correspond to high intensity and on
the other hand he fairly opened his eyes, and fairly
raised his eyebrows so the pieces of evidence given
to the states of the distances D1 and D4 correspond
to medium intensity, the combination of the three
distances gives an error.
Finally, we can observe that when we have minimum
intensity of expressions, we can have a rate for the
doubt between minimum intensity and medium one
but zero doubt between minimum intensity and
maximum one (0%). In the case of medium intensity
we can get doubt between medium and minimum or
between medium and maximum intensity and in the
maximum case, we can get doubt between minimum
and medium but zero doubt between maximum and
minimum (see Fig 12, 13 and 14).
mD124(E2minUE2moy)=1 mD14(E3minUE3moy)=1
Figure 12: Example of doubt between minimum and
medium intensity in case of surprise expression on the left
and disgust on the right.
mD13(E1minUE1moy)=1 mD13(E1moyUE1max)=0.976
Figure 13: Example of doubt between minimum and
medium intensity in case of joy on the left and doubt
between medium and maximum intensity in case of same
expression on the right.
mD14(E3moyUE3max)=1
Figure 14: Example of doubt between medium and
maximum in disgust expression.
In order to eliminate errors we can add the post
processing. To do so, we consider that if we have
one of the characteristic distances taken in the count
to estimate the intensity of an expression which is
not equal to its limit (max or min) we can say that we
have a medium intensity.
We can also use this method to estimate expression
intensity but obtained results are less correct than
ones obtained using the belief theory. It could be
preferable to keep the doubt between two
intensities instead of taking the risk of choosing the
wrong one. The TBM are actually well adapted for
such a scenario. Figure 15 shows an example of
intensity estimation with and without the belief
theory.
Figure 15: Doubt between min and moy intensity.
Results with the belief theory :
mD1(max)=1=mD1(E1minUE1moy)
mD3(minUmoy)=1= mD3(E1minUE1moy)
mD13(E1minUE1moy)=1
Results with the other method :
V1=max ; V3=minUmoy
Ö E1moy
An expert says that it is righter if we say that it can
be a minimum and it can be a medium intensity ,
than when we say that it is a medium intensity so
the belief theory is more exact than the other
method.
With the proposed post processing step, the
recognition rate changes and the rates of errors are
added to recognized ones , for the doubt state min-
moy or moy-max, the system is sure that the
current intensity of the expression is one of these
two ones and that it is not the third one. It is thus
possible to consider it as a good classification and
we can associate it to the corresponding intensity.
This allows us to add their respecting rates leading
to the rates of recognized ones and then we get at
the end of the process a recognized intensity of
every state of any expression (Joy, Surprise and
Disgust) (see Tab. 9).
Table 9: Classification rates in percent for 3 intensities
of each expression from the 3 expressions Joy, Surprise
and Disgust on the HCE database after the post
processing.
Exp.
recognized
Doubt
min/moy
Doubt
moy/
max
Error
E1min 70% 30% 0% 0%
E1moy 95% 0% 5% 0%
E1max 100% 0% 0% 0%
E2min 52,89% 47,11% 0% 0%
E2moy 100% 0% 0% 0%
E2max 100% 0% 0% 0%
E3min 57,5% 42,5% 0% 0%
E3moy 92,11% 7,69% 0% 0%
E3max 87,5% 0% 12,5% 0%
VISAPP 2008 - International Conference on Computer Vision Theory and Applications
458
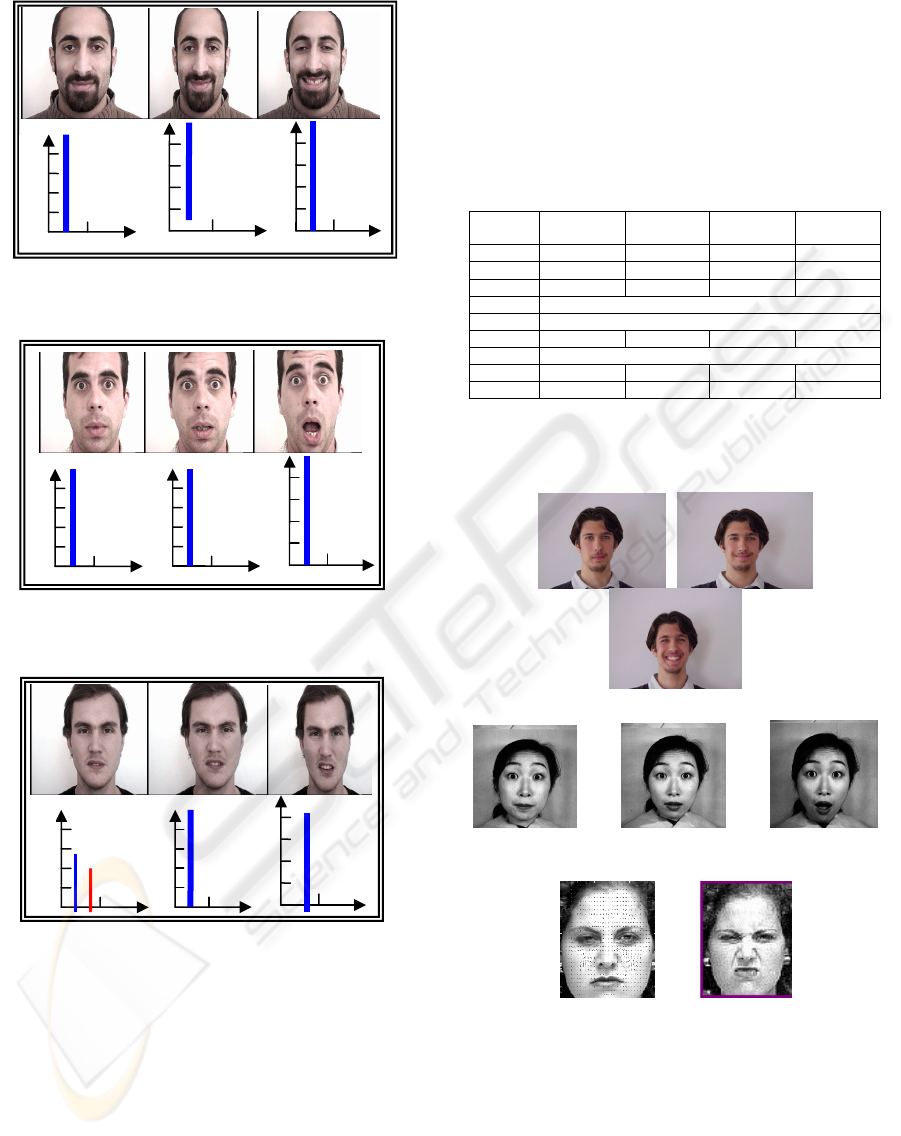
Figure 16: Example of Minimum, medium and maximum
Intensities of Joy on the first row and the correspondent
piece of evidence on the second row.
Figure 17: Example of Minimum, medium and maximum
Intensities of surprise expression on the first row and the
correspondent piece of evidence on the second row.
Figure 18: Example of Minimum, medium and maximum
Intensities of disgust expression on the first row and the
correspondent piece of evidence on the second row.
3.2 Results on EEbase Database
In order to evaluate the robustness of the proposed
recognition system to different variations, the system
is also tested on the (EEbase database). This database
contains 43 subjects, 24 males and 19 females, for
each subject, we have 16 frames in neutral, joy,
disgust, sadness, anger, surprise and fear
expressions. For the joy expression we have 3 frames
which represent three intensities (low, medium and
high), for the disgust expression we have two
intensities (medium and high) and for the surprise
expression we have only the high intensity. To
compute the rates of recognition intensities on this
database, we have considered 21 subjects (see
Tab.10).
Table 10: Classification rates in percent for 3 intensities
of each expression from the 3 expressions Joy, Surprise
and Disgust on the “eebase” database.
Exp. recognized Doubt
min/moy
Doubt
moy/max
Error
E1min 50% 50% 0% 0%
E1moy 70% 0% 30% 0%
E1max 100% 0% 0% 0%
E2min Images not available
E2moy Images not available
E2max 100% 0% 0% 0%
E3min Images not available
E3moy 70% 0% 0% 30%
E3max 90% 0% 10% 0%
In this table, we can see that we are about the same
observations when testing the first experimental
database.
mD13(E1min)=1mD13(E1moy)=1 mD13(E1max)=1
mD124(E2min)=1mD124(E2moy)=1
mD124(E2max)=1
mD14(E3min)=1 mD14(E3max)=1
Figure 19: Examples of classification on other images
from other databases.
4 CONCLUSIONS
In this paper, we have presented a new method to
estimate human facial expression intensities by
using the belief theory.
0.8
0.6
0.4
0.2
Maximum
0.8
0.6
0.4
0.2
Madim
0.8
0.6
0.4
0.2
Minimum
Median
0.8
0.6
0.4
0.2
Maximum
0.8
0.6
0.4
0.2
Madium
0.8
0.6
0.4
0.2
Minimum
0.8
0.6
0.4
0.2
Maximum
0.8
0.6
0.4
0.2
Madium
0.8
0.6
0.4
0.2
Minimum
ESTIMATION OF FACIAL EXPRESSION INTENSITY BASED ON THE BELIEF THEORY
459

This method takes into account the most important
changes which appear on human face when
expressing an emotion. By interpreting these changes
in terms of distances, results given by our method
have proved that the most important factor to
estimate expression intensity is the degree of
geometrical deformation of facial structures which
are interpreted by the proposed distances (D1, D2,
D3, D4). Since the Transferable Belief Model has
proved its ability to deal with imprecise data, and its
interest to model the doubt between expression
intensities, it is used for the fusion of the available
information to provide more reliable decisions. Our
aim is then to validate our algorithm on the three
other expressions Fear, Sadness and Anger, and then,
confirm these results on natural expressions.
REFERENCES
Bui TD, Heylen D, Poel M, Nijholt A, 2002 « ParleE: An
adaptive plan-based event appraisal model of emotions
» Proceedings KI, 25th German Conference on
Artificial Intelligence, eds. M Jarke, J Koehler & G
Lakemeyer, Springer, Aachen, 2002.
Edwards, K, 1998 The face of time: Temporal cues in
facial expression of emotion. Psychological Science, 9,
270-276.
I. Essa and A. Pentland, 1997 “Coding, analysis,
interpretation, and recognition of facial expressions”.
IEEE Trans. on Pattern Analysis and Machine Intell.,
19(7):757–763.
S. Kimura and M. Yachida, 1997 “Facial expression
recognition and its degree estimation”. In Proc. Of the
Int. Conf. on Computer Vision and Pattern
Recognition, 295–300.
J.J. Lien, T. Kanade, J. Cohn, and C. Li, 1998 “Subtly
different facial expression recognition and expression
intensity estimation”. In Proc. of the IEEE Int. Conf.
on Computer Vision and Pattern Recognition, 853–
859.
M. Bartlett, J. Hager, P.Ekman, and T. Sejnowski, 1999.
“Measuring facial expressions by computer image
analysis”. Psychophysiology, 36:253–264.
Y.-L. Tian, T. Kanade, and J. Cohn, Sept 2000 “Eye-state
action unit detection by Gabor wavelets”. In Proc. of
Int. Conf. on Multi-modal Interfaces, 143–150.
N. Eveno, A. Caplier, P.Y. Coulon. “Automatic and
Accurate Lip Tracking”. IEEE Trans. on CSVT, Vol.
14, 706–715, 2004.
Z. Hammal, A. Caplier. “Eye and Eyebrow Parametric
Models for Automatic Segmentation”. IEEE SSIAI,
Lake Tahoe, Nevada, 2004.
Z. Hammal, L. Couvreur, A. Caplier, M. Rombaut “Facial
Expression Classification: An approach based on the
fusion of facial deformations using the Transferable
Belief Model” Int. Jour. Approximate Reasonning, doi:
10.1016/j.ijar.2007.02.003, 2007.
P. Ekman, W.Friesen, J. Hager, 2002 “Facial Action
Coding System”. The Manual ISBN 0-931835-01-1,.
A. Dempster, 1967 “Upper and lower probability
inferences based on a sample from a finite
univariate”. Biometrika, 54: 515-528.
Shafer, Glenn, 1976. A Mathematical Theory of
Evidence. Princeton University Press.
P. Smets, R. Kennes, 1994 “The Transferable Belief
Model”. Artificial Intelligence, 66 (2): 191-234.
Hammal_Caplier Database :
http://www.lis.inpg.fr/pages_perso/caplier/english/e
motionnelle.html.en/emotionnelle_2.html.en.html
EEBase Database :
http://www.cs.cmu.edu/afs/cs/project/cil/ftp/html/v-
images.html
VISAPP 2008 - International Conference on Computer Vision Theory and Applications
460
