
ENTROPY-BASED SALIENCY COMPUTATION
IN LOG-POLAR IMAGES
∗
Nadia Tamayo
Computer Science Dept., Universidad de Oriente, Santiago de Cuba, Cuba
V. Javier Traver
Computer Languages & Systems Dept., Universitat Jaume I, Castell
´
on, Spain
Keywords:
Log-polar images, Entropy-based saliency, Space-variant sampling, Adaptive scale.
Abstract:
Visual saliency provides a filtering mechanism to focus on a set of interesting areas in the scene, but these
mechanisms often overload the computational resources of many computer vision tasks. In order to reduce
such an overload and improve the computational performance, we propose to exploit the advantages of log-
polar vision to detect salient regions with economy of computational resources and quite stable results. Par-
ticularly, in this paper we study the application of the entropy-based saliency to log-polar images. Some
interesting considerations are presented in reference to the concept of “scale” and the effects of space-variant
sampling on scale selection. We also propose a necessary border extension to detect objects present in pe-
ripheral areas. The original entropy-based saliency algorithm can be used in log-polar images, but the results
show that our adaptations allow to detect with more precision log-polar salient forms because they consider the
information redundancy of space-variant sampling. Compared with cartesian, log-polar salient results allow a
significant saving of computational resources.
1 INTRODUCTION
Log-polar vision (Bolduc and Levine, 1998) is one
kind of foveal images which has become popular in
the last years due to its advantages in active vision
tasks such as target tracking (Traver and Pla, 2005) or
vergence control (Manzotti et al., 2001), to name but
a few. However, other important visual tasks have not
received the same attention from the research commu-
nity. In particular, in this paper we focus on the prob-
lem of visual saliency (Itti, 2003) as framework to
a saliency-based interest points detection (Kadir and
Brady, 2001) on log-polar images.
To cope with the huge amount of visual data in
the scene, visual search processes provide a filter-
ing mechanism so that only perceptually salien spa-
tial locations or objects will be selected for further
processing. These mechanisms are of key importance
for agents (either natural or artificial) to interact effi-
ciently with the environment.
∗
Acknowledgments to projects HP2005-0095 (Inte-
grated Actions) and CSD2007-00018 (Consolider-Ingenio),
both funded by the spanish Ministerio de Educaci
´
on y Cien-
cia.
There are at least three reasons suggesting the rel-
evance of dealing with visual search on log-polar im-
ages: (1) both, visual search and log-polar imaging,
are (related) problems of practical interest in com-
puter and robot vision; (2) both have important bio-
logical foundations in the human visual system (Itti,
2003; Schwartz, 1977); and (3) some interplay can
be expected between the two problems when they are
considered simultaneously. In spite of this interest,
there are a very few works addressing the problem
of saliency computation on log-polar images. One
example is (Orabona et al., 2005), where the popu-
lar computational visual search model (Itti and Koch,
2000) is applied to log-polar images.
In contrast, our work explores the entropy, a con-
cept based on information theory, as a means of
computing visual saliency in log-polar images. This
makes sense because entropy is a measure of random-
ness and this, in turn, can be related to saliency, since
randomness is akin to “rarity”, and information be-
come salient when it is “rare”, i.e., different to infor-
mation in some local neighbourhood. Our approach
studies the application of the proposal of (Kadir and
Brady, 2001) to log-polar images. The behaviour of
this method is compared using computational perfor-
501
Tamayo N. and Javier Traver V. (2008).
ENTROPY-BASED SALIENCY COMPUTATION IN LOG-POLAR IMAGES.
In Proceedings of the Third Inter national Conference on Computer Vision Theory and Applications, pages 501-506
DOI: 10.5220/0001076405010506
Copyright
c
SciTePress

mance under both image formats (cartesian and log-
polar). One of the most interesting considerations
refers to the concept of “scale”. Visual information
can be salient at some particular scale. However,
while in cartesian images, scale has a global meaning,
it varies across a log-polar image. This new concept
of scale and its effect on saliency computation is also
studied in this paper.
This paper is organized as follows. First, an
overview of the entropy-based saliency computation
is given in Sect. 2. Sect. 3 describes some neces-
sary adaptations of the approach to log-polar images.
Then, experimental work is described in Sect. 4. Fi-
nally, in Sect. 5 we emphasize the main conclusions
and mention ideas of further work.
2 ENTROPY-BASED SALIENCY
COMPUTATION
Saliency is a measure of the object distinctiveness
among its neighbours and it can be quantified in sev-
eral ways (Itti, 2003; Kadir and Brady, 2001). The
maximum local entropy is a measure that allows to
compute the saliency value. Particularly we explore
here the Scale Saliency (Kadir and Brady, 2001), a
detection method using the local entropy to report
salient regions.
2.1 Local Entropy Computation
The local entropy computation algorithm, or Scale
Saliency (Kadir and Brady, 2001) estimates salient
points showing unpredictable characteristics simul-
taneously in the space-scale of the point. The lo-
cal complexity or unpredictability in the space of the
point is measure by Shannon Entropy of local im-
age attributes. This metric depends on the Probability
Density Function (PDF) taken the grey level of the
image as the local descriptor. Although we only use
the grey level of image, other local image descriptors,
such as color, orientation or edge information could
also be employed.
On the other hand, to measure the scale unpre-
dictability, the local PDF is estimated at multiples
scales and the extremes in the entropy are used as
a base for scale selection. In this way, the statistics
of the local descriptor over a range of scales around
the peaks are used to estimate the inter-scale unpre-
dictability.
Scale Saliency measures the entropy for each pixel
location over a range of scales, choosing those scales
at which the entropy is maximun. Then for such max-
imum scales, the entropy value is weighted by the
metric of inter-scale unpredictability. The algorithm
yields a three-dimensional vector with the spatial lo-
cation (two dimensions) and scale for each salient
value.
2.2 Clustering using Local Probability
Density
The Scale Saliency algorithm mentioned above re-
ports a too great number of salient points, many of
which are neighbours and salient at a similar scale.
Therefore, a clustering procedure is needed to repre-
sent all these points more efficiently and less redun-
dant. However, since neither the number of salient
points nor the number of clusters are known a pri-
ori, the clustering algorithm used in (Kadir and Brady,
2001) seems not adequate. In contrast, we use an al-
ternative clustering approach (Pascual et al., 2006),
only requiring a radius r to define the density func-
tion from which data points are grouped. For the
user point of view, this radius is easier to set than the
number of clusters (how r is set will be explained in
Sect. 4). The input data to the clustering algorithm
are three-dimension vectors: the two spatial dimen-
tions and the scale of the detected salient points.
3 DEALING WITH
SPACE-VARIANT SAMPLING
Log-polar images can be obtained by different tech-
niques (Traver and Pla, 2003). In this work we use
a software-based transformation (Bolduc and Levine,
1998) by resampling a cartesian image using the
space-variant log-polar grid. This grid consists of R
concentric rings whose size grow exponentially from
the center (fixation point) to periphery, and of S uni-
formly spaced angular sectors. To refer to discrete
positions in a log-polar image, it is used the notation
(u,v), where 0 ≤ u < R and 0 ≤ v < S.
The loss of information content imposed by the
foveation process represents a problem to extract the
features from space-variant representations. In this
context, the scale is not a global concept but it takes
a local meaning, which calls for some adaptations of
the scale selection of the original algorithm. On the
other hand, the Scale Saliency does not analyse im-
age borders, thus the salient regions associated with
peripheral information are difficult to detect. The fol-
lowing subsections address both issues.
VISAPP 2008 - International Conference on Computer Vision Theory and Applications
502
3.1 Adaptive Scale Selection
Due to the space-variant nature to the log-polar ge-
ometry, receptive fields (RF) cover different surfaces
of an imaged scene, depending on the eccentricity of
their location. RFs closer to the center become much
smaller than the cartesian pixels, in this case carte-
sian pixels are considered oversampled. However, the
peripheral RFs have many associated cartesian pixels,
which they are undersampled. These sampling effects
(oversampling and undersampling) influence on the
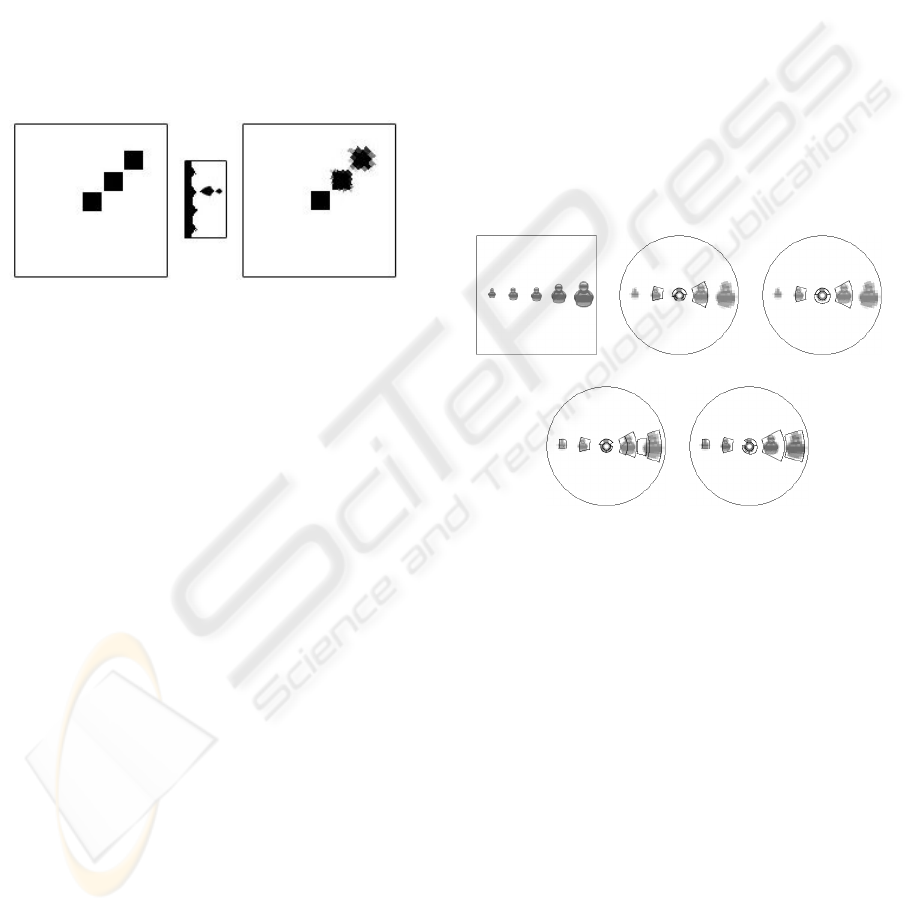
object information content in log-polar images. Fig-
ure 1 shows these sampling effects on a black square
at different eccentricities.
Figure 1: Effects of the space-variant sampling: synthetic
cartesian image (left) mapped to log-polar coordinates (cen-
ter) and mapped back to cartesian coordinates (right).
Notice that the closer to the center the object lo-
cation is, the more redundant the object information
content. As the object location comes closer to the
periphery, object information redundancy is consid-
erably reduced. These variations of the information
content can be measured by quantifying the RF’s size
(Traver and Pla, 2003). The RF’s area in the ring u is
denoted by σ(u).
In Figure 1 note that object’s scale decreases pro-
portionally to object’s eccentricity. For that reason,
scale selection on log-polar image needs to consider
the size of RFs considered by space-variant sampling
in each location. We propose to use a dynamic expres-
sion to scale selection, which we have called adaptive
scale and it is expressed as:
s
l
(u,s
c
) = s
c
/σ(u), (1)
where s
l
is the log-polar scale corresponding to the
scale s
c
∈ [s
min
,s
max
] in the Cartesian space.
3.2 Border Extension
Objects present in peripheral areas are difficult to de-
tect because (i) the loss of information is stronger
there, and (ii) the borders of an image are not analysed
by Scale Saliency (Kadir and Brady, 2001). However
there may be interesting peripheral regions that may
result in salient regions if the borders of log-polar im-
age are analyzed with an adaptive scale. To make this
analysis possible, we propose to consider the infor-
mation related to peripheral areas. In order to deal
with this border information, we suggest to duplicate
the last s
l
(R,s
max
) rings starting from the last ring R
(Figure 2).
On the other hand, to make easy the access to the
data in the multiscalar analysis, the first and last sec-
tors of the polar disposition are attached to both ends
of the angular axis (v), as shown in Figure 2. Notice
that this extension is only necessary to deal with the
angular discontinuity.
Figure 3(a) shows a synthetic cartesian image with
a same object of different sizes located at different
positions on the log-polar image. Figure 3(b) shows
the results of the salient regions detected without any
adaptation. Figure 3(c-e) shows salient regions by us-
ing either (or both) of these adaptations.
(a) (b) (c)
(d) (e)
Figure 3: Example of peripheral salient regions detected on
log-polar image: (a) synthetic cartesian image (256 × 256)
with different sizes and positions of an object; detection re-
sults (b) without any adaptations, (c) with adaptive scale
but without border extension, (d) with border extension but
without adaptive scale, and (e) with both adaptations. The
log-polar image (64 × 128) was computed from (a).
Notice that, without border extension, the salient
regions located in last rings are missed (Fig-
ure 3(c)).Without adaptive scale, object-like regions
are splitted (Figure 3(d)). Best results are obtained
when both adaptations are combined; the objects
present on the image borders are detected even when
the object’s size is very small (Figure 3(e)).
4 EXPERIMENTAL RESULTS
In this section, we present and discuss the exper-
imental results of the entropy-based regions detec-
ENTROPY-BASED SALIENCY COMPUTATION IN LOG-POLAR IMAGES
503
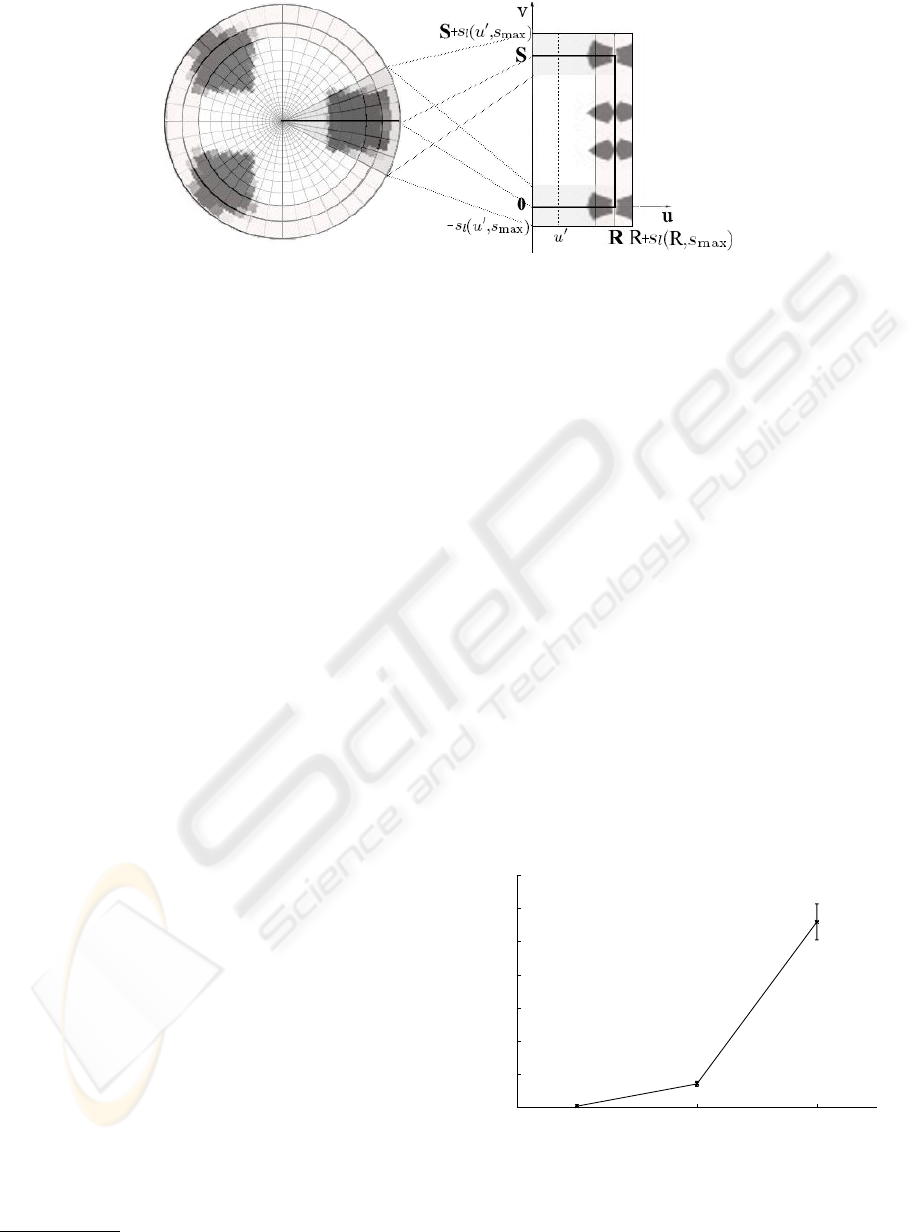
Figure 2: Border extension: on axis v are attached the s
l
(u
0
,s
max
) first and last angular sectors, after and before S angular
sectors respectively, where u
0
= s
l
(0,s
min
) is the first ring to analyse in order to discard the redundant information of the first
rings; on axis u are attached the s
l
(R,s
max
) last rings (peripheral area) after R rings of log-polar image.
tion on log-polar images combining it with adaptive
scale selection and of border extension on this kind
of foveal images. In spite of the difficulties brought
by log-polar sampling, salient regions detected with
log-polar images approximately match those found
with cartesian images. We experimented the effects
of changes in log-polar image size/resolution and in
object’s size on the reported salient regions. We also
analyse some examples of salient results on images
affected by geometric transformations.
The resulting salient regions were obtained by
combining the entropy-based detection and density-
based clustering (Sect. 2) with our proposed adap-
tations (Sect. 3). The range [s
min
,s
max
] of carte-
sian scales was set to [5, 25] and the range of log-
polar scales was set to [s
l
(u,1),s
l
(u,S/10)] where
s
c
∈ [1,
b
S/10
c
]. The input data to the clustering are
the scale and the cartesian or polar coordinates, de-
pending if the detection was made on Cartesian or
log-polar space. The data points were normalized by
considering the range of values in each case (the size
of image for the coordinates and the range of scales
for the scale).
Regarding r, the parameter of the clustering algo-
rithm (Sect. 2.2), it was heuristically set as a func-
tion of the average cartesian scale s
M
of the detected
salient points that is known in both cases. In cartesian
case, r = s
M
but, in the log-polar case, r is also con-
sidered as a function of the eccentricity of the salient
points and it is dynamically computed for each point
(u,v) to cluster as r(u) = s
M
/σ(u).
In order to validate our proposed adaptations, we
selected images from different test sets from the pub-
lic Caltech repository database
1
. The behaviour of
this method was compared on both image formats
(cartesian and log-polar) by using the computational
performance as criteria. Figure 4 shows the average
1
http://www.robots.ox.ac.uk/
˜
vgg/
ratios of running times with log-polar images com-
pared with their corresponding cartesian results for 21
images. Notice that, the horizontal axis shows log-
polar image sizes of 32 × 64, 64 × 128 and 96 × 192,
corresponding to 3%, 13% and 28% of cartesian size
(256 × 256). The original algorithm takes about 24
minutes on cartesian images but reductions as big as
3%-10% are possible with log-polar images. Run-
ning times are still too large (about 1-3 minutes) in
log-polar images, however, these represent very sig-
nificant speed-ups, considering how costly the orig-
inal algorithm is (Mikolajczyk et al., 2005). Fur-
ther improvements are possible by introducing opti-
mizations, such as (Suau and Escolano, 2007), which
would make real-time and frame-rate processing pos-
sible.
Figure 5 shows some examples of salient regions
results with different experimented log-polar sizes.
The results show that, while cartesian and log-polar
salient regions are not directly comparable, some
0
2
4
6
8
10
12
14
96x192 (28)64x128 (13)32x64 (3)
Ratio of detection times [%]
Log-polar image size (size ratio w.r.t. cart. 256x256 [%])
Figure 4: Comparing computational performance in log-
polar images with different image sizes. Horizontal axis
shows log-polar image sizes and in parenthesis, the size ra-
tio. The running time measure was second.
VISAPP 2008 - International Conference on Computer Vision Theory and Applications
504
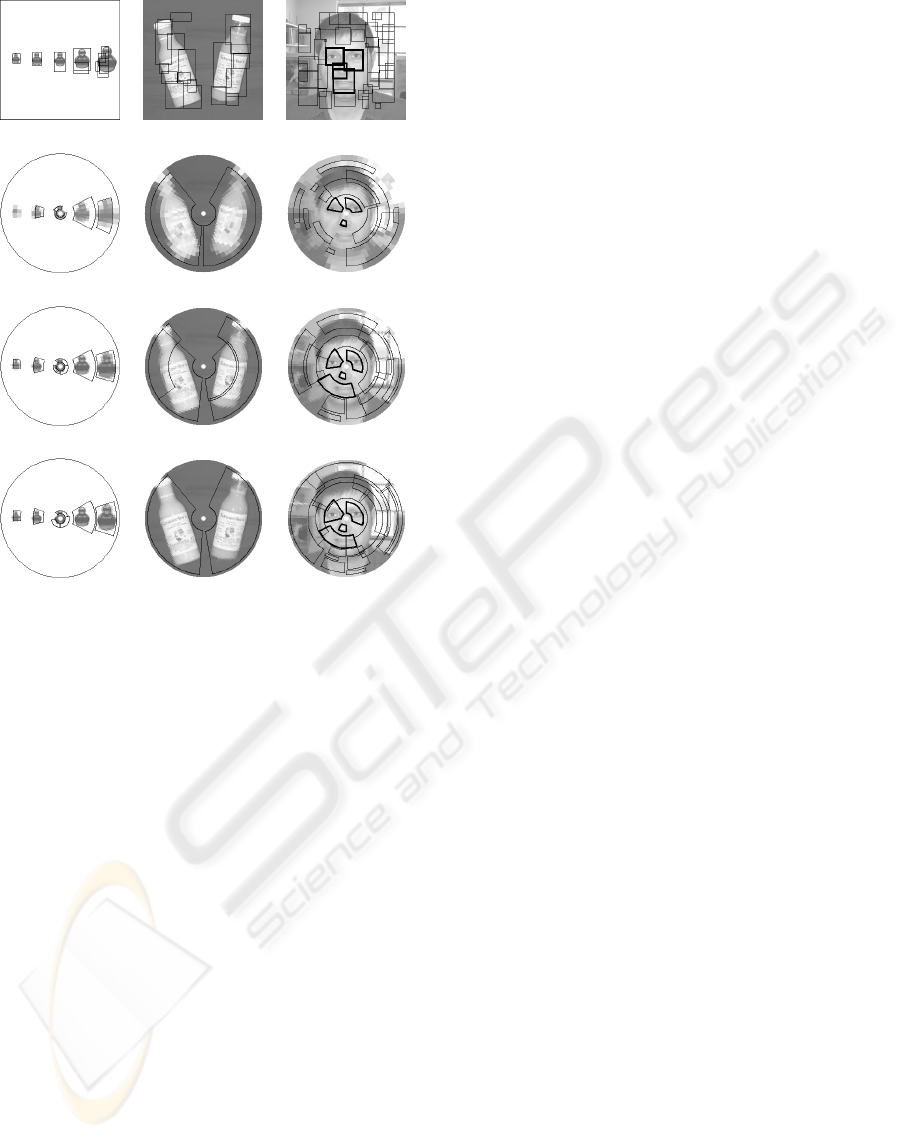
(a) 256 × 256
(b) 32 × 64
(c) 64 × 128
(d) 96 × 192
Figure 5: Examples of salient regions with different log-
polar sizes. From top to down are: cartesian results in the
first row; log-polar results in second, third and fourth rows
with sizes. From left to right: synthetic image, controled
image, and cluttered background image.
salient areas are detected in both cases (Figure 5)
with a significant speed-up (Figure 4). Results are
not exactly the same with different log-polar image
sizes, but some distinctive features are selected inde-
pendently of the log-polar image size (e.g., eyes and
nose in Figure 5(c)).
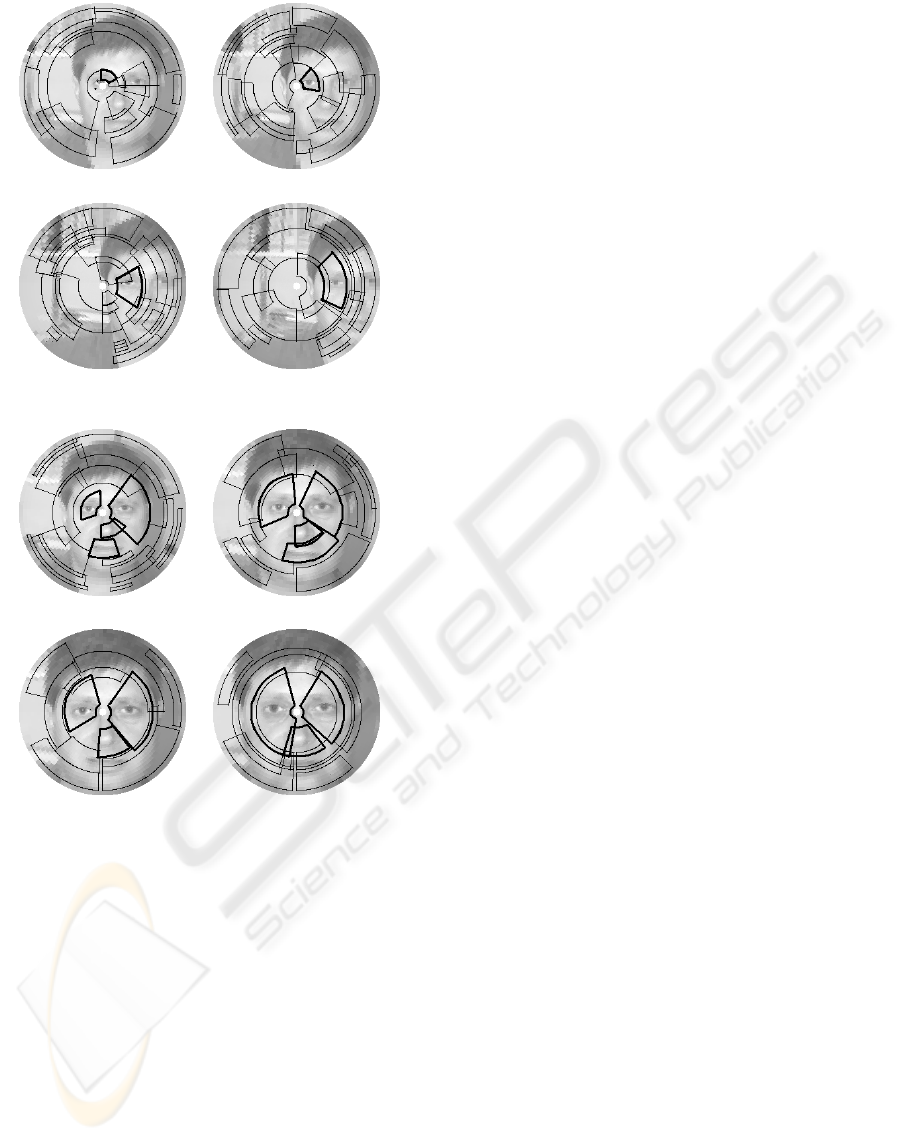
To study the effect of geometric transformations
on the repeatability of the salient results in log-polar
images, experiments were performed with scalings
and translations. Figure 6, shows salient regions with
gradual scale changes (10% per step up to 140%) and
gradual translations shifts (20 pixels along x-axis per
step up to 80). In Figure 6 an example of a face on
a cluttered background is shown. Notice that even
when the variation of information is more accentuated
(closer to peripheral zones), some salient regions are
preserved. The manually highlighted salient regions
were some of the regions that persist in spite of the
gradual transformations.
The original Scale Saliency method on cartesian
images is robust to similarity transformations, but
these transformations become complex warpings in
the log-polar case. However, despite these unfavor-
able conditions, our proposal exhibits quite stable re-
sults for translations and scale changes. In log-polar
images, rotations are not a big problem considering
the rotational invariant property around the center of
fixation. At uncentered rotations, the information of
image experiments a local content variation keeping
the region shape but turning it somehow different.
This difference is due to the fact that the same infor-
mation is redistributed and thus the information re-
dundancy is changed too. In all cases, however, the
rotated region shows similar entropy values, which
points to the validity of our approach.
With respect to cartesian results, log-polar results
tend to detect bigger regions. Depending on the image
content, these bigger regions might have some mean-
ing (e.g., areas around the face) and this suggests its
use in some applications, such as the classification of
regions in facial features (Shao and Brady, 2006). The
observations above also point to the potential inter-
est of using log-polar images in applications demand-
ing real-time performance: results resemble those ob-
tained with cartesian images, with a significatively re-
duced computational cost.
5 CONCLUSIONS AND
DISCUSSION
In order to obtain entropy-based salient regions on
log-polar images, we have proposed modifications
in the scale selection of the Scale Saliency method
(Kadir and Brady, 2001) to adapt this to space-variant
sampling of log-polar images. We used a dynamic
expression to an adaptive scale selection, considering
the size of receptive fields in each location. We have
also presented an extension of the log-polar image
border that guarantees to detect peripheral saliency.
Results show that Scale Saliency with our adapta-
tions, detects with more precision log-polar salient
forms than without these adaptations. The salient re-
sults show some independence of their positions, in-
cluding those located in peripheral zones (last rings),
which are difficult to detect using only the Scale
Saliency. Compared with cartesian salient results,
log-polar salient results allow a drastic saving of com-
putational resources (Figure 4).
The economy of computational resources of the
log-polar images and the nice results of saliency
detection suggest that this kind of images can be used
in some applications. On the one hand, this saliency
can be used for interest point detectors (Mikolajczyk
et al., 2005) and their applications. However, further
ENTROPY-BASED SALIENCY COMPUTATION IN LOG-POLAR IMAGES
505
t
x
= 20 t
x
= 40
t
x
= 60 t
x
= 80
(a) Translation
s = 1.1 s = 1.2
s = 1.3 s = 1.4
(b) Scale changes
Figure 6: Examples of detection of salient regions in trans-
formed log-polar images, from top to down and left to right
are: (a) gradual translations shifts of 20 pixels x-axis per
step up to 80 and (b) gradual scale changes of 10% per step
up to 140. The log-polar size is 64 × 128 in all cases.
work is required to have invariance properties to
image transformations (in particular to translations)
and achieve a high repeatability. On the other hand,
a similar framework can probably be applied for
saliency computation for visual attention (Itti and
Koch, 2000; Itti, 2003) if the local image descriptor is
enriched to include other visual features (e.g., color,
orientation, or edges).
REFERENCES
Bolduc, M. and Levine, M. D. (1998). A review of biolog-
ically motivated space-variant data reduction models
for robotic vision. In Computer Vision and Image Un-
derstanding (CVIU), volume 69. Elsevier Press.
Itti, L. (2003). Modelling primate visual attention. In In
J. Feng, editor, Computational Neuroscience: A Com-
prehensive Approach. CRC Press.
Itti, L. and Koch, C. (2000). A saliency-based search mech-
anism for overt and covert shifts of visual attention. In
Vision Research, volume 40. Elsevier Press.
Kadir, T. and Brady, M. (2001). Saliency, scale and im-
age description. In Intl. J. of Computer Vision (IJCV),
volume 45.
Manzotti, R., Gasteratos, A., Metta, G., and Sandini, G.
(2001). Disparity estimation on log-polar images and
vergence control. In Comp. Vision and Image Under-
standing (CVIU), volume 83. Academic Press.
Mikolajczyk, K., Tuytelaars, T., Schmid, T., Zisserman, A.,
Mattas, J., Schaffalitzky, F., Kadir, T., and Gool, L. V.
(2005). A comparison of affine region detectors. In
Int. J. Comput. Vision (IJCV), volume 65.
Orabona, F., Metta, G., and Sandini, G. (2005). Object-
based visual attention: a model for a behaving robot.
In In Comp. Vision and Pattern Recognition (CVPR),
San Diego, CA, USA.
Pascual, D., Pla, F., and S
´
anchez, J. S. (2006). Non para-
metric local density-based clustering for multimodal
overlapping distributions. In Lecture Notes in Comp.
Science, volume 4224. Springer Press.
Schwartz, E. L. (1977). Spatial mapping in the primate sen-
sory projection: Analytic structure and relevance to
perception. In Biological Cybernetics, volume 25.
Shao, L. and Brady, M. (2006). Specific object retrieval
based on salient regions. In Journal of the Pattern
Recognition Society, volume 39. Elsevier Press.
Suau, P. and Escolano, F. (2007). Exploiting information
theory for filtering the Kadir scale-saliency detector.
In 3th Iberian Conference on Pattern Recognition and
Image Analysis, LNCS (4478). Springer Press.
Traver, V. J. and Pla, F. (2003). Designing the lattice for log-
polar images. In 11th International Conf. on Discrete
Geometry for Comp. Imagery, LNCS (2886). Springer
Press.
Traver, V. J. and Pla, F. (2005). Similarity motion estimation
and active tracking through spatial domain projections
on log-polar images. In Computer Vision and Image
Understanding (CVIU), volume 97. Elsevier Press.
VISAPP 2008 - International Conference on Computer Vision Theory and Applications
506
