DATA EVALUATION FOR DEPTH CALIBRATION OF A
CUSTOMARY PMD RANGE IMAGING SENSOR CONSIDERING
OBJECTS WITH DIFFERENT ALBEDO
Jochen Radmer
Institut f
¨
ur Werkzeugmaschinen und Fabrikbetrieb (IWF), Technische Universit
¨
at Berlin, Berlin, Germany
Alexander Sabov and J
¨
org Kr
¨
uger
Institut f
¨
ur Produktionsanlagen und Konstruktionstechnik (IPK), Fraunhofer Gesellschaft, Berlin, Germany
Keywords:
Range Imaging Camera, Photo Mixer Device (PMD), Depth Calibration, Albedo, Reflectance Properties.
Abstract:
For various applications, such as object recognition or tracking and especially when the object is partly oc-
cluded or articulated, 3D information is crucial for the robustness of the application. A recently developed
sensor to aquire distance information is based on the Photo Mixer Device (PMD) technique. This article
presents an easy but accurate data acquisition method for data evaluation of a customary sensor. Data evalu-
ation focuses on the detection of the over- and underexposured data under consideration of objects with two
different albedos.
1 INTRODUCTION
Since we are living in a three-dimensional world, for
various applications, such as object recognition or
tracking, 3D information is crucial for the robust-
ness of the application, especially when the object
is partly occluded or articulated. Due to its signifi-
cance, the field of depth data acquisition has attracted
many researchers working on sensors or sensor sys-
tems respectively. A recently developed sensor is
based on the Photo Mixer Device (PMD) technique
which works on modulated, coherent infrared light
using the Time of Flight (ToF) approach and rely on
a technology that correlates reference and received
signals directly on the chip. It was first mentioned
by (Lange, 2000) and (Schwarte, 1999). This sensor
provides direct depth information for a whole image,
for which reason such sensors are called range imag-
ing sensors. Additionally to the depth data the cam-
era provides two other channels. One channel corre-
sponds to the luminance of the scene and the other
channel is the amplitude as it is described in section
(Lange, 2000) and corresponds to the signal strength
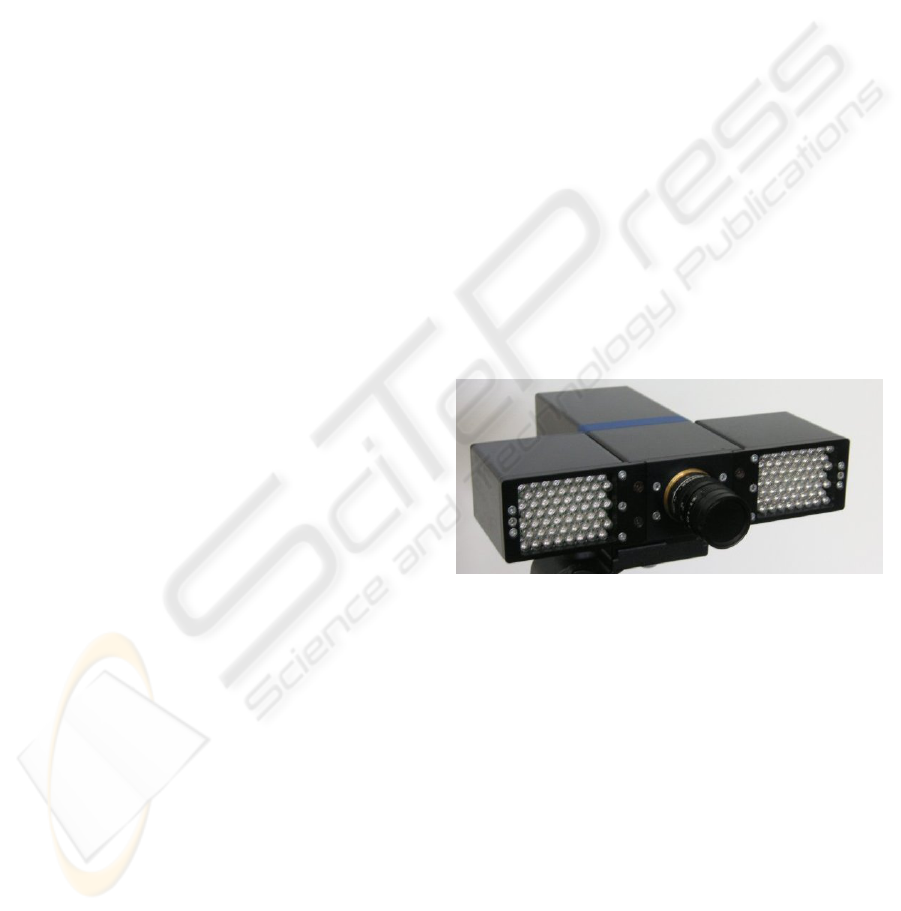
of the incoming signal. The PMD range imaging cam-
era is shown in figure 1 with infrared LED matrices on
both sides of the camera.
Since this sensor is based on a rather new technol-
ogy, data evaluation and depth calibration has to be
Figure 1: This figure shows the examined PMD Range
Imaging Camera of model PMD [vision] 19k with the in-
frared LED matrices on both sides of the camera.
carried out for it. (Lindner and Kolb, 2006) did a lat-
eral and depth calibration on a modified research sen-
sor. In this work the non-linearity of the depth data
was coped by a distance deviation plot. (Kahlmann
et al., 2006) additionally considered the dependency
on the integration time. But since the sensor emits
light for ToF and is dependent on the amount of inci-
dent light, the integration time is not the only param-
eter affecting the depth measurement. It is just one
parameter influencing the amount of incident light.
The incident light can also vary with the infrared re-
flectance properties of the looked at object, the dis-
tance to it and the LEDs properties. Therefore the
data evaluation for the depth calibration has to be car-
169
Radmer J., Sabov A. and Krüger J. (2008).
DATA EVALUATION FOR DEPTH CALIBRATION OF A CUSTOMARY PMD RANGE IMAGING SENSOR CONSIDERING OBJECTS WITH DIFFERENT
ALBEDO.
In Proceedings of the Third International Conference on Computer Vision Theory and Applications, pages 169-173
DOI: 10.5220/0001076701690173
Copyright
c
SciTePress
ried out considering the amount of incident light. In
addition, in order to guarantee a certain exactitude
of the data, over and underexposed data has to be
identified. For this reason this paper focuses on data
evaluation and improvement considering different re-
flectance properties in combination with the distance
and the integration time for a customary sensor. On
account of the fact that the reflectance properties of
an object vary greatly with its material and orienta-
tion, the measurement will be simplified. Instead of
the reflectivity we will rather consider different albe-
dos. Albedo is a unitless measure indicative of an ob-
ject’s diffuse reflectance properties. Nevertheless, a
comprehensive investigation has to be done for many
reflectance properties so that this work can be seen
as some starting point. Thus, the main contribution
of this paper is the analysis of the data provided by
the PMD range camera under consideration of objects
with different albedos and to give method for distance
measuring improvement.
The distance measuring methods used be the PMD
range imaging camera is the Time of Flight (ToF)
method. The article of (Lange, 2000) offers a de-
tailed description of the functional way of the PMD
range imaging camera. A short overview of the dis-
tance calculation can be found in (Sabov and Kruger,
2007).
The paper is structured as follows. First the data
acquisition and data evaluation is described. The ba-
sic methods for the improvement of the data are given.
Within section three results are presented and dis-
cussed and finally this article is concluded in section
five.
2 DATA EVALUATION
2.1 Data Acquisition Method
For the data evaluation fixed targets were considered,
a black and a white wall, with diffuse, Lambertian re-
flectance model like characteristics. We have selected
a white and a black wall as objects because of their
contrariness in their albedo.
The measuring setup for the data acquisition ex-
isted of the PMD range camera, two lasers to distance
measuring instruments (range finder), a camera con-
struction to arm the distance measuring instruments
on the PMD range camera, two markers, a tripod and
the object, the wall. The measurement range of the
distance measuring instrument was 0.2m to 30m me-
ter with an accuracy of ±2.0mm. Those range finders
were aimed at the ends of the camera construction in
parallel in the direction of the camera. With every
Figure 2: This figure shows the measurement setup as de-
scribed in the text.
measurement the camera was aimed with both dis-
tance measuring instruments showing the same dis-
tance. The distance measured by both instruments
was taken as the nominal distance to the object. In
addition, the laser points of the distance measuring in-
struments were directed upon two marks on the wall
to verify the parallelism of the distance measuring in-
struments. The base distance b between the marks on
the wall as well as the distance between both range
finders is identical. To guarantee the orientation of
the camera also in vertical direction, the marks were
appropriated by the same height like the range finders.
The base distance b can be seen in the figure 2, which
shows the whole measurement setup. The parallelism
and the same distances measured by the instruments
guaranteed the horizontal orientation α of the cam-
era towards the wall to be perpendicular. This is done
to reduce perspective influence on the measurement.
Based on this measuring setup and with the base dis-
tance b = 0.4m the maximum angle error ∆α
max
of
the adjustment of the camera arises to ∆α
max
≈ 0.6
◦
using the following equation:
∆α
max
= arctan
|∆d
1
| + |∆d
2
|
b
= arctan
0.004m
0.4m
(1)
This assumes that the wall is plane and arming of the
range finders was performed in a precise way. The
maximum distance error ∆d
max
can be calculated re-
garding the direction of the distances with equation 2.
The maximum ∆d
max
then arises to ±2.0mm.
∆d
max
=
∆d
1
+ ∆d
2
2
(2)
The measurement was carried out in different dis-
tances of the camera to the wall in intervals between
the single measurements of 0.1m. The measurement
was applied about the whole measuring space of the
camera. Ten measurements were carried out in every
measuring distance and in each case the local neigh-
borhood of the centre was captured to get more sta-
ble data. The centre was determined before by the
determination of the intrinsic parameters. This lat-
eral calibration was done using the method described
VISAPP 2008 - International Conference on Computer Vision Theory and Applications
170
in (Bouguet, 1999). The measurements per measur-
ing distance were performed for different integration
times. The span of the used integration times reached
from 500µs to 20000µs which were gone through in
500µs steps.
(Kahlmann et al., 2006) showed that the sensor
’SwissRanger’ heats up self-induced and that this af-
fects the captured data. This process stabilizes a few
minutes after having started the data acquisition. To
avoid these effects of self-induced heating, the data
acquisition for the data evaluation was started after
20 minutes of sensor run-time.
Although the distance measurement accuracy vary
over the sensor and every measuring point must be
considered individually for improvement (Kahlmann
et al., 2006), in this work only the central measuring
points are considered, because the focus on the dis-
tance data improvement lies in relation for the inte-
gration time, the nominal distance and the albedo of
the objects.
2.2 Distance Measurement, Amplitude
and Object Albedo
In this section distance measuring results regarding
integration time and nominal distance are considered.
First it is looked at the measuring results without vary-
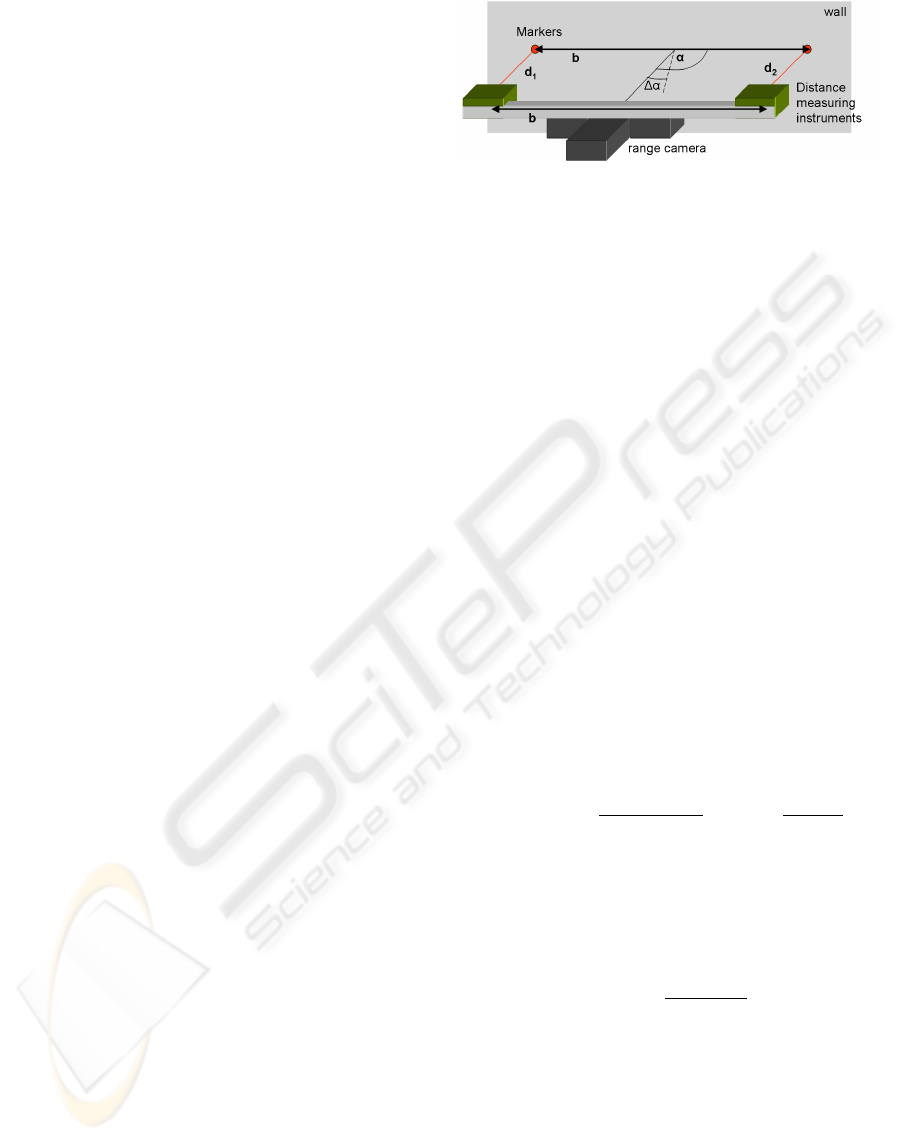
ing the albedo of the object. In figure 3 the deviation
of the measured to the nominal distance for a white
wall can be seen. The deviations are applied for in-
tegration time and nominal distance. As can be seen
clearly, low integration times and high nominal dis-
tances result in erroneous distance measurements. In
this connection must be mentioned that the low inte-
gration times which yield erroneous distance measur-
ing values play only one very low role in the practi-
cal use of the sensor. The same can be ascertained
for long integration times in combination with low
nominal distances. Since distance measurements with
under- and overexposure do not include any useful in-
formation, these distances have to be detected first be-
fore improving the distance data.
In the area in which the measured distances de-
viate only slightly from the nominal ones a period-
ical dependence of the distance offset can be ascer-
tained to the nominal distance. This periodic error
in the depth measurement agrees with mathematical
predictions due to the shape of the correlation func-
tion of the reference and the received signals. Be-
side this periodical dependence the distance measur-
ing error increases with an enlargement of the integra-
tion time. The error measured for different integration
times tending downwards has a range of about 50mm
up from 2m nominal distances. For closer distances
Figure 3: This figure shows the absolute deviation of nomi-
nal to measured distances in meter regarding the integration
times in µs10
4
and nominal distance in meter. A white wall
with diffuse, Lambertian reflectance model like characteris-
tics had been considered as object.
Figure 4: This figure shows the amplitude of the signal used
for distance determination regarding the integration times in
µs and nominal distance in meter. A white wall was used as
object.
the error introduced by the near field effect caused
by different ToF from the left and the right LED ar-
rays dominates over the error introduced by the anhar-
monic signals. For these areas which can be described
about integration time and nominal distance a correc-
tion can be achieved about Look-up-tables (LUT). Ac-
cording to (Kahlmann et al., 2006) these LUT’s have
to contain an individual offset for each data point. A
better knowledge of the received LED and the refer-
ence signal likely would provide a more robust ba-
sis for depth calibration. However, with the practi-
cal application of the sensor the nominal distance is
unknown. Hence, we take into consideration for the
detection of the useless distance values, in addition,
the amplitude Ampl. In figure 4 the accompanying
Ampl is shown. Likewise with regard to the integra-
tion time and the nominal distance. A connection can
be noticed between distance measuring error and the
accompanying Ampl. Through a simple threshold the
underexposed data can be identified, when Ampl falls
below a certain threshold.
The area in which on account of low nominal dis-
tance, high reflectance property and long integration
time it comes to an overexposure cannot be detected
simply about a threshold. In this case the standard
DATA EVALUATION FOR DEPTH CALIBRATION OF A CUSTOMARY PMD RANGE IMAGING SENSOR
CONSIDERING OBJECTS WITH DIFFERENT ALBEDO
171
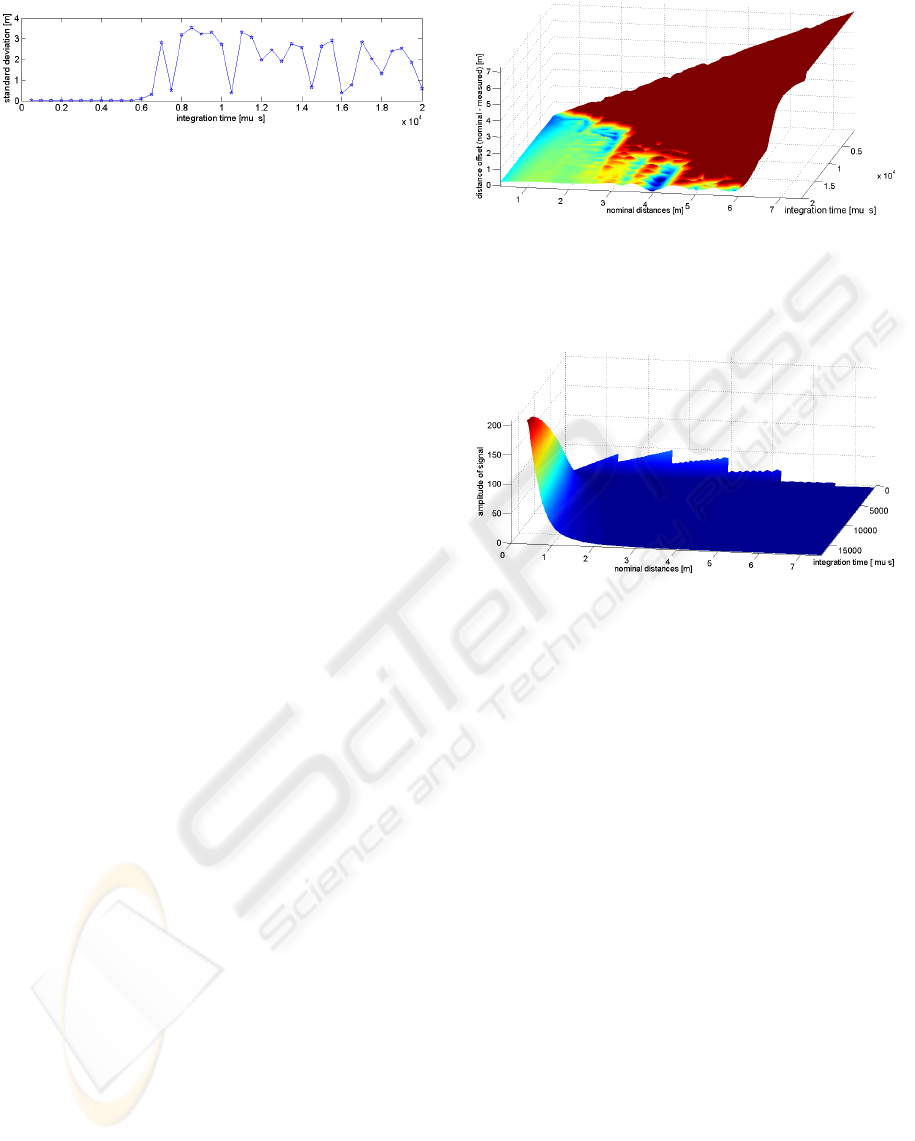
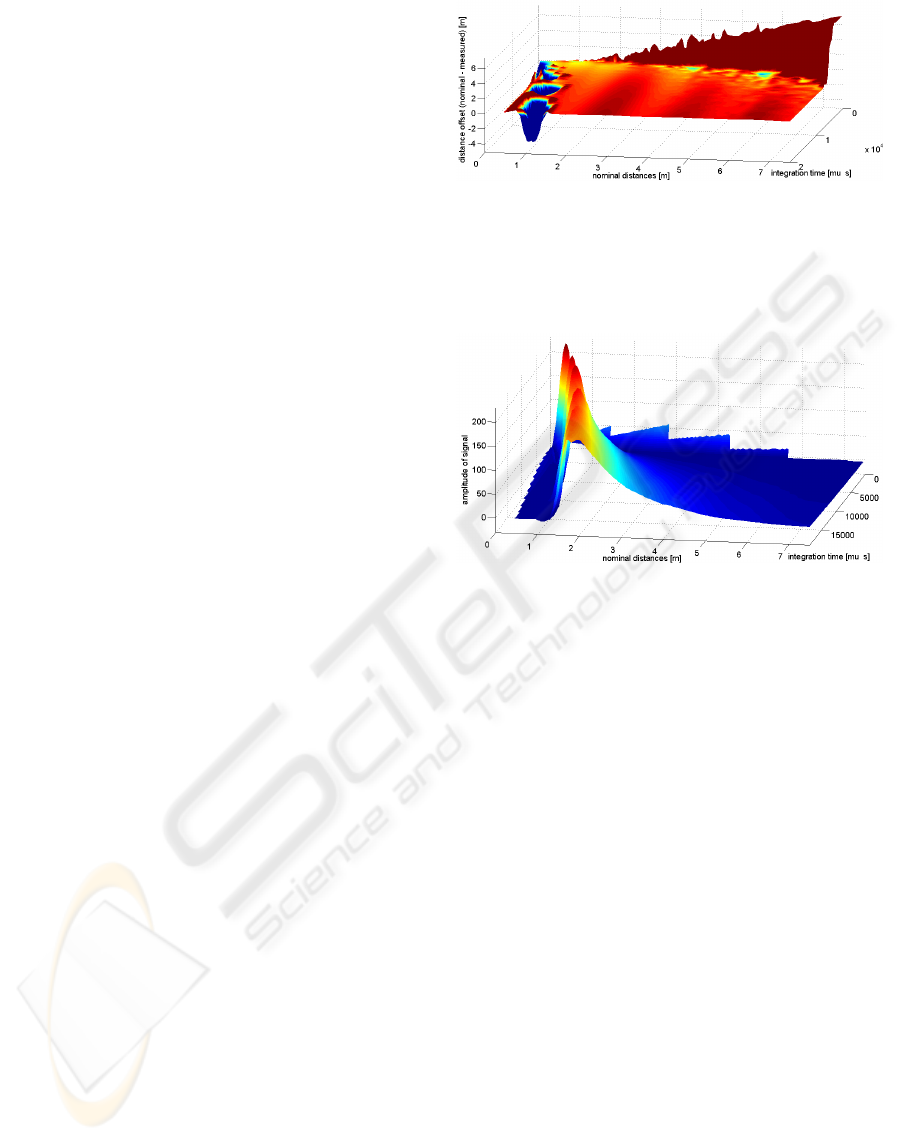
Figure 5: This figure shows the standard deviation in meter
regarding the integration times in µs10
4
. A white wall was
considered as object with a nominal distance of 0.9m. It
can be noticed that the standard deviation can be used for
the detection of overexposure.
deviation of the distance is considered giving a direct
quality measurement for the measured distances. Ex-
emplary the standard deviation for the distance mea-
surement at a nominal distance of 0.9m is shown in
figure 5. It was computed out of ten measured dis-
tances. The nominal distance of 0.9m was selected
because it yields correctable distance values at short
integration times and arbitrary distance values at long
ones, which are not correctable (cp. figure 3). Fig-
ure 5 shows that the standard deviation is high when
an overexposure occurs and low instead. Therefore
the standard deviation of measured distances can be
used for the detection of overexposure. It can be seen
that the standard deviation in spite of the very small
number of ten samples being used for the calculation
achieves a high discriminatory power. Comparable
results can be achieved by calculating the standard
deviation of the local neighborhood and therefore us-
ing a spatial instead of a temporal window. A spa-
tiotemporal consideration is not necessary because of
the high discriminatory power of one approach.
By the detection of over- and underexposure useless
measured distances can be neglected. The remaining
measured distances then can be corrected by a LUT,
which is based upon the nominal to measured distance
measurements.
In the following the measuring results are exam-
ined under consideration of a different albedo of the
object. For measurements with a black wall as object
the distance offset can be seen in figure 6. Of course
these measurements also show areas with erroneous
measured distances due to underexposure, since the
albedo of a black wall is lower than the one of a white
wall. The recently described method for the detection
of measured distance in case of over- or underexpo-
sure show good results also with this object, when
using the same global thresholds. The periodicity
has the same period length over the nominal distance.
This is due to the shape of the correlation function
of the reference and the received signals, which does
not change. But in comparison to the measurements
with the white wall, a bigger distance offset can be
Figure 6: This figure shows the absolute deviation of nomi-
nal to measured distances in meter regarding the integration
times in µs10
4
and nominal distance in meter. A black wall
was used as object.
Figure 7: This figure shows the amplitude of the signal used
for distance determination regarding the integration times in
µs and nominal distance in meter. A black wall was used as
object.
noticed. Therefore the albedo must be identified for
the improvement of the distance measuring data.
Since the range camera works with a globally set in-
tegration time, the method for the improvement of the
data needs to take into consideration the amount of
incident light. That can be achieved by directly con-
sidering Ampl. Figure 7 shows Ampl of the measure-
ments with the black wall. Results for the identifi-
cation of the albedo with a case-based measured dis-
tance improvement are presented in the next section.
3 RESULTS
In this section the results of the work are presented,
meaning that the identification of the albedo with a
case-based distance value improvement are presented
for a black and white wall. In figure 8 is shown on the
left side the distance offset in meter and on the right
side the according amplitude Ampl at central data
points along a central column. The left side shows
the black wall and the right side the white wall show-
VISAPP 2008 - International Conference on Computer Vision Theory and Applications
172
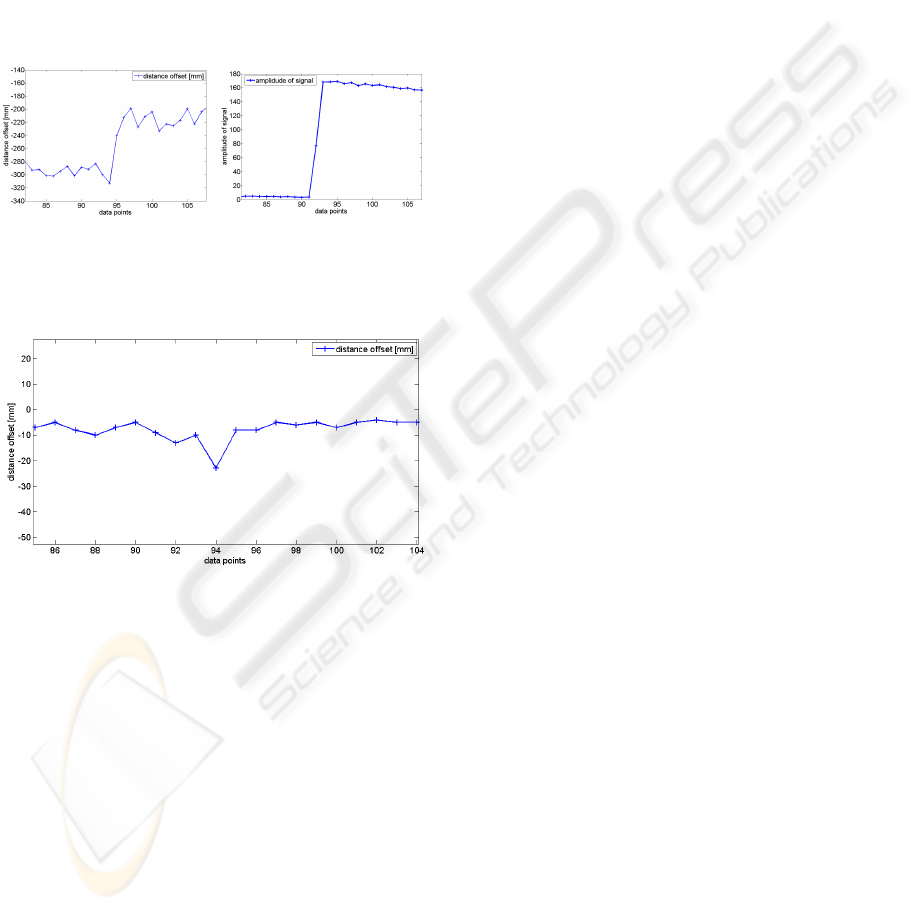
ing a lower distance measuring error. The crossover
between black and white can be seen clearly. The re-
sult after applying the LUT’s for black and white on
the distance measurement data is shown in figure 9
showing the distance offset in meter. It can be noticed
that the distance offsets were decreased significantly
from up to 0.3m down to about 0.02m. The difference
of the distance offset between the white and the black
wall was nearly completely eliminated. At data points
where the different albedo contact a bigger distance
offset can be noticed. This is caused by the interme-
diate values for which no LUT exist.
Figure 8: In the left figure the distance offset in meter and
on the right side the according amplitude Ampl at central
data points along a central column is shown. The crossover
between the two albedos can be seen clearly.
Figure 9: This figure shows the distance offset in meter af-
ter applying the LUT’s for black and white on the distance
measurement data. The distance offsets were decreased
from up to 0.3m down to about 0.02m. The difference be-
tween the offset was nearly completely eliminated. At the
crossover a bigger distance offset can be noticed. This is
caused by the intermediate values for which no LUT exist.
4 CONCLUSIONS
This article presents an easy but accurate data acquisi-
tion method for data evaluation of a customary sensor.
Data evaluation focuses on the detection of the over-
and underexposed data under consideration of objects
with two different albedos. This improves the exacti-
tude of the data for the study of the systematic errors
of this sensor. Therefore the work of this article can
be seen as an intermediate result on the way to a PMD
range imaging sensor calibration. We showed that
the object’s reflectance properties affects the distance
measuring. Therefore we proposed a basic method for
the identification of the albedo of the considered ob-
jects so that an albedo according LUT can be applied
for the correction. These LUT’s have to be created for
a set of reference objects with different albedos. The
example in the previous section shows that a correc-
tion can be achieved about LUT’s. Because of their
contrariness in their albedos, we selected a white and
a black wall as objects. A statement about the be-
haviour of the sensor can thereby be done only for
those extreme albedos. Apart from these albedos a
statement cannot occur for general reflectance proper-
ties. Further work has to be done in the field of inter-
polation between LUT’s when unknown albedos are
detected and how to handle crossovers between dif-
ferent albedo. Additionally, objects which reflectance
properties cannot be described by a Lambertian re-
flectance model need to be investigated.
REFERENCES
Bouguet, J. (1999). Visual methods for three-dimensional
modeling. PhD thesis, California Institute of Technol-
ogy.
Kahlmann, T., Remondino, F., and Ingensand, H. (2006).
Calibration for increased accuracy of the range imag-
ing camera swissranger. In International Archives of
Photogrammetry, Remote Sensing and Spatial Infor-
mation Sciences, ISPRS Commission V Symposium,
volume XXXVI, pages 136–141.
Lange, R. (2000). 3D Time-of-Flight Distance Mea-
surement with Custom Solid-State Image Sensors in
CMOS/CCD-Technology. PhD thesis, University
Siegen.
Lindner, M. and Kolb, A. (2006). Lateral and depth calibra-
tion of pmd-distance sensors. In ISVC (2)- Advances
in Visual Computing, Second International Sympo-
sium, volume 4292 of Lecture Notes in Computer Sci-
ence, pages 524–533. Springer Verlag.
Sabov, A. and Kruger, J. (2007). Improving the data quality
of pmd-based 3d cameras. In Proc. Vision, Modeling
and Visualization (VMV).
Schwarte, R. (1999). Handbook of Computer Vision and
Applications, chapter Principles of 3-D Imaging Tech-
niques. Academic Press.
DATA EVALUATION FOR DEPTH CALIBRATION OF A CUSTOMARY PMD RANGE IMAGING SENSOR
CONSIDERING OBJECTS WITH DIFFERENT ALBEDO
173
