
INTRODUCING 3D VISION AND COMPUTER GRAPHICS TO
ARCHAEOLOGICAL WORKFLOW
An Applicable Framework
Hubert Mara
PIN - Servizi Didattici e Scientifici per l’Universit`a di Firenze, VAST-Labratory, Piazza Ciardi 25, 59100 Prato, Italy
Andreas Monitzer
Vienna University of Technology, Institute of Computer Graphics and Algorithms
Favoritenstrasse 9/186, 1040 Vienna, Austria
Julian St¨ottinger
Vienna University of Technology, Institute for Computer Aided Automation
Pattern Recognition and Image Processing Group, Favoritenstr 9/183-2, 1040 Vienna, Austria
Keywords:
3D Computer Vision, Bi-Directional Reflectance Distribution Function (BRDF), Rotational Axis, Cultural
Heritage, Archaeology.
Abstract:
Cataloging drawings of ancient vessels and sherds is still the most time consuming task in the typical archae-
ological workflow. The properties of these findings like profile, volume, and wall thickness have always been
estimated and drawn by hand. Through archiving, classifying and exhibiting these ancient artifacts we wish
to gather as precise information as possible. Within seconds, today’s 3D-scanners provide surface meshes of
ancient vessels which are more precise than any manual estimation which may take up to several hours.
We propose a semi-automated, applicable framework for dealing with large 3D-meshes of ancient findings
from scanning the vessels for publication. In this interactive environment we estimate the axis of vessels,
estimate their profile lines and render real time visualizations using state-of-the-art 3D-hardware techniques.
The results can be printed in their real size for direct use in archaeological literature. Further, these methods
will give the ability to publish 3D-meshes of ancient vessels for archaeological research.
Recent extended tests have been carried out on archaeological sites in Peru and Austria. These experiments
showed under real life circumstances the improvement of using this system in both precision and time effi-
ciency.
1 INTRODUCTION
Motivated by the requirments of archaeologists we
are developing a system for automated documentation
of their finds. Beside (large) remains of architecture
the most common finds on archaeological excavations
are (small) objects of the daily live. These small ob-
jects are typically tens of thousands of fragments of
ceramics (sherds), because ceramics have been used
and preserved for thousands of years. Therefore doc-
mentation of sherds is one of the important tasks
for archaeology, because sherds represent information
about population movements, inter-regional contacts,
production context, and technical or functional con-
straints (archaeometry (Leute, 1987)).
Until present day documentation is done by man-
ually drawing a horizontal cross- section of the ori-
entated sherds and a side-view of the ceramic. The
horizontal cross-section is called profile (line). Fur-
thermore the profile line is also the longest elongation
around the wall of a ceramic. Therefore it is estimated
the maximum height of a ceramic. An example for
such a manual drawing is shown in Figure 1. While
the right-hand-side of this Figure shows the Profile,
the left-hand-side shows a front view of the sherd as
it would appear without any traces of wear, dirt or any
other dis-coloration of long-time-storage.
Therefore we have identified two major tasks to
305
Mara H., Monitzer A. and Stöttinger J. (2008).
INTRODUCING 3D VISION AND COMPUTER GRAPHICS TO ARCHAEOLOGICAL WORKFLOW - An Applicable Framework.
In Proceedings of the Third International Conference on Computer Vision Theory and Applications, pages 305-312
DOI: 10.5220/0001082603050312
Copyright
c
SciTePress
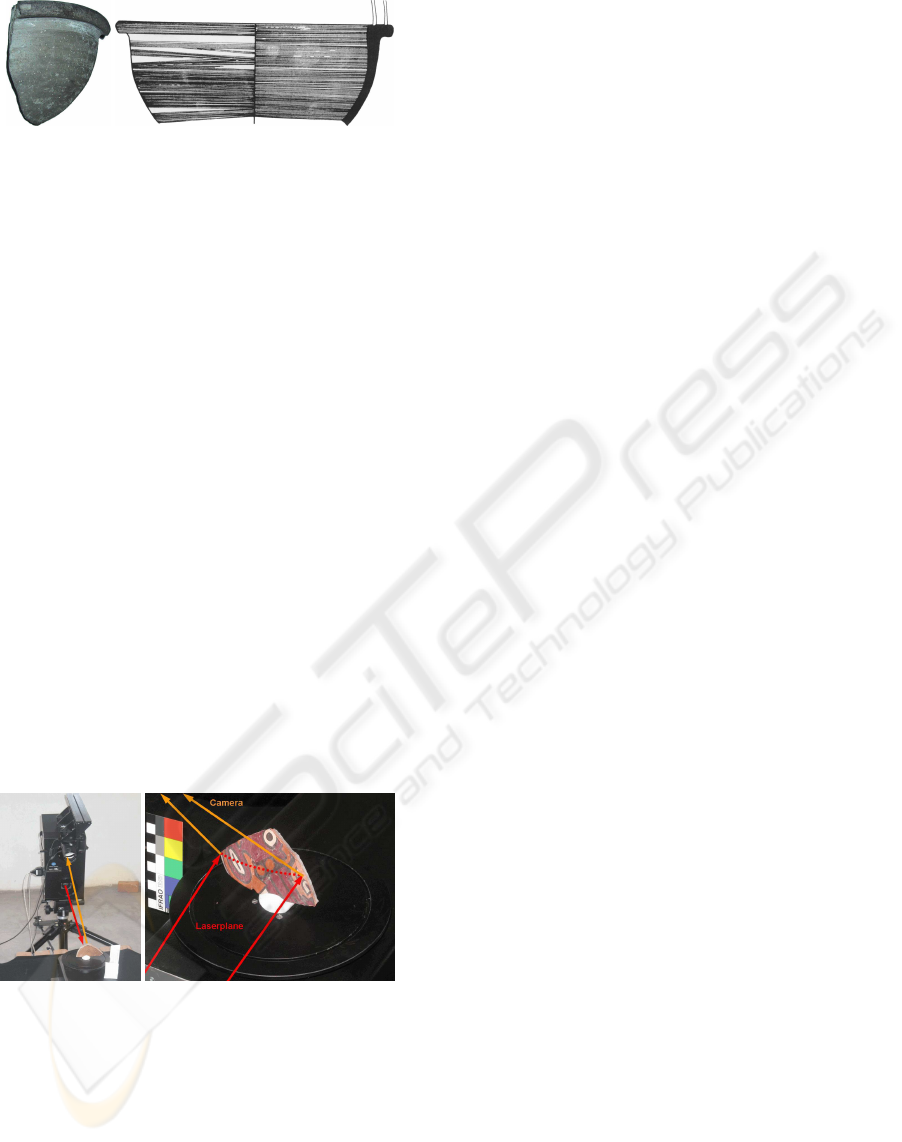
(a) (b)
Figure 1: (a) Photo of a real sherd and (b) its manual draw-
ing showing the profile line.
be performed after 3D-acquisition of ceramics shown
in the next Section. The first task is the estimation of
the profile line shown in Section 3. Then we show
a method for rendering the surface of acquired 3D-
models adopted for archaeological publication in Sec-
tion 4. In Section 5 we show results of our experi-
ments applied to synthetic and real objects of excava-
tions in Peru and Austria. Finally a conclusion and an
outlook is given in Section 6.
2 DATA ACQUISITION
Depending on the skills of a craftsperson a manual
drawing as shown in Figure 1 is done in 10 to 15 min-
utes for simple sherds. Regarding the vast numbers
of sherds a large amount of working time on an ex-
cavation is spent on manual drawings. Therefore we
are developing an automated system for acquisition of
sherds and estimation of the profile-line. The acquisi-
tion is done by using a 3D-Scanner based on the prin-
ciple of structured light (Cosmas et al., 2001) using a
Konica-Minolta Vi-900 or Vi-9i shown in Figure 2.
(a) (b)
Figure 2: In-situ setup of the 3D-scanner (a) consisting of a
Laser, a CCD camera and a rotational plate for acquisiton of
(b) e.g. a NASCA sherd found in the Valley of Palpa, Peru.
The rotational plate shown in Figure 2 is typically
used for acquisition of unbroken ceramics for auto-
mated registration using ICP (Besl and McKay, 1992;
Chen and Medioni, 1992; Rusinkiewicz and Levoy,
2001). In case of sherds, plates and other small ob-
jects either a model based approach (Kampel and Sab-
latnig, 2003) or a well defined frame (Mara, 2006)
also acting as holding device can be used. Further-
more this frame is used to increase the performance
of our system by acquiring severall sherds at once,
as the 3D-Scanner requires fixed amounts of volume.
Background objects and noise are removed either us-
ing their color (black/white) or by their size and/or
location (Mara, 2006).
For testing the Profile estimation in the next sec-
tion and for further interdisciplinary research to an-
swer further archaeological questions we acquired
severall hundred unbroken vessels and sherds in Aus-
tria (Lettner et al., 2006; Mara et al., 2007) and
Peru (Mara and Sablatnig, 2007).
3 ORIENTATION & PROFILE
ESTIMATION
Regardless if we are using a digital or manual sys-
tem, the orientation of a sherd is the essential part of
the estimation of the profile line as every further anal-
ysis (Leute, 1987) relies on it. Therefore this section
shows how orientation is carried out by the estimation
of the axis of rotation.
The oldest and most popular approach to orienta-
tion is the manual method used by archaeologists for
several decades. This manual approach is based on
the production process of ceramics, because ceram-
ics have been produced on potters wheels (rotational
plates) for thousands of years. Therefore ceramics
have a axis of rotation, which is also called the axis
of symmetry. This axis of rotation is also present for
fragments of ceramics (sherds). Our method is in-
spired by a variation of the manual orientation, which
is related to (Melero et al., 2003), because we also use
the fitting of circle templates for the estimation of the
axis. In contrast to (Melero et al., 2003) our method
can be carried out both semi-automatically and auto-
matically. Other related methods are (Willis, 2004)
and (Orriols, 2004), which focus more on reconstruc-
tion of a complete, but broken object than on orienta-
tion of single fragments. Fitting of circle templates is
done similiar to the manual method of archaeolgists.
Therefore circles are fit into the inside of a sherd un-
til the circle templates are concentric and their cen-
ters are aligned along the axis of rotation. This is
achieved by fitting circle templates into the intersec-
tion between the sherd and sets of parallel planes. Fig-
ure 3a shows such circle templates and other tools to
orient a sherd. Figure 3b shows a Profilkamm which
is used to transfer the profile line to paper.
For the semi-automatic method these planes are
aligned parallel to the XY-plane. The sherds have
to be in upright position with an angular error less
VISAPP 2008 - International Conference on Computer Vision Theory and Applications
306

(a) (b)
Figure 3: Tools for drawing a profile line: (a) pens, scale
paper, lead-wire, ruler and sliding calliper, (b) Profilkamm.
than 20°towards and sidewards of the axis of rota-
tion. The distance (radii) towards the axis of rotation
is then estimated automatically. For the fully auto-
mated estimation of the axis the upright position is
found in two stages: The first stage is the fitting of
circles into intersections of sets of parallel planes or-
thogonal to the balancing plane of the inner side of
the sherd. The normal vectors of the set of parallel
planes having a minimum deviation of circle centers
are aligned within the plane of symmetry. Figure 5
shows the inner side of a sherd with parallel intersec-
tions and a hypothesis for the axis of rotation (nor-
mal vector of the parallel planes). In the second stage
this set of planes is rotated around the normal vector
of the plane of symmetry until the minimum point of
the deviation of the circle centers is found. The nor-
mal vector of the planes having this minimum point is
used to transform the sherd into the upright position
for the final estimation of the axis, which is identical
to the axis estimation of the semi-automatic method.
As all these methods typically exist as matlab pro-
totypes, which requires a license and computer ex-
pert skills for handling, we decided to implement
the estimation of the profile line using open source
technologies. Therefore we choose to implement our
methods using Qt© (Trademark of Trolltech in Nor-
way and other countries), which allows us to provide
our framework for all actual major operating systems.
Figure 5 shows a screenshot of our framework called
ArchiCut. The next section shows how we achive a
surface based rendering typically used together with
the profile line within archaeological publications.
4 RENDERING CERAMICS FOR
ARCHAEOLOGICAL
DOCUMENTATION
Having the profile-line automatically estimated as
shown in the previous section, we achived to render
the most important part for archaeological documen-
tation of ceramics. Considering Figure 3b we have
seen that archaeolgists add another important infor-
mation about the ceramics: a side- view of the ce-
ramic showing its surface, which is as important as
the shape of the profile line, because the roughness
and color of the surface leads to the manufacturing
process and the ingridients of the clay.
Having a digital camera as part of the 3D-Scanner
it is possible to acquire a still image or render the
3D-Modell with the texture acquired by the camera
for the side-view of a ceramic. As simple this solu-
tion is for well-preserved finds - as unpracticable it is
for archaeological documentation for the majority of
sherds, because they are in general partially or com-
pletly discolored due to erosion. Therefore archae-
ologist generally favor a drawing over a still image
or a photo-realistic rendering, because the drawings
has a certain amount of abstraction showing the ob-
ject with its original color. Furthermore, not every
3D-Scanner includes a camera capable of acquiring
texture in color.
Therefore we require a simple and versatile con-
cept to render the surface which does not include the
colour information provided by some 3D scanners.
It has to be simple, because having no texture re-
quires a manual adjustment of reflectance parameters
as templates for different ceramic surfaces. This has
to be done by an archaeologist in an fast and intu-
itive way. Versatility is required, because we may
also take into account the use of the na¨ıve approach
of measuring the reflectance of an existing material
using a spectrometer and a robotic arm-setup that al-
lows to freely move a spotlight and the spectrometer
around the sample, and store them in an matrix. Such
a device is called a ”gonioreflectometer” (Foo, 1997).
Even by such a na¨ıve approach storing the reflectance
parameters in very limited space, while still giving an
adequate appearance of many materials, such as vel-
vet or lacquer can be achieved.
Suitable approaches to our problem, not limited
to a certain domain are: The mathematical approach
using a separable decomposition (Kautz and Mc-
Cool, 1999), the phenomenological approach using
the Lafortune BRDF (Lafortune et al., 1997) and the
physically-based approach using the Cook-Torrance
reflectance model (Torrance and Sparrow, 1967). An
example for a limited domain is the Binn-Phong re-
flection, which is only used for rendering metals.
The rendering of the 3D data was supposed to
take advantage of current graphics cards and to run
predominantly on these dedicated graphics processors
(GPUs). Because it could be done with minimal mod-
ifications to the prior source code and it is supported
by all current hardware we choose to use the Graph-
INTRODUCING 3D VISION AND COMPUTER GRAPHICS TO ARCHAEOLOGICAL WORKFLOW - An Applicable
Framework
307
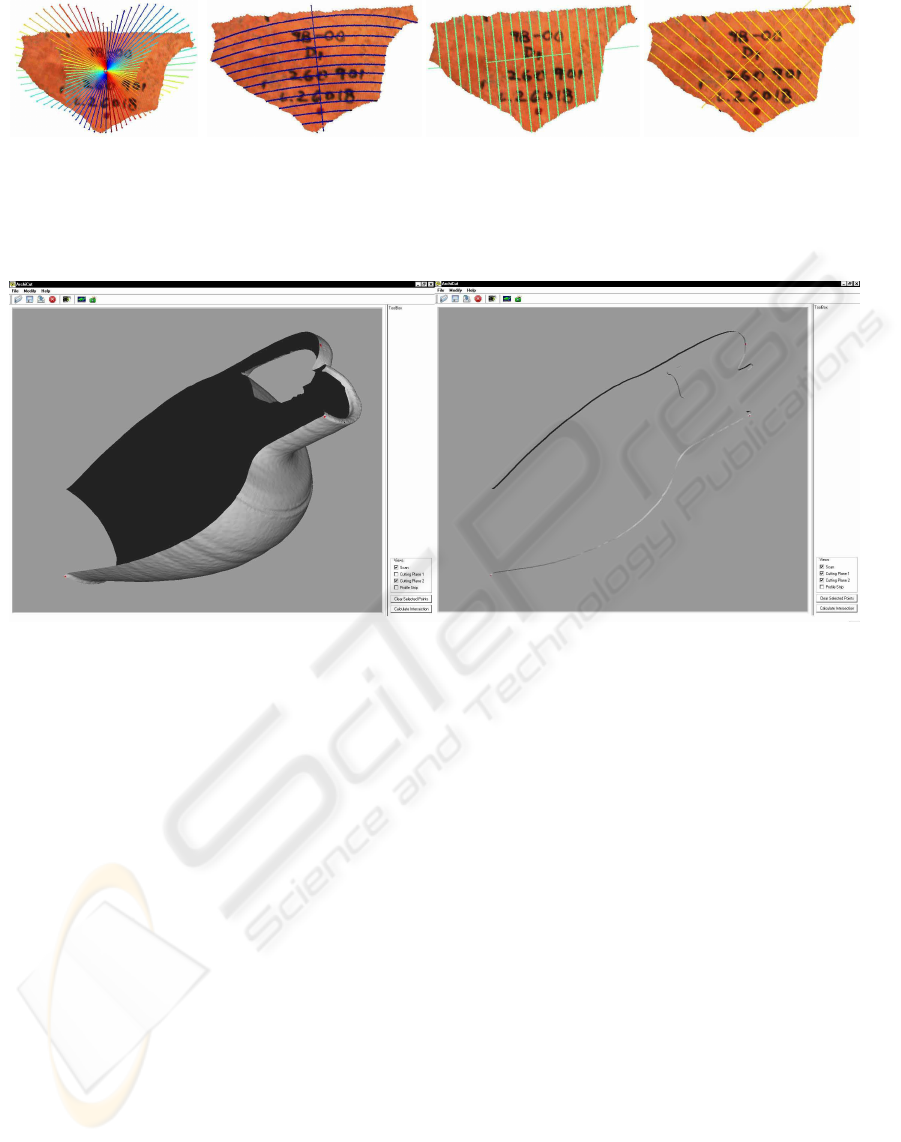
(a) (b) (c) (d)
Figure 4: (a) Axes used for the first estimation of the rotational axis. These axes are defined by the masspoint and the
balancing plane. (b) First Axis from (a) defined by the first eigen-vector of the balancing plane. (c) Axis defined by the
second eigen-vector of the balancing plane. (d) Axis from (a) defined by the about 130° rotated first eigen-vector of the
balancing plane.
Figure 5: Screenshots ArchiCut - Left: Ceramics intersected through rotational axis. Right: Estimated Profile Line.
ics Library Shading Language (GLSL) programming
language which is built into OpenGL 2.0. Taking
this into account, we chose to include the Lafor-
tune Bi-Directional Reflectance Distribution Function
(BRDF) to our existing system done purely in GLSL.
Shaders were added to graphics cards, because the
previous static rendering model (now called fixed-
function pipeline) became more and more complex
with each revision, in order to add rendering fea-
tures like shadows or shading models. These features
were implemented using a proprietary vendor-specific
bytecode language. In order to allow more freedom
to the graphics programmer, an open specification for
shaders was created, extending the flexibility of the
graphics card.
In the beginning, these shaders did not allow loops
or conditions, since the graphics processor is a spe-
cialized stream-based processor, which allows it to
be much faster at tasks that can be mapped to these
constraints, compared to generic central processing
units used in desktop computers. Beginning in shader
model 3, loops and conditions were added at a great
speed penalty.
4.1 Programming Shaders
GLSL (Shreiner et al., 2006) is designed in a similar
way to all other high level shading languages avail-
able – namely, Microsoft’s High Level Shader Lan-
guage (HLSL) (Gray, 2003) and NVIDIA’s Cg (Fer-
nando and Kilgard, 2003). It is based on the C pro-
gramming language, allowing software developers to
leverage existing knowledge about it.
Shaders in the shader model 3 are are structured
into two separate parts, a vertex shader and a fragment
shader.
1. A vertex shader is responsible for transforming
the vertices of the triangles sent to the GPU from
the world space to the view space. It can move
vertices, but it cannot add or drop them. Its main
function is run once per vertex.
2. A fragment shader is responsible for defining the
color of a fragment after the rasterization step.
A fragment (in respect to the shader) can be de-
scribed as a “potential pixel” on the screen. It
might get culled after the shader is run, but if that
doesn’t happen, it is directly written to a pixel in
the frame buffer. This allows using arbitrary shad-
VISAPP 2008 - International Conference on Computer Vision Theory and Applications
308

ing, and is the location where the Lafortune BRDF
used in this paper has to be implemented. It is run
once per fragment, so it is important to keep this
shader as simple as possible.
4.2 The Lafortune Shader
(Lafortune et al., 1997) demonstrates that an even ap-
proach simpler than (Kautz and McCool, 1999) can be
used to adequately approximate a BRDF. Basically a
BRDF reflectance function is a combination of mul-
tiple so-called “Phong Lobes” – or vice versa: The
representation known as Phong reflection model is ac-
tually a simple but limited BRDF. Mathematically, the
reflectance function can be represented as
L
o
(
ˆ
ω
o
,
ˆ
ω
i
) = ρ
d
+
∑
M
i=1
ρ
s,i
·
ω
o,x
ω
o,y
ω
o,z
T
·
C
x
C
y
C
z
·
ω
i,x
ω
i,y
ω
i,z
n
where ρ
d
is the diffuse reflectance (texture), M is
the number of Phong Lobes, and ρ
s,i
, C
x
, C
y
, C
z
, n de-
scribe the Lobe shape. So, considering that ρ rep-
resents colored information, the amount of memory
required is M ∗ 7 + 3 per surface. This small require-
ment enables storing a separate BRDF for each UV-
coordinate of the object (using two additional tex-
tures per lobe). The results of this technique named
“Spatial BRDF” (SBRDF) is demonstrated in images
available on
http://sbrdf.cs.unc.edu
(McAllis-
ter, 2004) (checked 26.Sept., 2007), where more in-
formation is also presented.
The lobe shape described by C
x
, C
y
, C
z
and n
can be interpreted as follows: The C-parameters de-
fine the location of the reflection peak using a three-
dimensional vector. n describes the spread of the
highlight created by this lobe. Usually, only up to
three lobes are necessary for visually pleasing result.
The ray tracer “pbrt” described in (Pharr and
Humphreys, 2004) also implements the Lafor-
tune BRDF (non-spatially). However, it allows spec-
ifying one BRDF per primary color, allowing a more
realistic reflectance behavior, for the price of tripling
the storage requirements. (Marschner et al., 1999) de-
scribes how to create primary-color-separatedBRDFs
by using a laserline scanner and a video camera.
The pseudocode used for calculating a fragment’s
color is shown in Listing 1. The algorithm’s complex-
ity is O(n· m), where n is the number of lights and m
is the number of lobes.
Note that the implementation calculates the BRDF
for the three primary colors separately, in order to fur-
ther enhance realism and be able to integrate the ex-
ample materials used in (Pharr and Humphreys, 2004)
(not shown in the pseudo code).
Listing 1: Pseudocode for the fragment shader.
void main ( ) {
normalize normal v e c t o r
c a l c u l a t e and normalize view v e ct o r . . .
based on t he normal v e c t o r and . . .
the p o s i t i o n of the fragment in . . .
world space
fragment color = base color of the . . .
fragment der ived from the vertex color
for every l i g h t {
l i g h t d i r e c t i o n = normalized . . .
l i g h t po s i t i o n
add d i f f u s e color t o fragment color
/ / d i f f u s e = l i g h t c o l o r
*
. . .
/ / object ’ s d i f f u s e c o l o r
*
. . .
/ / (N . l i g h t d i r e c t i o n )
i f ( fragment i s v i s i b l e from the . . .
viewer and l i gh t source i s . . .
v i s ib l e from the fragment ) {
uv = pointw ise m u l t i p l i c a t i o n . . .
of the view v e c t o r and the . . .
l i g h t d i r e c t i o n
for every l a f o r t u n e lobe {
add the lobe r e f l e c t i o n to the . . .
fragment c ol o r s e p a r a t e l y f o r . . .
each primary color
/ / r e f l e c ti o n = l i g h t color
*
. . .
/ / ( ( Cx , Cy , Cz ) . uv )\ ˆ n
}
}
}
}
The values Cx, Cy, Cz and n used for the lobes are
specific to the material used and stored in a separate
XML file (Bray et al., 2006) shipped with the appli-
cation, which allows adding, removing and changing
the presets without requiring a recompile of the ap-
plication. The demo materials used were blue paint,
brushed metal, clay, felt, primer and skin (see Fig-
ure 6).
4.3 Image Creation
The second part required for publications is the cre-
ation of an image based on the rendered image. A
screenshot would not be sufficient for this, because
the typical screen resolution of 100 dots per inch is
too low, at least 300 dots per inch (preferably more
than 600 dots per inch) are required for printed mate-
rial. Thus, a more sophisticated approach is required.
The OpenGL extension called “Framebuffer Ob-
jects” allows replacing the screen’s framebuffer with
a texture-based one. This texture is not limited by the
screen dimension, and thus can be any size up to the
INTRODUCING 3D VISION AND COMPUTER GRAPHICS TO ARCHAEOLOGICAL WORKFLOW - An Applicable
Framework
309
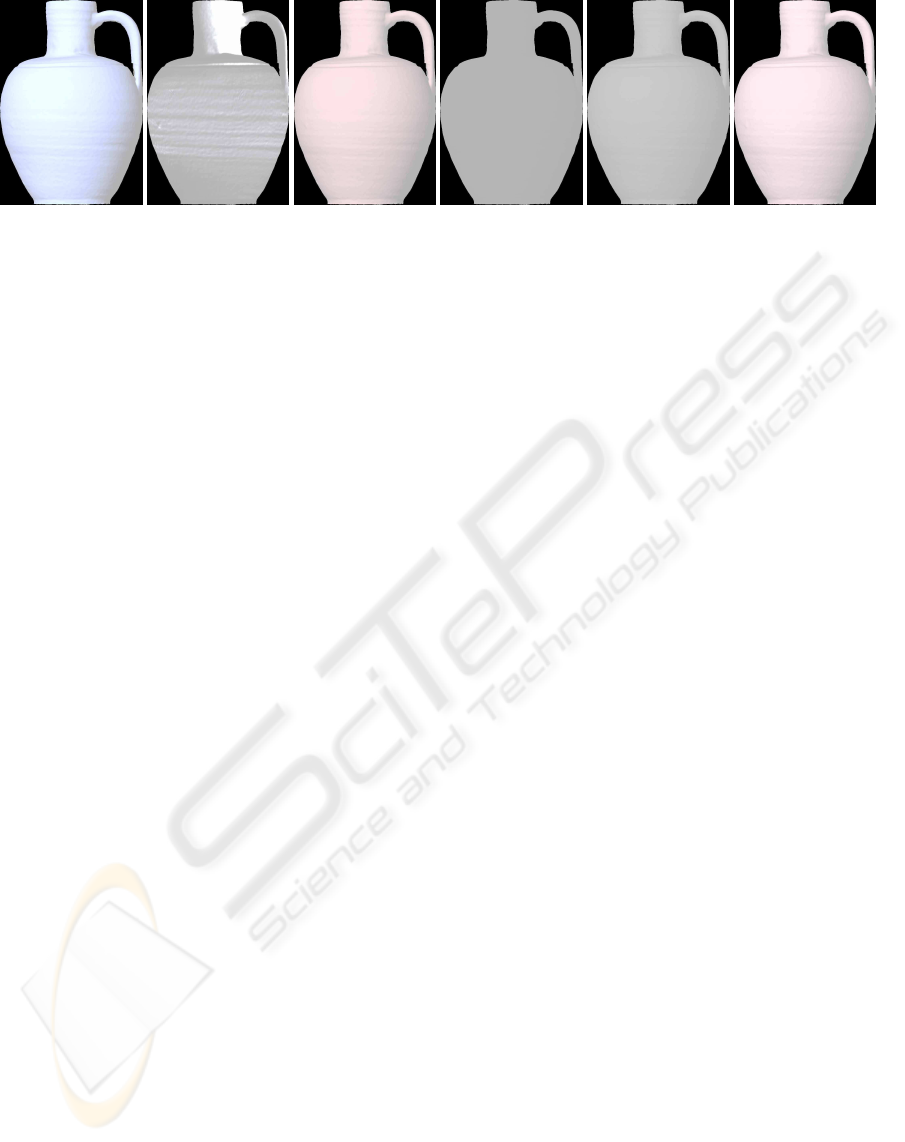
(a) (b) (c) (d) (e) (f)
Figure 6: The demo materials rendered using the Lafortune Shader. From left to right: blue paint, brushed metal, clay, felt,
primer and skin.
maximum texture size allowed by the graphics card
(currently, this is 8192 × 8192 pixels). After render-
ing into this texture, it can be copied from the graph-
ics memory to the main memory, encoded in an image
format like PNG or TIFF, and saved to the disk.
The first implementation created a 8192 × 8192
texture, and rendered into it. As mentioned earlier,
the real dimension of the object is known (per con-
vention, laserline scanners use a millimeter unit scale
for their data files), since orthographic projection is
used. So, the resolution is stored into the file, if the
format supports that metadata. However, this results
in unequal horizontal and vertical resolutions if the
object isn’t square, or phrased differently, non-square
pixels. Tests revealed that many graphics processing
applications including Adobe Photoshop (which is the
post-processingapplication used by the archeologists)
cannot handle non-square pixel graphic files. Thus, a
second revision was created, that scales portrait ob-
jects to a height of 8192 pixels while setting the width
according to the vertical resolution, and vice-versa for
landscape objects. This reduces the resolution in one
dimension slightly, but is still sufficient for the objects
usually scanned by the archeologists. Due to the fixed
size of 8192 pixels, the actual resolution of the image
depends on the object’s physical size.
5 RESULTS
For a first glance of results of our transdisciplianry
work in cooperation with archaeologists, we could
directly answer their questions for objective/precise
and rapid documentation. This means for examples:
we are the first to publish new volume of the Cor-
pus Vasorum Antiquorum (CVA) – a very well estab-
lished book series in classic archaeology for a cen-
tury (Pottier, 1923) – using 3D-acquisition and our
proposed methods. This work includes digital profile
lines with side/top-views as shown in this paper. Ad-
ditionally unwrappings of textured surface including
multispectral readings (Mara et al., 2007) and volume
estimations were conducted. We could also decrease
the costs for acquisition as less working time was re-
quired. Furthermore the risk for damaging this high-
value objects was minimized, as 3D-acquistion using
optical means takes only a few seconds and requires a
minimum of (in-situ) handling the objects.
Another recent example are the results for the ves-
sels excavated in the Valley of Palpa, Peru. In this re-
gion the wheel was not invented and therefore the as-
sumption of an rotational axis for ceramics may not be
valid either. Allthough we could determine axis and
planes of symmetry giving the archaeologists qual-
ity features for further classification. Furthermore we
could unwrap and enhance the pictoral information of
the painted vessels (Mara and Sablatnig, 2007).
The final result of our work is the collection of
methods as application framework called ArchiCut,
which completly relies on Open-Source to achive
transparency and cost-effectivness of the archaeolgi-
cal workflow. A screenshot of the User-Interface is
shown in Figure 5, while Figure 7a shows the com-
bined result for the profile line and a scaled side-view
render as clay, while Figure 7b shows a typically im-
proper rendering - as 3D-scanners may not acquire
correct reflectance nor any texture nor colour infor-
mation at all. As there already exists software for
editing 3D-data, we choose to implement an import
function using human- readable ASCII files (Wave-
front .OBJ). Furthermore data can be directly ac-
quired from Polyworks, InnovMetric Software Inc. –
a commonly used 3D- editing software – to increase
the performance of the workflow.
VISAPP 2008 - International Conference on Computer Vision Theory and Applications
310
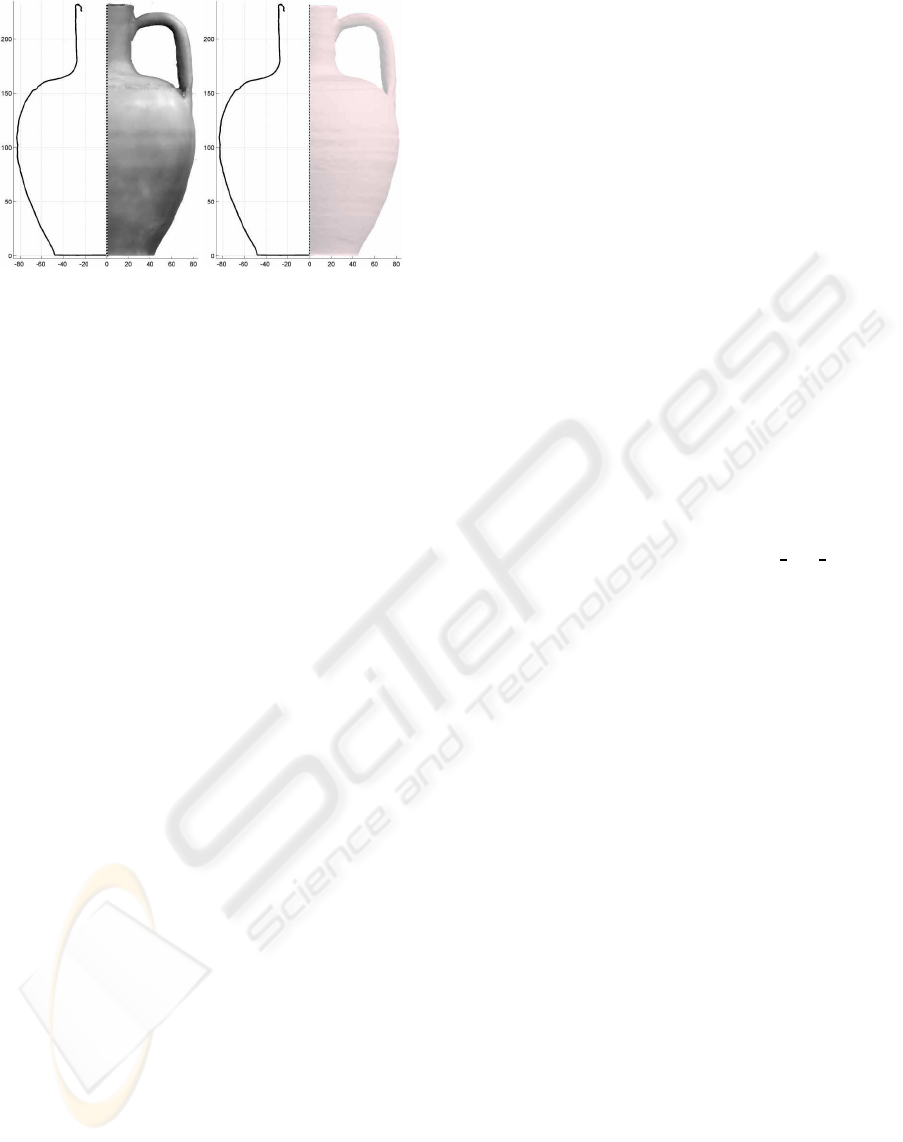
(a) (b)
Figure 7: Rendering of the profile line and the matching
side-view: (a) Arbitrary surface properties giving the im-
pression of a glaced pot. (b) Clay rendering reassambling a
clean and synthetic, but realistic impression.
6 CONCLUSIONS AND
OUTLOOK
Concluding and summarizing this paper, we are able
to show the application of 3D Vision and Computer
Graphics to archaeology within very different re-
search fields: From South American (”prehistoric”)
to Roman findings and for small fragments up to
complete large objects. While 3D-acquisition can
already be done by off-the-shelf products, for post-
processing like noise removal and registration there
exist a vast amount of algorithms. Although there
is still much space for improvment, state-of-the-art
methods already suit archeolgist’s purposes as we
showed in large scale experiments. The main part
of this publication concerns with the orientation of
non-industrialized objects and their fragments, which
are supposed to be rotational symmetrical. There-
fore we could show a method for orientation based
on disturbed symmetry to estimate the profile line –
the most important part of archaeological documen-
tation of ceramics. Followed by real-time-rendering
of the objects surface adopted for archaeolgical docu-
mentation, which requires high-resolutionfor printing
and spatial information for further research. This in-
formation is merged with the profile line to complete
the documentation. Furthermore the surface proper-
ties can easily be adopted and stored as templates as
the real texture is either not acquired by certain types
of 3D-scanners or it merely contains noise – typically
dirt.
Future work will be the integration of novel meth-
ods into our framework, which are currently under on-
going development. These methods concern the pro-
cessing, (pattern) recognition and rendering of dec-
orated surfaces. Furthermore we will investigate to-
wards symmetry analysis, which e.g. lead to answers
about other important archaeological questions about
manufacturing processes and quality features for dif-
fernt types of ceramics and their classification.
Beside all the previously mentonied improve-
ments of methods another important – conceptual –
work has begun to ensure the intellectual integrity, re-
liability, transparency, documentation, standards, sus-
tainability and accessibility of the information gath-
ered by the increasing use of 3D-scanners. Other-
wise we will face the problems shown in (Ogleby,
2007). Therefore we are adopting The London Char-
ter (Beacham et al., 2006), which will be a future
standard for the use of 3D- Vision and Computer
Graphics within Cultural Heritage.
ACKNOWLEDGEMENTS
We would like thank the following institutes
for granting access to their objects: Deutsches
Arch
¨
aologisches Institut, Bonn, Germany
(
http://www.dainst.org/abteilung 272 de
.html
); Kunsthistorisches Museum, Vienna, Austria
(
http://www.khm.at
); the Austrian Bundes-
denkmalamt (
http://www.bda.at
); the Institute
for Studies of Ancient Culture, Austrian Academy
of Sciences (
http://www.oeaw.ac.at/antike
)
and the Duwe 3D AG (
http://www.duwe-3d.de
),
Germany for their support regarding InnovMetric
Polyworks (
http://www.innovmetric.com
). All
URLs checked 26.Sept., 2007. This work was par-
tially supported by the Austrian Science Foundation
(FWF) under grant SESAME (P17189-N04), and the
European Union Network of Excellence MUSCLE
(FP6-507752).
REFERENCES
Beacham, R., Denard, H., and Niccolucci, F. (2006). An in-
troduction to the london charter. In et al., M. I., editor,
The e-volution of Information Communication Tech-
nology in Cultural Heritage: where hi-tech touches
the past: risks and challenges for the 21st century,
Short papers from the joint event CIPA/VAST/EG/Eu-
roMed, Budapest, Hungary. Archaeolingua.
Besl, P. and McKay, N. (1992). A Method for Registration
of 3-D Shapes. IEEE Trans. on Pattern Analysis and
Machine Intelligence, 14(2).
Bray, T., Paoli, J., Sperberg-McQueen, C. M., Maler, E.,
and Yergeau, F. (2006). Extensible Markup Language
(XML) 1.0 (Fourth Edition) - Origin and Goals. World
Wide Web Consortium.
INTRODUCING 3D VISION AND COMPUTER GRAPHICS TO ARCHAEOLOGICAL WORKFLOW - An Applicable
Framework
311

Chen, Y. and Medioni, G. (1992). Object Modelling by
Registration of Multiple Range Images. Image and
Vision Computing, 10:145–155.
Cosmas, J., Itagaki, T., Green, D., Grabczewski, E., Gool,
L. V., Zalesny, A., Vanrintel, D., Leberl, F., Grabner,
M., Schindler, K., Karner, K., Gervautz, M., Hynst, S.,
Waelkens, M., Pollefeys, M., DeGeest, R., Sablatnig,
R., and Kampel, M. (2001). 3D MURALE: A Multi-
media System for Archaeology. In Proceedings of the
International Conference on Virtual Reality, Archae-
ology and Cultural Heritage, pages 297–305, Athens,
Greece.
Fernando, R. and Kilgard, M. J. (2003). The Cg Tuto-
rial: The Definitive Guide to Programmable Real-
Time Graphics. Addison-Wesley Professional.
Foo, S. C. (1997). A Gonioreflectometer for Measuring the
Bidirectional Reflectance of Material for Use in Illu-
mination Computation (Masters Thesis). Cornell Uni-
versity.
Gray, K. (2003). Microsoft©DirectX©) 9 Programmable
Graphics Pipeline. Microsoft Press.
Kampel, M. and Sablatnig, R. (2003). An Automated Pot-
tery Archival and Reconstruction System. Journal of
Visualization and Computer Animation, Vol. 14:111–
120.
Kautz, J. and McCool, M. D. (1999). Interactive rendering
with arbitrary brdfs using separable approximations.
In Proc. of the Eurographics’99 Rendering Workshop.
Springer Computer Science.
Lafortune, E. P. F., Foo, S.-C., Torrance, K. E., and Green-
berg, D. P. (1997). Non-linear approximation of re-
flectance functions. In SIGGRAPH97: Proceedings
of the 24th annual conference on Computer graphics
and interactive techniques.
Lettner, M., Mara, H., Mueller, A., Sablatnig, R., Singer,
M., and Krenn, M. (2006). Pat: Profile analysis tool
for the documentation of archaeological finds. In Sab-
latnig, R., Hemsley, J., Kammerer, P., Zolda, E., and
Stockinger, J., editors, Digital Cultural Heritage - Es-
sential for Tourism, Proc. of 1st. EVA 2006 Vienna
Conference, volume 211 of Schriftenreihe der OCG,
pages 83–90, Vienna, Austria.
Leute, U. (1987). Archaeometry: An Introduction to Phys-
ical Methods in Archaeology and the History of Art.
John Wiley & Sons.
Mara, H. (2006). Documentation of Rotationally Symmet-
rical Archaeological Finds by 3D Shape Estimation.
Vienna University of Technology, Institute of Com-
puter Aided Automation, Pattern Recognition and Im-
age Processing Group.
Mara, H. and Sablatnig, R. (2007). Evaluation of 3D
Shapes of Ceramics for Determination of Manufactur-
ing Techniques. In Proc. of Computer Applications in
Archaeology ”Layers of Perception” (CAA’07), page
accepted/to appear, Berlin, Germany.
Mara, H., Trinkl, E., Kammerer, P., and Zolda, E. (2007).
3D-Acquisition and Multi-Spectral Readings for Doc-
umentation of Polychrome Ceramics of the Antiqui-
ties Collection of the Kunsthistorisches Museum Vi-
enna. In Proc. of the International Cultural Heritage
Informatics Meeting 2007 (ICHIM’07), page accept-
ed/to appear, Toronto, Ontario, Canada.
Marschner, S. R., Westin, S. H., Lafortune, E. P. F., Tor-
rance, K. E., and Greenberg, D. P. (1999). Image-
based brdf measurement including human skin. In
Proc. of the Eurographics’99 Rendering Workshop.
Springer Computer Science.
McAllister, D. (2004). Spatial brdfs. In Fernando, R., edi-
tor, GPU Gems: Programming Techniques, Tips, and
Tricks for Real-Time Graphics.
Melero, F., Leon, A., Contreras, F., and Torres, J. (2003). A
new system for interactive vessel reconstruction and
drawing. In Proceedings of CAA’03: Computer Ap-
plications in Archaeology, pages 8–12.
Ogleby, C. (2007). The ”truthlikeness” of virtual re-
ality reconstructions of architectural heritage: con-
cepts and metadata. In Proc. of the 2nd ISPRS In-
ternational Workshop 3D-ARCH 2007: ”3D Virtual
Reconstruction and Visualization of Complex Archi-
tectures”, International Archives of Photogrammetry,
Remote Sensing and Spatial Information Sciences Vol-
ume XXXVI-5/W47.
Orriols, X. (2004). Generative Models for Video Analysis
and 3D Range Data Applications. Ph.D. thesis. Uni-
versitat Autonoma de Barcelona, Spain.
Pharr, M. and Humphreys, G. (2004). Physically Based
Rendering : From Theory to Implementation. Pub-
lished by Morgan Kaufmann.
Pottier, E. (1923). Corpus Vasorum Antiquorum - France -
fasc. 1: Mus´ee du Louvre. E. Champion.
Rusinkiewicz, S. and Levoy, M. (2001). Efficient Variants
of the ICP Algorithm. In Third International Confer-
ence on 3D Digital Imaging and Modeling.
Shreiner, D., Woo, M., Neider, J., and Davis, T. (2006).
OpenGL Programming Guide, Fifth Edition. OpenGL
Architecture Review Board.
Torrance, K. E. and Sparrow, E. M. (1967). Theory for
off-specular reflection from roughened surfaces. Jour-
nal of the Official Society of America, Vol. 57(No.
9):1105–1114.
Willis, R. (2004). Stochastic 3D Geometric Models for
Classification, Deformation, and Estimation. Ph.D.
thesis. Brown University, Rhode Island, USA.
VISAPP 2008 - International Conference on Computer Vision Theory and Applications
312
