
BUILDING DETECTION IN IKONOS IMAGES FROM
DISPARITY OF EDGES
Charles Beumier
Signal & Image Centre,Royal Military Academy, 30 Avenue de la Renaissance, 1000 Brussel, Belgium
Keywords: Remote sensing, building detection, security, disparity, stereo, edges.
Abstract: The availability of very high resolution satellite images has enabled the automatic remote detection of man-
made structures for applications such as damage assessment or change detection. In particular, stereo pairs
of Ikonos or Quickbird images allow for the estimation of the third dimension so distinctive for buildings.
Since the areas to be studied may be quite large we propose a simple, fast and possibly accurate approach
for building detection. This approach consists in a three step procedure which first detects linear segments
independently in the left and right images, then matches segments according to their mutual coverage,
orientation and plausible disparity, and finally identifies building areas thanks to the presence of elevated
segments. The solution is fast as only pixels of high gradient connected into linear segments are considered.
Modelling object parts with linear segments is valid for the vast majority of man-made objects and allows
for rapid segment pairing for disparity computation with possible sub-pixel accuracy. This approach has
been applied to an Ikonos pair for the detection of large buildings in the context of risk assessment within
GMOSS, a European Network of Excellence.
1 INTRODUCTION
Although building detection or reconstruction from
aerial images has been the research topic of many
studies since more than two decades as exemplified
by the surveys of Mayer (Mayer, 1999) and Shufelt
(Shufelt, 1999), the use of very high resolution
satellite images for building detection started six or
seven years ago, when these images became
available (end 1999 for Ikonos and end 2001 for
Quickbird). In (Fraser, 2001) for instance, the
authors present an evaluation of Ikonos imagery for
geo-positioning accuracy and radiometric quality. In
(Jin et al., 2005), buildings are automatically
extracted in urban areas using structural, contextual
and spectral information. The practical advantages
of satellite image acquisition concerns the geo-
positional accuracy, large coverage, automatism and
small revisit time making satellite image analysis an
ideal candidate for risk or damage assessment and
change detection. In particular, stereo pairs available
from Ikonos and Quickbird sensors allow for the
estimation of the third dimension so distinctive for
elevated man-made structures like buildings (Fraser,
2001 and Vozikis, 2004).
Since the geographical areas to be studied are
quite large we propose in this paper a simple, fast,
though possibly accurate approach for building
detection which computes the disparity at pixels of
sufficient gradient and highlights linear segments so
representative of building outlines. In comparison
with the work published before (Beumier, 2007), the
author considers here matching linear segments
instead of individual pixels to improve the coherence
and quality of estimated disparities. This principle is
not new (Medioni et al., 1985) but the interest of the
current paper lies in application to VHR imagery for
risk assessment.
The rest of the paper is organized as follows.
Section 2 presents the methodology, detailing how
linear segments are detected in each image and
matched to derive a disparity measure on which to
assess the building presence. Section 3 gives results
of building detection from an Ikonos stereo pair in
the context of risk assessment and section 4
concludes the paper, highlighting perspectives.
2 METHODOLOGY
2.1 Approach
Buildings are characterized by linear edges related to
walls, roof edges or ridges and possibly linear
shadow casts. As other man-made structures like
road or parking lots also contain linear shapes,
317
Beumier C. (2008).
BUILDING DETECTION IN IKONOS IMAGES FROM DISPARITY OF EDGES.
In Proceedings of the Third International Conference on Computer Vision Theory and Applications, pages 317-322
DOI: 10.5220/0001083303170322
Copyright
c
SciTePress
buildings may be distinguished by their height
attribute. In very high resolution satellite images
buildings exhibit clear linear features, especially for
large constructions. The little houses which may
appear rounded are of smaller interest for security
applications.
We propose to detect buildings automatically in
a pair of very high resolution satellite images in a
three step procedure. First, linear segments related to
edges are looked for independently in the left and
right images. Secondly, segments of both images are
matched according to segment orientation, vertical
coverage and plausible disparity. Thirdly, areas
populated with elevated segments are selected as
potential built-up areas.
This goal directed approach, focusing on linear
segments which characterize buildings, is
computationally efficient since it considers only a
small fraction of pixels (edges) agglomerated into
segments. Matching elements for disparity
estimation is done at the segment level, reducing the
number of possible associations and taking
advantage of filtering criteria like segment length
and orientation. The modelling of edges with linear
segments also allows for the sub-pixel estimation of
the underlying lines, leading to increased disparity
precision. In particular, nearly horizontal image
lines, bringing disparity confusion when single
pixels are to be matched, may still have accurate
disparity estimation thanks to sub-pixel localization
of the corresponding segments.
Detected segments are selected according to their
disparity values to retain elevated linear parts. Up to
now, no building model has been used. The density
of detected segments matched in both images and
assigned to valid disparities (elevation) defines
geographical areas where built-up areas are likely to
be found.
2.2 Linear Segment Detection
The left and right images of the stereo pair are
processed independently with the same procedure to
extract linear segments.
First a low-pass filter (a 3x3 uniform average) is
applied to reduce image noise. Then the gradient
magnitude and orientation are estimated from
horizontal and vertical differences of grey-level
values with 2-pixel of distance. Thirdly, an edge
follower is initiated for each pixel whose gradient
magnitude exceeds threshold start_grad. Following
edge proceeds in the direction perpendicular to the
gradient, picking the neighbouring pixel (three
candidates) with maximal gradient magnitude and
compliant with the original gradient orientation. A
segment is completed as soon as the current gradient
magnitude becomes lower than threshold min_grad.
Details are given in (Beumier, 2007).
After constraining segment construction by
magnitude and rough orientation criteria, candidate
segments are filtered based on geometrical
constraints. Small segments (min_length) are
rejected as they do not offer enough confidence and
linear robustness. Winding segments are rejected
based on the standard deviation of segment pixel
distance relative to the minimal inertia axis. This
deviation is easily computed with second order
moments as presented in (Beumier, 2006). The
proposed implementation enforces straightness
thanks to an incremental computational model
ensuring efficiency and presents an intuitive
interpretation of the straightness parameter.
Although edge magnitude could be a measure of
segment confidence, the similarity of segment edge
magnitude was not used since the difference in
viewpoint for the left and right images implies large
gradient variations.
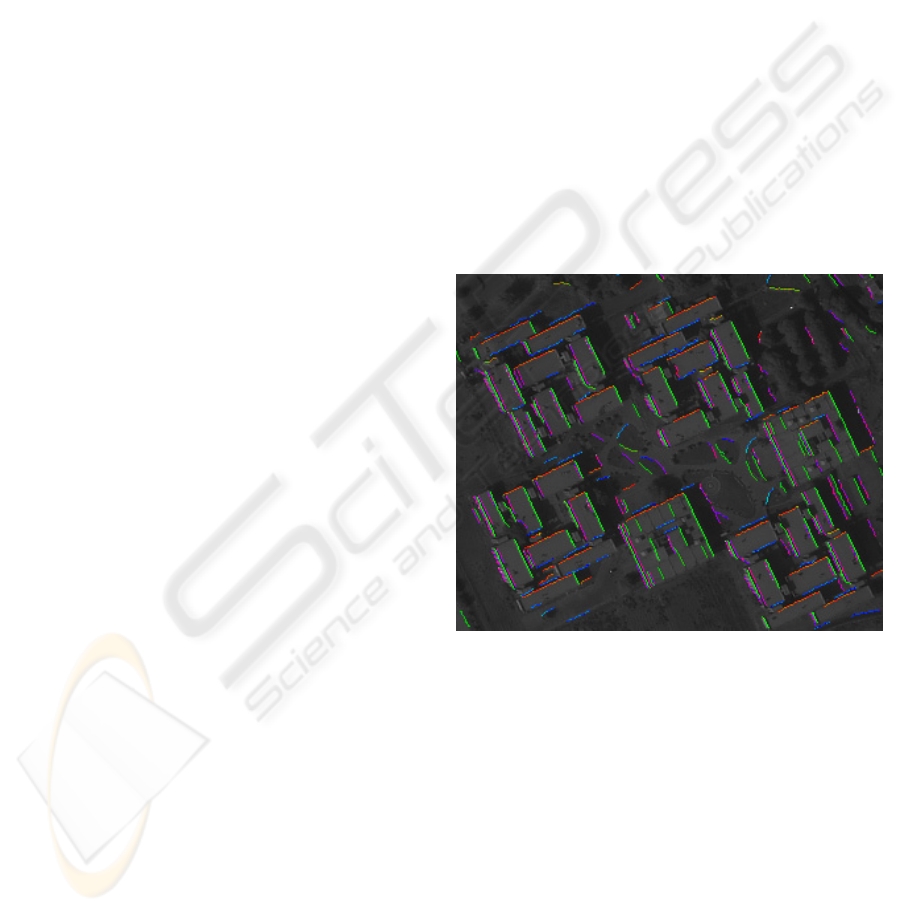
Figure 1: Segments highlighted in left image with colour
based on orientation.
2.3 Segment Matching
In a stereo pair of images, the two images are taken
from a different point of view, allowing for the
depth recovery by triangulation. To recover precise
x, y and z coordinates, positional (camera optical
axes) and camera parameters (focal length, principal
point, distortion) are necessary.
Image providers mostly perform a rectification of
stereo pairs which aims at warping the images based
on positional and camera parameters so that any
scene point is visible at the same vertical position in
the left and right images (epipolar constraint). In that
case, the search of corresponding pixels in left and
VISAPP 2008 - International Conference on Computer Vision Theory and Applications
318

right images is reduced to 1-D (horizontal) search,
simplifying and speeding up the matching
procedure.
In the specific case of building detection for
security application like change detection or damage
assessment, an accurate z coordinate (elevation) is
often not necessary. An approximated value or
measure relative to the neighbourhood suffices. In
this case, the disparity is a valid cue for rough
elevation estimation.
To derive disparity values, corresponding left
and right segments must be paired. Segment
matching considers the following properties:
2.3.1 Vertical Overlap
The segments corresponding to a same object are
displaced horizontally in the left and right images.
However, due to differences in images originating
from viewpoint changes, occlusion, shadow or noise,
the correspondence may be partial or inexistent. We
retain segments for matching if their vertical overlap
has a minimum length of only 2 pixels, arguing that
purely horizontal linear segments cannot receive a
reliable disparity measure.
Even though a larger overlap normally increases
the confidence we have in a match, we have not used
any confidence rating related to the vertical overlap
as the length of segment is probably more pertinent
than its vertical projection. Similarity in length is
however a difficult concern as many segments
appear differently in left and right images due to
occlusion, perspective or edge detection conditions.
2.3.2 Consistent Orientation
The segments in the left and right images
corresponding to one scene object often have a
similar orientation (the same if the object has a
constant elevation). This orientation has a possible
range of 360°, including the sign of the gradient,
because rising and falling edges correspond to a
different grey-level neighbourhood and thus
probably to a different underlying object. The
segment orientation is estimated thanks to the
segments points and is quite accurate, as the retained
segments are straight. Perspective effects, different
in images due to the viewpoint change, may cause
some difference in segment orientation. Parameter
orient_thres accounts for orientation flexibility in
segment matching. A typical value for this
parameter is 10°.
No confidence factor has been associated to
orientation. The segment pair is either rejected or
accepted based on the orient_thres parameter.
2.3.3 Valid Disparity
Due to image capture, geometry constraints and
scene continuity, the range of allowable disparities is
restricted to a given interval. This interval may be
limited to minimum (min_disp) and maximum
(max_disp) values when looking for a specific
elevation range. Until now, these values are entered
by the operator, but are later supported by a
histogram of disparities measured on the images.
2.3.4 Matching Confidence
Each segment pair satisfying the 2.3.1, 2.3.2 and
2.3.3 conditions is given a confidence measure in
order to filter pair candidates, especially for
ambiguous associations (segment associated to
several segment candidates). This measure could
integrate a factor promoting vertical overlap or
segment length similarity and a factor decreasing
with orientation difference. So far, the confidence
measure is based on the histogram of disparities of
possible matching pairs of segments.
For ‘left’ segments contained in a rectangular
area of the left image and ‘right’ segments of the
corresponding rectangular area of the right image,
the matrix of segments association is filled in with
the disparity of valid segment pairs. The histogram
of disparities is computed and segment pairs are
given as confidence the occurrence of the disparity
as collected by the histogram.
This simple method was designed to take the
segment topology with no explicit topology
description, as consistent disparities are often
present in the structure of built up areas. It is also
based on the principle that false disparities are likely
to present non-typical values spread out in the
histogram.
2.4 Disparity Estimation
As explained in the previous section, for rectified
images, we look for the horizontal disparity between
matching segments. As scene objects are not
necessarily horizontal (with a constant elevation)
disparity values might vary along the segment.
Fortunately, as we paired linear segments, the
disparity also varies linearly along the segments,
corresponding to a linear variation of a linear object
in the scene.
Thanks to the linearity of searched scene objects
and straightness of detected segments, we can use
sub-pixel approximation of the segments and derive
a sub-pixel estimation of the disparity. When the
straightness constraint is sufficiently high, the
BUILDING DETECTION IN IKONOS IMAGES FROM DISPARITY OF EDGES
319

segment is perfectly approximated by a slope and a
reference point with sub-pixel coordinates. The
disparity along the segment can be obtained from the
difference in slope and the difference in horizontal
coordinate of the reference point. That computation
scheme for disparity estimation is also preferable in
the case of nearly horizontal segments as these
contain consecutive pixels with same vertical
coordinate value leading to confusion for horizontal
disparity estimation.
Under the hypothesis of linear underlying scene
objects, we can extend the recovery of linear
segments to the union of the left and right segments.
The common part of the left and right matching
segments, facing horizontally, is used to estimate the
sub-pixel linear variation of the disparity. We then
extend this linear estimation to the upper and lower
limits of either left or right matching segments.
Segment extension should however be used with
caution and additional information (other segments
or grey level continuity) should be gathered for
confirmation. This was not implemented in the
present work.
2.5 Segment Selection
The information extracted so far may be used to
assess the presence of elevated linear segments so
representative of buildings.
If buildings are to be highlighted, range limits of
disparity may be specified to filter out objects not in
the expected range of heights. If more than a visual
appreciation is desired, detected segments with valid
disparity can be grouped into structures thanks to
disparity or height consistency and relative
orientation and distance (proximity, parallelism or
perpendicularity).
3 RESULTS
The approach was applied to a stereo pair of Ikonos
images in the context of the GMOSS European
project. GMOSS (Global MOnitoring for Stability
and Security) is a Network of Excellence in the
Aeronautics and Space priority of the 6th framework
of the European Union lasting from 2004 to 2008.
GMOSS aims at acquiring and maintaining expertise
for global monitoring using satellite earth
observation. One activity was the definition and
collaboration for several test cases related to real
situations through which partners could contribute
thanks to their expertise.
For the test case concerning Iraq, the SIC
contributed with the detection of medium or large
size buildings thanks to the disparity estimation from
a stereo pair of 1-m resolution images around
Bagdad. Risk assessment is indeed of high
importance in critical situations and industrial areas
consisting of large buildings are potential targets.
A particularly interesting representation of the
results considers the display in false colour of
segments matched in the left and right images. In
Figure 2, matched segments are displayed according
to their disparity with a rainbow palette. Low objects
(typically on the ground level) appear in violet or
dark blue while light blue or green correspond to
medium elevation. Elevated segments are displayed
in yellow, orange or red.
Still considering this figure, we observe that few
candidate segments satisfy the conditions about edge
magnitude, continuity and length, although the
linearity constraint was quite loose. This reduces
considerably the number of possible pairs and
additional constraints about valid disparity, overlap
and orientation allows for the rejection of most
improper matches.
The small number of segments and possible
matches makes the approach fast, as intended. The
processing of a pair of 1Mpixel images takes less
than three seconds on a 1.3 MHz PC with most of
the time devoted to segment detection.
As visible in the figure, many linear segments
not related to buildings can be filtered out thanks to
the disparity constraint. Most violet or dark blue
segments correspond to roads, field limits or fences.
A few light blue segments emanate from trees and
could probably be rejected by a stricter condition on
straightness.
For building area detection, a map is created
from the count of segment pixels with appropriate
disparity in 25m x 25m neighborhood, thresholded
by the median of the counts. Results in Figure 3.
Figure 3: Building area map from counts of segment
pixels with appropriate disparity in 25x25 neighborhood.
VISAPP 2008 - International Conference on Computer Vision Theory and Applications
320
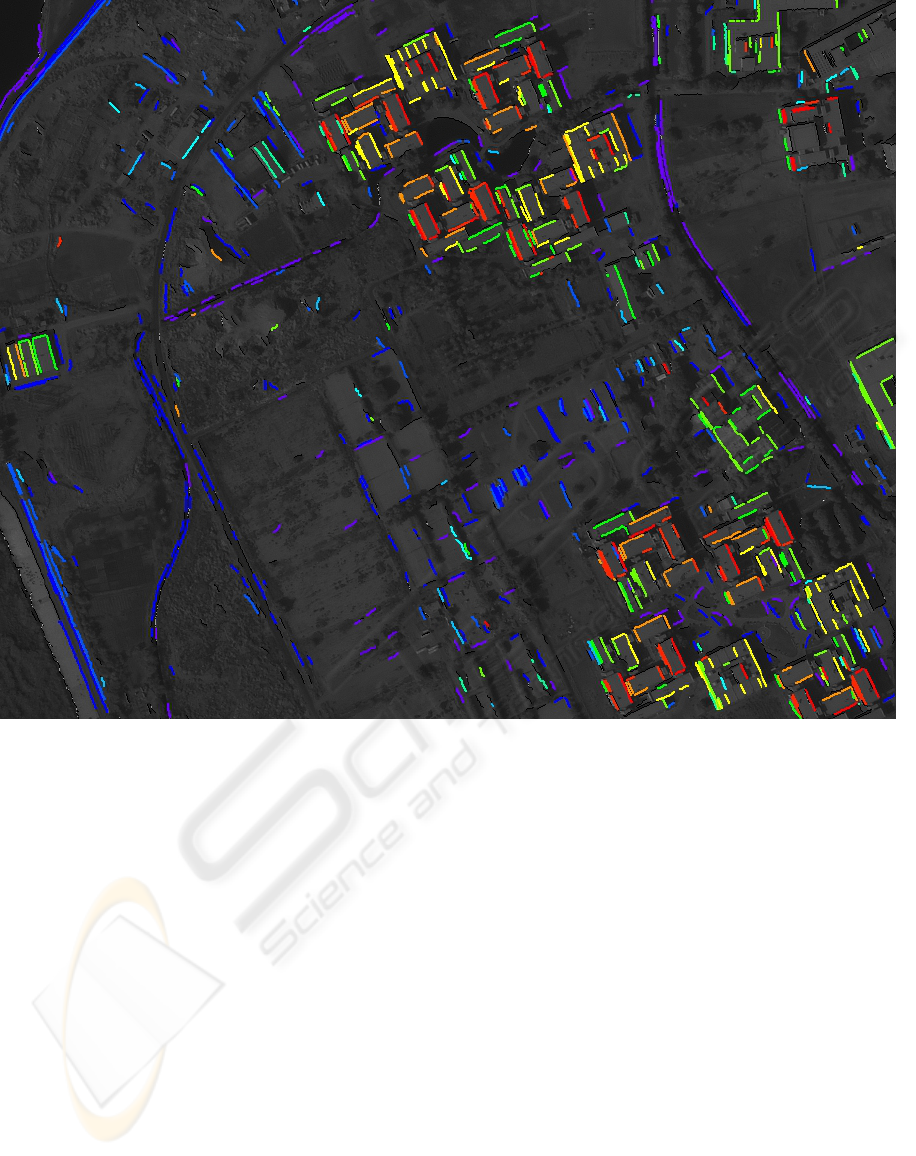
Figure 2: Display of matched segments with rainbow palette. Low segments are in violet and dark blue, medium in light
blue and green and elevated segments are in yellow, orange or red.
Although successfully applied to medium and
large building detection, the approach has a
limitation linked to the similarity of the left and right
images. Common differences are due to occlusion
seen differently in both images, a change in
orientation due to non horizontal segments (ridges of
a gable roof) or a modification of illumination due to
the sun orientation (different reflection or shadow,
especially when the sun is low). The implied
difficulties increase with the change of viewpoints
so that a smaller B/H ratio is preferable (the base B
is the distance between the two viewpoints and the
height H is the distance between the camera and the
object point). However the elevation precision is
proportional to the B/H ratio.
This qualitative analysis will be completed by a
quantitative analysis as soon as we dispose of
ground truth. For this, the approach will be applied
to a couple of aerial images on an area for which we
can get a vector database with elevation.
4 CONCLUSIONS
We presented an efficient large and medium
building detection based on the disparity of
corresponding linear segments of an Ikonos stereo
pair.
Candidate segments are first detected in the left
and right images and filtered according to their
length and linearity. Left and right segments are
matched thanks to the vertical overlap, consistent
orientation and plausible disparity. Candidates for
built-up areas are highlighted by the density of
segments with appropriate disparity. The
implementation is simple and fast and allows for
sub-pixel accuracy if necessary. It was applied to the
detection of buildings for risk assessment and can be
easily extended for change detection or damage
assessment.
In the future we intend to assess the method
quantitatively, in particular to try the sub-pixel
BUILDING DETECTION IN IKONOS IMAGES FROM DISPARITY OF EDGES
321

potential in the case of higher resolution images by
detecting buildings in aerial images and compare
elevation from the ground truth of a vector database.
ACKNOWLEDGEMENTS
This study has been supported by the Belgian MoD.
Image data has been obtained through the GMOSS
(Global Monitoring for Security and Stability)
Network of Excellence of the European
Commission.
REFERENCES
Mayer, H., 1999. Automatic Object Extraction from Aerial
Imagery – A survey Focusing on Buildings. Computer
Vision and Image Understanding, Vol. 74, No. 2, May
1999, pp 138-149.
Shufelt, J., 1999. Performance Evaluation and Analysis of
Monocular Building Extraction From Aerial Imagery.
IEEE Trans. On Pattern Analysis and Machine
Intelligence, Vol. 21, NO. 4, Apr 1999, pp 311-326.
Fraser, C. S., Baltsavias, E. & Gruen, A., 2001. 3D
building reconstruction from high-resolution IKONOS
stereo images. Proc. Of 3
rd
int. Symposium on
Automatic Extraction of Man-made Objects from
Aerial and Space Images. Ascona, Switzerland, 10-15
June 2001, pp 331-344.
Jin, X. & Davis, C. H., 2005. Automated Building
Extraction from High-Resolution Satellite Imagery in
Urban Areas Using Structural, Contextual, and
Spectral Information. EURASIP Journal on Applied
Signal Processing 2005: 14, pp 2196-2206.
Vozikis, G., 2004. Automatic generation and updating of
digital city models using high-resolution line scanning
systems. Geo-imagery Bridging Continents, XXth
ISPRS Congress, 12-13 July 2004, Istanbul, Turkey,
commission III, WGIII/7, pp 1033-1038.
Beumier, C., 2007. Building detection from disparity of
edges, 27
th
Earsel Symposium – Geoinformation in
Europe, Bolzano Italy, 4-7 June 2007.
Medioni, G. & Nevatia, R., Segment-Based Stereo
Matching. Computer Vision, Graphics, and Image
Processing, Vol. 31, 1985, pp 2-18.
Beumier, C., 2006. Straight-line Detection Using Moment
of Inertia. IEEE International Conference on
Industrial Technology 2006 (ICIT2006), Mumbai,
India, Dec 15-17, 2006.
VISAPP 2008 - International Conference on Computer Vision Theory and Applications
322
