SPECKLE MODELIZATION IN OCT IMAGES FOR SKIN LAYERS
SEGMENTATION
Ali Mcheik, Clovis Tauber, Hadj Batatia
IRIT-ENSEEIHT, 2 rue Camichel BP7122, 31017 Toulouse, France
Jerome George, Jean-Michel Lagarde
CERPER, Laboratoires Pierre Fabre, Toulouse, France
Keywords:
Medical image analysis, Statistical approach, Segmentation and grouping, Optical coherence tomography.
Abstract:
In dermatology, the optical coherence tomography (OCT) is used to visualize the skin over a few millimetre
depth. These images are affected by speckle, which can alter the interpretation, but which also carry informa-
tion that characterizes locally the visualized tissue. In this paper, we present a statistical study of the speckle
distribution in OCT images. The capability of three probability density functions (pdf) (Rayleigh, Lognormal,
and Nakagami) to differentiate the speckle distribution according to the skin layer is analysed. For each pdf,
the vector of parameters, estimated over several images which are annotated by experts, are mapped onto a
parameter space. Quantitative results over 30 images are compared to the manual delineations of 5 experts.
Results confirm the potential of the method for the segmentation of the layers of the skin.
1 INTRODUCTION
The diagnosis and the treatment of pathologies of the
skin are largely based on a visual examination by
the dermatologists. This examination requires a great
experience because the skin can present ambiguous
states that are not easily interpretable. Often, as for
the monitoring of cancer, biopsies and histological
analysis are used to resolve these ambiguities. The
development of optical coherence tomography (OCT)
imaging aims at the realization of non invasive optical
biopsies.
OCT images allow the visualization of the struc-
tures of the skin, like the sweat glands, the stratum
corneum, or the change of contrast at the junction be-
tween the dermis and the epidermis. However, the de-
tailed examination of the images is strongly disturbed
by the presence of speckle. The speckle reduces con-
trast and makes difficult the interpretation of the im-
ages. It creates inter and intra variability among the
experts for the identification of the borders between
the different layers of the skin. This is particularly
true for tissues with high diffractors density like the
skin. The speckle is thus often regarded as a noise. It
is generally admitted that two types of speckle can be
found in OCT images(Schmitt, 1999; Raju and Srini-
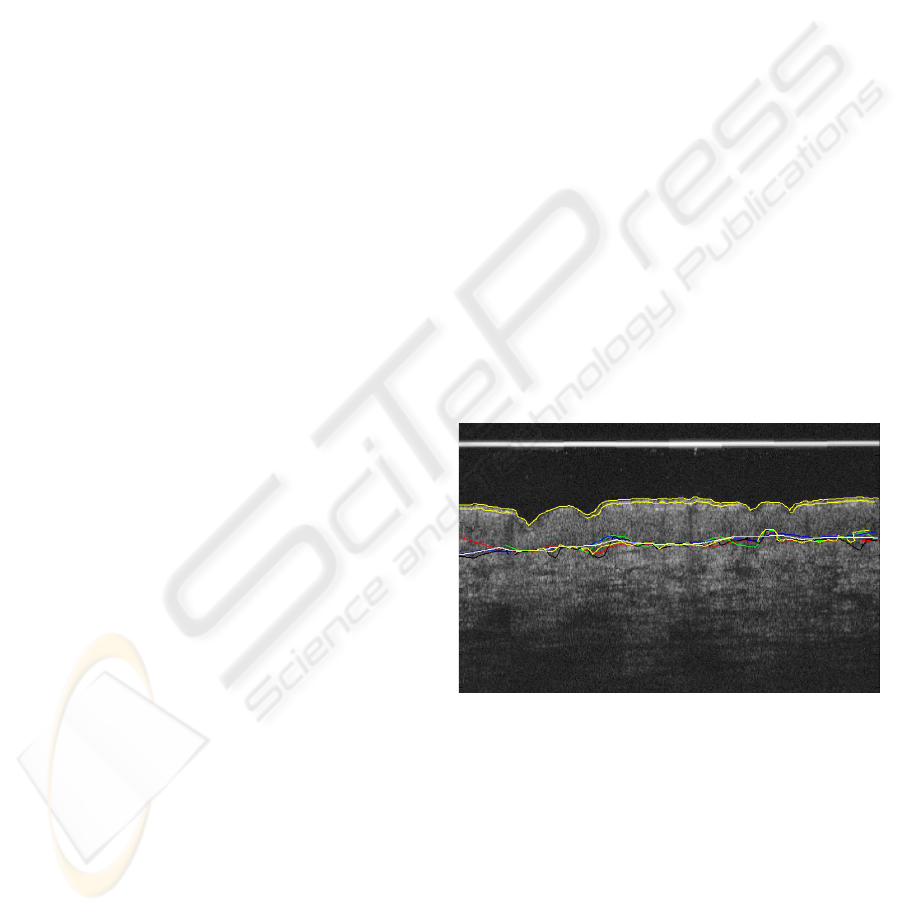
Figure 1: Optical coherence tomography image of the skin
with manual delineations of two layers.
vasan, 2002). The first one comes from the interfer-
ence of several reflected photons. It appears as pixel-
sized dots with random value that can be filtered via
averaging techniques. The second type of speckle re-
sults from the interferences caused by the retrodiffu-
sions of the propagating waves front within the res-
olution cell of the imaging device. This speckle can
be found everywhere in the image. Several methods
can be found in the literature to reduce the speckle
in OCT images. Among these methods, the angu-
lar and spatial compoundingsignificantly increase the
347
Mcheik A., Tauber C., Batatia H., George J. and Lagarde J. (2008).
SPECKLE MODELIZATION IN OCT IMAGES FOR SKIN LAYERS SEGMENTATION.
In Proceedings of the Third International Conference on Computer Vision Theory and Applications, pages 347-350
DOI: 10.5220/0001086603470350
Copyright
c
SciTePress

signal to noise ratio (SNR) of images and improve the
contours detection(Bashkansky and Reintjes, 2000).
Adaptivefiltering techniques are also used to preserve
and reinforce contours between the skin layers, while
reducing the effects of speckle(Iftimia et al., 2003).
However, for a given location and studied tissue, the
speckle has the same characteristics in OCT images.
Even though speckle is generally regarded as a noise,
it is also a source of information for tissue characteri-
zation.
The analysis of the statistics of speckle in each
layer of the dermis and epidermis would facilitate
the differentiation of the skin tissues and thus pro-
vide a model for robust segmentation. This paper is
a contribution to this analysis. It presents a statistical
study of the distribution of the speckle in OCT im-
ages. The sizes and densities of the diffractors in the
visualized tissues characterize the speckle. We mea-
sure these variations to modelize the speckle, by the
estimation of the parameters of three probability den-
sity functions, namely the Rayleigh, Lognormal and
Nakagami distributions.
The remainder of this paper is organizedas follow.
Section 2 describes the models of distribution that we
uses to caracterize the speckle and the respective esti-
mation of their parameters. The experimentations are
detailled in section 3. Finally we draw some conclu-
sions in section 4.
2 SPECKLE MODELIZATION
AND PARAMETER
ESTIMATION
Estimation of the parameters of all three distri-
butions was done using the method of moments
(MM)(Nicolas, 2006).
2.1 Rayleigh Distribution
This model was introduced in a study of speckle
in laser imaging. It supposes a fully developped
speckle, and results from the central limit theorem.
The backscattered signal can be modelized as a pha-
sor sum of the returns from several scatterers within
the resolution cell of the system. The Rayleigh pdf
and cummulative distribution function (cdf) are given
by :
p
R
(r) =
r
σ
2
e
−
r
2
2σ
2
r ≥ 0; σ > 0 (1)
F
R
(r) = 1−e
−
r
2
2σ
2
(2)
Where σ is the scale parameter.
The estimation of σ by the methods of moments is
given by :
ˆ
σ =
r
2
π
∑
N
i=1
x
i
N
(3)
where N is the number of data and x
i
the data itself.
2.2 Lognormal Distribution
The lognormal distribution has two parameters µ and
σ. Its pdf and cdf are given by :
p
L
(r) =
1
σr
√
2π
e
−
1
2
(logr−µ)
2
2σ
2
(4)
F
L
(r) = π
logr−µ
σ
(5)
The parameters can be estimated from the calculus
of the first two moments :
(
ˆ
σ =
q
log
m
2
m
1
ˆµ = 2log(m
1
) −
1
2
log(m
2
)
. (6)
2.3 Nakagami Distribution
The Nakagami distribution can modelise the disper-
sion of several backscattered clusters of waves added
incoherently. It includes the Rayleigh distribution as
a special case and can approximate the Rician distri-
bution. The signal to noise ratio of the Nakagami dis-
tribution can take any positive value. Its pdf and cdf
are given by :
p
N
(r) =
2
µ
√
L
Γ(L)
r
√
L
µ
!
2L−1
e
−
r
√
L
µ
2
(7)
F
N
(r) = Γ
inc
(L,
Lr
2
µ
) (8)
where L is the shape parameter and µ the scale pa-
rameter, with r ≥ 0 and σ > 0. Γ
inc
is the incomplete
gamma function.
As the Nakagami function has two parameters,
moments of order 1 and 2 needs to be calculated. Af-
ter the classic approximation based on the properties
of the Gamma function, the system to calculate the
parameters is given by :
(
ˆ
L =
1
8
1
√
m
2
m1
−1
ˆµ =
√
m
2
. (9)
VISAPP 2008 - International Conference on Computer Vision Theory and Applications
348
3 EXPERIMENTATIONS
3.1 Experimental Corpus
The experimental corpus is made of images of the
skin provided by the Laboratory ANONYMOUS. We
used an ISIS SkinDex 300 OCT imaging device. This
device, specifically dedicated to skin imaging, illu-
minates the skin with 8 LED, emitting a light close
to the infra-red range (1300nm). The 8 diodes are
used simultaneously to recover the signal on 8 par-
allel channels. Shifts in intensity between the vari-
ous channels are at the origin of a phenomenon of
bands which appear on the produced OCT images.
This imaging devicereaches a depth of approximately
900mm. For this study, all the data correspond to
areas of skin located on the front arm. These im-
ages present two layers, successively the epidermis
and the dermis. In the epidermis, the layer of the stra-
tum corneum is a fine irregular band which constitutes
the surface of the skin. The data on which we under-
took our study were submitted beforehand to experts
from the ANONYMOUS laboratory which manually
delimited the external surface of the skin, the stratum
corneum and the junction between the epidermis and
dermis (JED). The observed variability of the delin-
eation testifies the difficulty of interpretation of the
OCT images and the need for semi-automatic clas-
sification methods (Fig. 1). The data provided by
the experts constitute the ground truth used for ex-
perimentations.
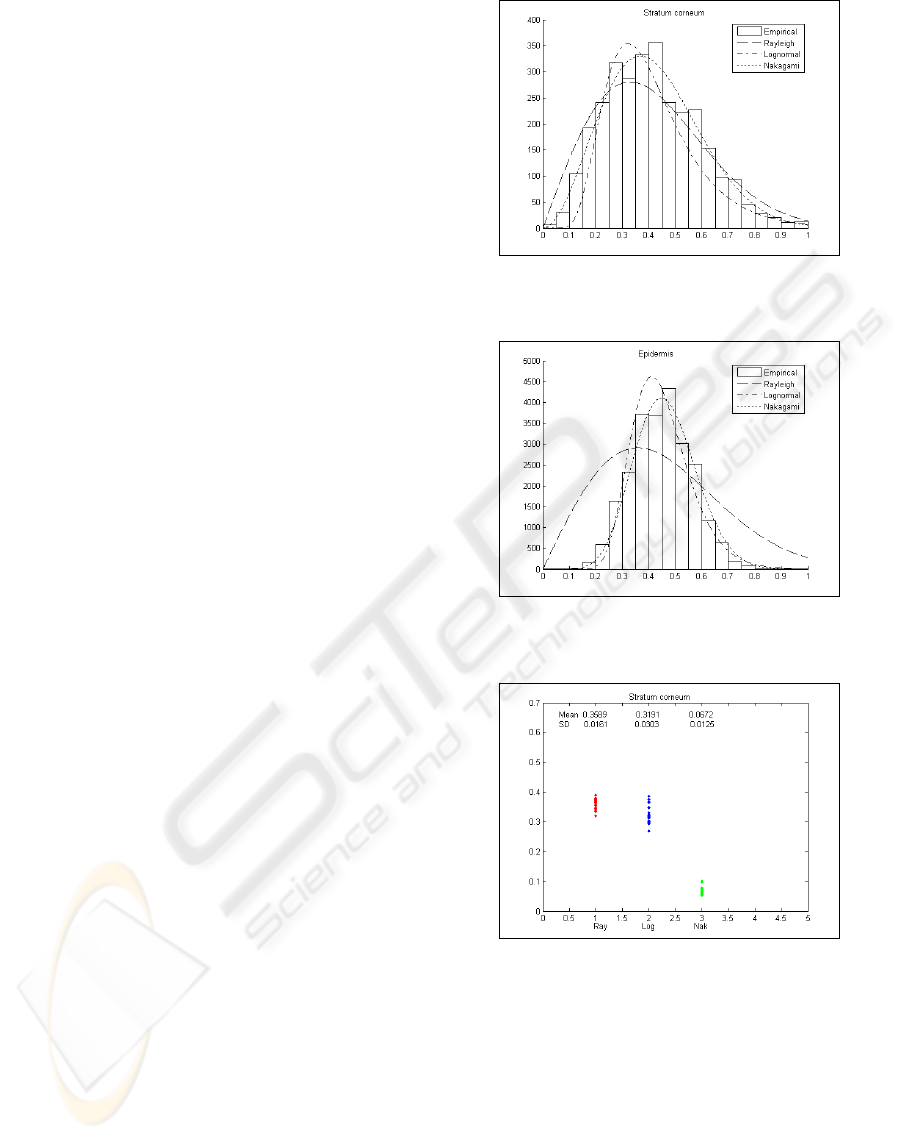
3.2 Empirical Data Fitting
The parameters of each distributions are estimated
over the data of the stratum corneum and the data of
the other part of the epidermis delineated by the ex-
perts. Figures 2 and 3 present the fitting of the distri-
butions over the empirical data of each of these layers.
The pdf were scaled so that the area under the curves
matched the total area under the histogram.
On both layers, the best fit was obtained with
the Nakagami distribution. The Rayleigh distribution
leads to the poorer result while the Lognormal distri-
bution goodness of fit is close but less precise than the
Nakagami distribution. This is confirmed by the KS
goodness of fit test that we performed over 30 images
for both the stratum corneum and epidermis layers.
Figures 4 and 5 present the KS values for each distri-
butions.
Quantitative measurements using the KS criterion
show that the nakagami distribution is the most pre-
cise for speckle characterization. It obtains the best
KS scores on each layer, on all the 30 images. We
Figure 2: Fitting of the three distributions over the empirical
OCT data of the stratum corneum.
Figure 3: Fitting of the three distributions over the empirical
OCT data of the epidermis.
Figure 4: KS values of the fits of the stratum corneum data
over 30 images.
performed the experimentations on the separability of
the layers with this distribution.
3.3 Separability of the Skin Layers
We estimated the parameters of the Nakagami distri-
bution over the two layers of the 30 images, for each
of the five experts. Figure 6 presentsthe vectors of pa-
rameters for each layers, on the 30 images, projected
SPECKLE MODELIZATION IN OCT IMAGES FOR SKIN LAYERS SEGMENTATION
349
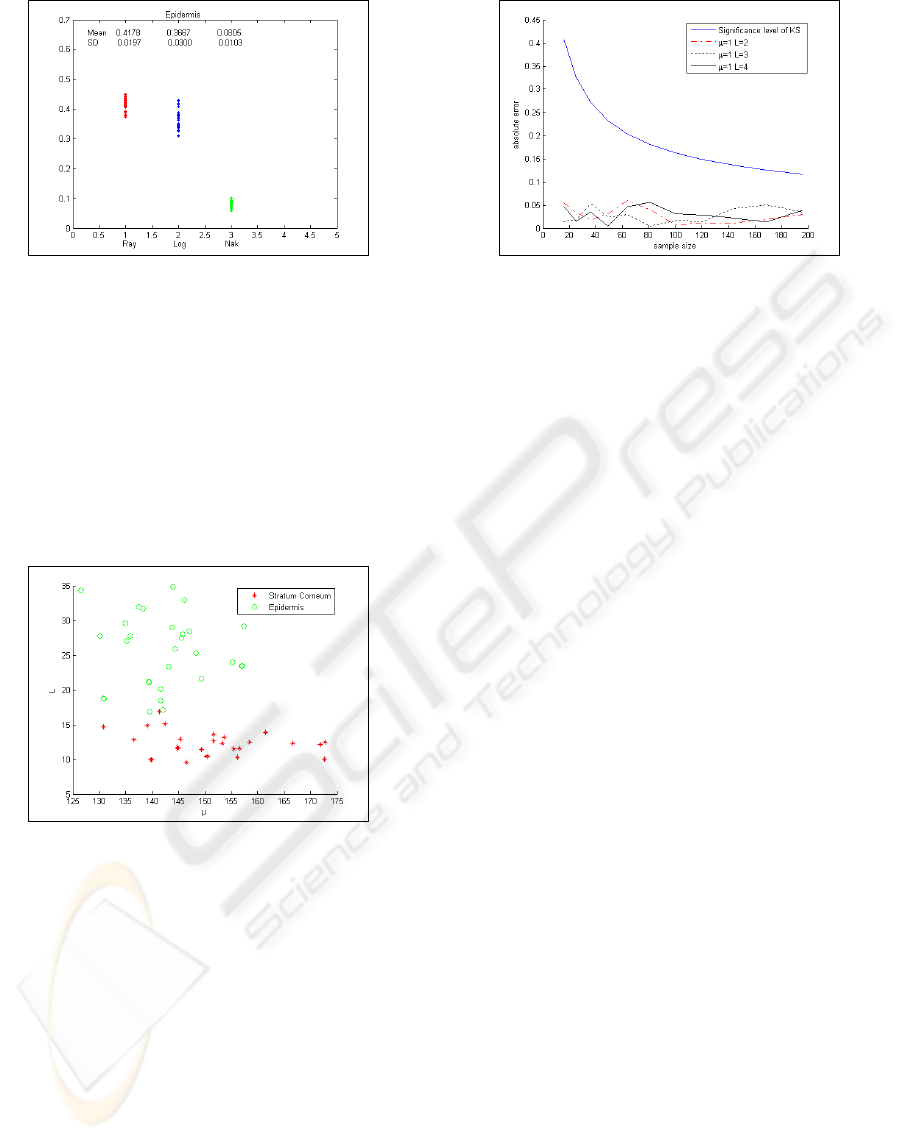
Figure 5: KS values of the fits of the epidermis data over 30
images.
onto the parameter space. It shows that the speck-
les that affect the two layers have different caracter-
istics. The two layers can thus be classified upon the
caracterization of the speckle that affects their corre-
sponding tissue. This confirm both the fact that the
local speckle caracteristics depends on the visualised
tissue, and that this caracterization brings richfull in-
formation for the segmentation of the layers of the
skin.
Figure 6: Parameters vectors of the Nakagami distribution
estimated over 30 images, for both layers.
3.4 Stability of the Estimator
We analysed the KS criterion of the Nakagami distri-
bution on synthetic data samples of various sizes, to
study the stability of the estimator on small samples.
Figure 7 presents the KS values of the Nakagami dis-
tribution calculated for various sizes of the synthetic
data samples.
The results shows the stability of the estimator.
This is relevant for image processing matters, as dur-
ing segmentation or classification the speckle has to
be caracterized locally on small data samples.
Figure 7: KS value of the Nakagami distribution for various
sizes of the data sample and several parameters values.
4 CONCLUSIONS
In OCT images of the skin, it is often difficult to dis-
tinguish the various layers and the various lesions.
The statistical study of the distribution of speckle in
OCT images can be the clincher for successful dis-
tinction of these elements. In this paper, we analyzed
the performances of three models of distribution for
the speckle characterization in the stratum corneum
and the remainder of the epidermis. The results show
that the nakagami distribution leads to a better classi-
fication. The probability density functions that were
studied have one or two parameters. This number is
of primary importance in the capacity of a pdf to pre-
cisely characterize the speckle and differentiate the
layers. We currently work on the study of the Gen-
eralized Gamma distribution with three parameters,
which should produce more precise results.
REFERENCES
Bashkansky, M. and Reintjes, J. (2000). Statistics and re-
ductin of speckle in optical coherence tomography.
Opt. Letters, 25:545–547.
Iftimia, N., Bouma, B., and Tearney, G. (2003). Speckle
reduction in optical coherence tomography by path
length encoded angular compounding. Journal of
Biomed. Opt., 8:260–263.
Nicolas, J. (2006). Application of the mellin transform:
study of the statistical laws of the image. Research
Report 2006D010 ENST Paris.
Raju, B. and Srinivasan, M. (2002). Statistics of envelope
of high-frequency ultrasonic backscatter from human
skin in vivo. Ultrasonics, Ferroelectrics and Fre-
quency Control, IEEE Transactions on, 49:871–882.
Schmitt, J. (1999). Optical coherence tomography (oct): a
review. IEEE J. Sel. Topics. Quant. Electron., 4:1205–
1215.
VISAPP 2008 - International Conference on Computer Vision Theory and Applications
350
