
SIMILARITY MEASURES FUSION USING SVM CLASSIFIER FOR
FACE AUTHENTICATION
Mohammad T. Sadeghi, Masoumeh Samiei, Seyed Mohammad T. Almodarresi
Signal Processing Research Laboratory, Department of Electronics
Yazd University, Yazd, Iran
Josef Kittler
Centre for Vision, Speech and Signal Processing, School of Electronics and Physical Sciences
University of Surrey, Guildford, UK
Keywords:
Similarity measure, fusion, SVM classifier.
Abstract:
In this paper, the problems of measuring similarity in LDA face space using different metrics and fusing the
associated classifiers are considered. A few similarity measures used in different pattern recognition applica-
tions, including the recently proposed Gradient Direction (GD) metric are reviewed. An automatic parame-
ter selection algorithm is then proposed for optimising the GD metric. In extensive experimentation on the
BANCA database, we show that the optimised GD metric outperforms the other metrics in various conditions.
Moreover, we demonstrate that by combining the GD metric and seven other metrics in the decision level using
Support Vector Machines, the performance of the resulting decision making scheme consistently improves.
1 INTRODUCTION
Decision making using similarity measure or scoring
function is a usual approach to classification problem
especially when the training data is limited. A typical
example of such a case is biometric person verifica-
tion where only a few training data points are avail-
able for each individual. A similarity function, mea-
sures the degree of similarity of an unknown patterns
to the query person template. If the degree exceeds
a prespecified threshold, the unknown pattern is ac-
cepted to be the same as the query person. Otherwise
it is rejected. The similarity concept can also be used
in recognition scenarios where the unknown pattern
would be associated with that class, the template of
which is the most similar to the observed data.
Different similarity measures have been adopted
in different machine vision applications. In (Zhang
and Lu, 2003), a number of commonly used simi-
larity measures including the City-block, Euclidean,
Normalised Correlation (NC), Chi-square (χ
2
) and
Chebyschev distance have been considered in an im-
age retrieval system. The reported experimental re-
sults demonstrate that the City-block and Chi-square
metrics are more efficient in term of both retrieval ac-
curacy and retrieval efficiency. In a similar compara-
tive study, it has been shown that the Chi-square sta-
tistics measure outperforms the other similarity mea-
sures for remote sensing image retrieval (Bao and
Guo, 2004). In another study, the effect of 14 scor-
ing functions such as the City-block, Euclidean, NC,
Canberra, Chebyschev and Distance based Correla-
tion Coefficients has been studied in the context of
the face recognition problem (Perlibakas, 2004) in
the PCA space. It has been shown that a simplified
form of Mahalanobis distance outperforms the other
metrics. In (Yambor et al., 2002) also four classi-
cal distance measures, City-block, Euclidean, Nor-
malised correlation and Mahalanobis distance, have
been compared in the PCA space. It has been con-
cluded that when the number of eigenvectors is rela-
tively high the Mahalanobis distance outperforms the
other measures. Otherwise a similar performance is
achieved using different measures. It has been also
proposed that no significant improvement is achieved
by combining the distance measures.
The similarity score is computed in a suitable fea-
ture space. Commonly, similarity would be quan-
tised in terms of a distance function, on the grounds
that similar patterns will lie physically close to each
other. Thus smaller the distance, the greater the simi-
larity of two entities. The role of the feature space in
similarity measurement is multifold. First of all the
105
T. Sadeghi M., Samiei M., Mohammad T. Almodarresi S. and Kittler J. (2008).
SIMILARITY MEASURES FUSION USING SVM CLASSIFIER FOR FACE AUTHENTICATION.
In Proceedings of the Third International Conference on Computer Vision Theory and Applications, pages 105-110
DOI: 10.5220/0001087601050110
Copyright
c
SciTePress

feature space is selected so as to maximise the dis-
criminatory information content of the data projected
into the feature space and to remove any redundancy.
However, additional benefits sought after from map-
ping the original pattern data into a feature space is
to simplify the similarity measure deployed for deci-
sion making. A classical example of this is the use
of the Euclidean distance (ED) metric in Linear Dis-
criminant Analysis (LDA)feature spaces as the within
class covariance matrix in the LDA space becomes an
identity matrix and such metric becomes theoretically
optimal (Belhumeur et al., 1997). Despite the the-
oretical optimality of Euclidean metric in the LDA
space, in (Kittler et al., 2000), it has been demon-
strated that it is outperformed by the Normalised Cor-
relation (NC). However, in (Kittler et al., 2000) it has
been further demonstrated that the Gradient Direction
(GD) scoring function is even more effective.
In (Sadeghi and Kittler, 2006), the performance
of the NC scoring function was compared with the
GD metric. The study was performed on the BANCA
database
1
using an internationally agreed experimen-
tal protocols by applying a geometric face registration
method based on manually or automatically annotated
eyes positions. It was concluded that overall the NC
function is less sensitive to miss-registration error but
in certain conditions GD metric performs better.
In this study we firstly optimised the GD func-
tion by adaptively modelling the impostors distribu-
tion, result of which is that almost always the opti-
mised GD metric outperforms the NC metric for both
manually and automatically registered data. Also, al-
though the previous studies show that the NC and GD
functions outperform the other metrics, we wanted
to see if we can get any complementary information
from the other similarity functions. Therefore, in this
work, the effect of combining a few more similar-
ity/dissimilarity measures with the above mentioned
metrics has been considered. Our experimental re-
sults confirm that, individually, the other considered
metrics do not perform as good as the NC and GD
metrics in the LDA space for face verification. How-
ever, by fusing experts employing the diverse sim-
ilarity measures using the Support Vector Machine
(SVM) classifier the performance of the system im-
proves compare to any metric individually.
The paper is organised as follows. In the next
section the adopted scoring functions are introduced.
The adopted Fusion method is then briefly reviewed
in Section 3. A description of the experimental de-
sign including the face database used in the study, the
experimental protocols and the experimental setup is
given in Section 4. The experimental results using
1
http://www.ee.surrey.ac.uk/banca/
the adopted scoring functions and the fusion results
are presented and discussed in Section 5. Finally a
summary of the main findings and conclusions can be
found in Section 6.
2 SIMILARITY FUNCTIONS
In a similarity measure based face verification sys-
tem, a matching scheme measures the similarity or
distance of the test sample, x to the template of the
claimed identity, µ
i
. Note that x and µ
i
are the projec-
tions of the test sample and class mean into the fea-
ture space respectively. The general form of a group
of similarity measures which is called Minkowski Dis-
tance or power norm metrics (L
p
) is defined as:
s
M
=
m
∑
j=1
(µ
i
j
− x
j
)
p
1/p
(1)
where m is the dimensionality.
The most commonly used similarity measures,
Manhattan or City-block metric, Euclidean Distance
(ED) and Chebyschev Distance are derived from the
above definition considering p = 1, p = 2 and p → ∞
respectively , i.e. L
1
, L
2
and L
∞
metrics:
s
City
=
m
∑
j=1
µ
i
j
− x
j
(2)
s
ED
=
q
(x− µ
i
)
T
(x− µ
i
) (3)
s
Cheby
= max
j
µ
i
j
− x
j
(4)
The Canberra Distance is also given by
s
Canb
=
m
∑
j=1
µ
i
j
− x
j
µ
i
j
+
x
j
(5)
This can be considered as the normalised Manhattan
Distance. The Chi-squared (χ
2
) Distance is defined
by
s
χ
2
=
m
∑
j=1
(µ
i
j
− x
j
)
2
µ
i
j
+
x
j
(6)
Which is basically a relative Euclidean squared dis-
tance and is usually meant for non negative variables
only.
In (Kittler et al., 2000), it has been demonstrated
that a matching score based on Normalised Correla-
tion (NC) scoring function, defined by Equation 7, is
more efficient.
s
N
=
||x
T
µ
i
||
q
x
T
xµ
T
i
µ
i
(7)
VISAPP 2008 - International Conference on Computer Vision Theory and Applications
106

Another similarity measure which is conceptually
same as the NC function is Distance based Correla-
tion Coefficients. For more details, the reader is re-
ferred to (Perlibakas, 2004).
In (Kittler et al., 2000) and (Sadeghi and Kittler,
2004) an innovate metric called the Gradient Direc-
tion (GD) metric has been proposed. In this method
the distance between a probe image and a model is
measured in the gradient direction of the aposteriori
probability of the hypothesised client identity. A mix-
ture of Gaussian distributions with Isotropic covari-
ance matrix has been assumed as the density function
of the possible classes of identity. The Isotropic co-
variance matrix assumed to have a variance of the or-
der of the variation of the image data in the feature
space. It was demonstrated that applying GD metric
is even more efficient than the NC function. The pro-
posed optimal matching score is defined as
s
O
=
||(x− µ
i
)
T
∇
O
P(i|x)||
||∇
O
P(i|x)||
(8)
where ∇
O
P(i|x) refers to the gradient direction. Con-
sidering an isotropic structure for the covariance ma-
trix, i.e. Σ = σI,the optimal direction would be
∇
I
P(i|x) =
m
∑
j = 1
j 6= i
p(x| j)(µ
j
− µ
i
) (9)
Note that the magnitude of the σ will affect the direc-
tion through the values of density p(x| j).
3 SIMILARITY SCORES FUSION
One of the most exciting research directions in the
field of pattern recognition and computer vision is
classifier fusion. It has been recognised that the clas-
sical approach to designing a pattern recognition sys-
tem which focuses on finding the best classifier has
a serious drawback. Any complementary discrimina-
tory information that other classifiers may capture is
not tapped. Multiple expert fusion aims to make use
of many different designs to improvethe classification
performance. In the case considered here, as differ-
ent metrics span the feature space in different ways, it
seems reasonable to expect that a better performance
could be obtained by combining the resulting clas-
sifiers. In different studies, it has been shown that
the SVM classifier is among the best trained fusion
rules. A Support Vector Machine is a two-class clas-
sifier showing superior performance to other meth-
ods in terms of Structural Risk Minimisation (Vap-
nik, 1995). In this study, decision level fusion strat-
egy using the SVMs has been adopted for combining
the similarity measure based classifiers.
For the face verification problem, the size of the
training set for clients is usually less than the one for
impostors. In such a case, the class of impostors is
represented better. Therefore, it is necessary to shift
the optimal hyperplane of the SVM classifier towards
the better represented class (Seredin et al., 2001). In
this work, the size of the shift is determined in the
evaluation step considering the Equal Error Rate cri-
terion.
4 EXPERIMENTAL DESIGN
In this section the face verification experiments car-
ried out on images of the BANCA database are de-
scribed. The BANCA database is briefly introduced
first. The main specifications of the experimental
setup are then presented.
4.1 BANCA Database
The BANCA database has been designed in order
to test multi-modal identity verification systems de-
ploying different cameras in different scenarios (Con-
trolled, Degraded and Adverse). The database has
been recorded in several languages in different coun-
tries. Our experiments were performed on the English
section of the database. Each section contains 52 sub-
jects (26 males and 26 females). Experiments can be
performed on each group separately.
Each subject participated to 12 recording sessions
in different conditions and with different cameras.
Sessions 1-4 contain data under Controlled conditions
whereas sessions 5-8 and 9-12 contain Degraded and
Adverse scenarios respectively. In order to create
more independent experiments, images in each ses-
sion have been divided into two groups of 26 subjects
(13 males and 13 females).
In the BANCA protocol, 7 different distinct exper-
imental configurations have been specified, namely,
Matched Controlled (Mc), Matched Degraded (Md),
Matched Adverse (Ma), Unmatched Degraded (Ud),
Unmatched Adverse (Ua), Pooled test (P) and Grand
test (G). Table 1 describes the usage of the different
sessions in each configuration. “T” refers to the client
training while “C” and “I” depict client and impostor
test sessions respectively.
4.2 Experimental Setup
The performance of different decision making meth-
ods discussed in section 2is experimentally evaluated
SIMILARITY MEASURES FUSION USING SVM CLASSIFIER FOR FACE AUTHENTICATION
107
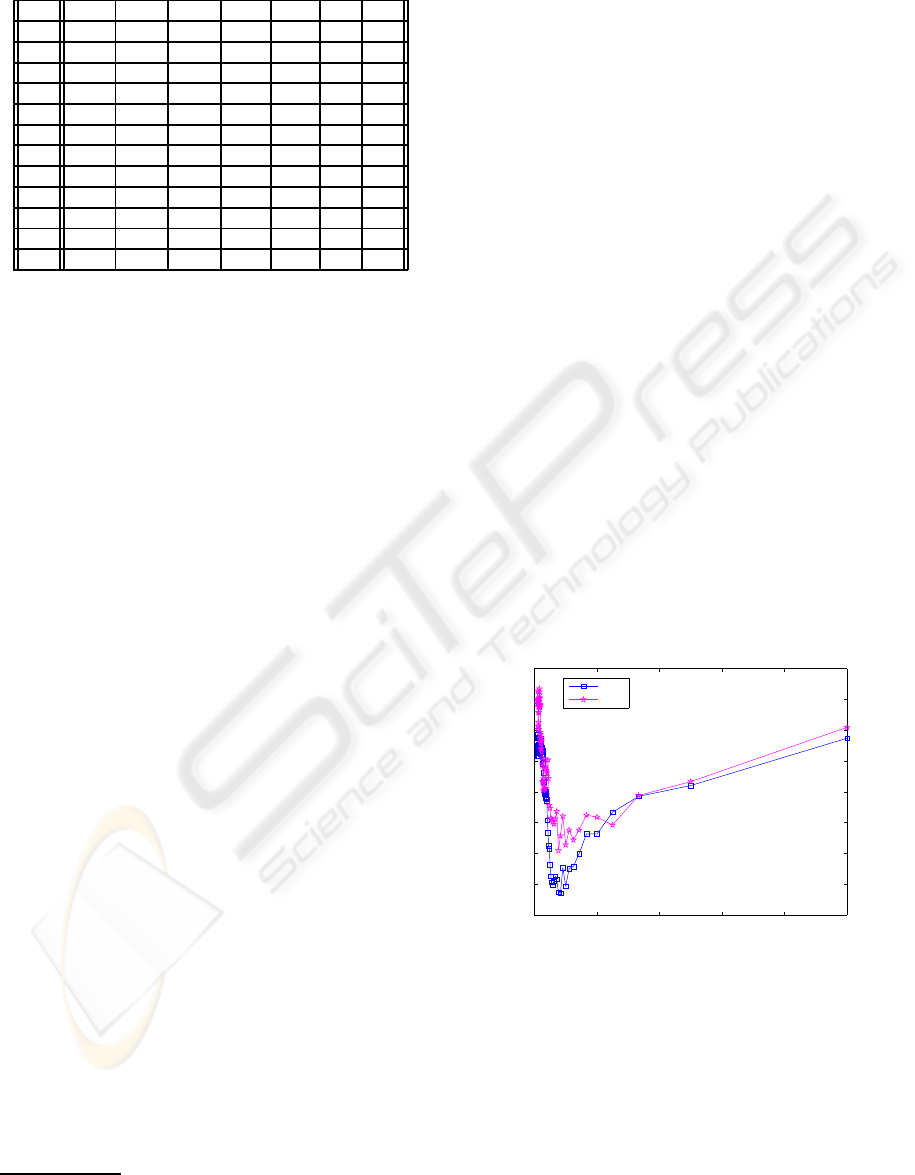
Table 1: The usage of the different sessions in the BANCA
experimental protocols.
MC MD MA UD UA P G
1 TI T T TI TI
2 CI CI CI
3 CI CI CI
4 CI CI CI
5 TI I I TI
6 CI CI CI CI
7 CI CI CI CI
8 CI CI CI CI
9 TI I I TI
10 CI CI CI CI
11 CI CI CI CI
12 CI CI CI CI
on the BANCA database using the configurations dis-
cussed in the previous section. The evaluation is per-
formed in the LDA space. The original resolution of
the image data is 720× 576. The experiments were
performed with a relatively low resolution face im-
ages, namely 64 × 49. The results reported in this ar-
ticle have been obtained by applying a geometric face
normalisation based on the eyes positions. The eyes
positions were localised either manually or automati-
cally. A fast method of face detection and eyes locali-
sation was used for the automatic localisation of eyes
centre (Hamouz et al., 2005). The XM2VTS database
2
was used for calculating the LDA projection matrix.
The thresholds in the decision making system
have been determined based on the Equal Error Rate
criterion, i.e. by the operating point where the false
rejection rate (FRR) is equal to the false acceptance
rate (FAR).The thresholds are set either globally (GT)
or using the client specific thresholding (CST) tech-
nique (Sadeghi and Kittler, 2004). In the training
sessions of the BANCA database 5 client images per
person are available. In the case of global threshold-
ing method, all these images are used for training the
clients template. The other group data is then used
to set the threshold. In the case of the client specific
thresholding strategy, only two images are used for
the template training and the other three along with
the other group data are used to determine the thresh-
olds. Moreover, in order to increase the number of
data used for training and to take the errors of the geo-
metric normalisation into account, 24 additional face
images per each image were generated by perturbing
the location of the eyes position around the annotated
positions.
In the previous studies (Sadeghi and Kittler,
2004), it was demonstrated that the Client Specific
Thresholding (CST) technique was superior in the
2
http://www.ee.surrey.ac.uk/Research/VSSP/xm2vtsdb/
matched scenario (Mc, Md, Ma and G) whereas the
Global Thresholding (GT) method gives a better per-
formance on the unmatched protocols. The results
reported in the next section using thresholding were
acquired using this criterion.
Also, the SVM classifier has been used in order
to fuse the classifiers employing the diverse similarity
measures.
5 EXPERIMENTAL RESULTS
AND DISCUSSION
As mentioned earlier, in the GD metric, the impos-
tor distributions have been approximated by isotropic
Gaussian functions with a standard deviation of σ, i.e.
Σ = σI. The order of σ is related to the order of the
standard deviation of the input data (gray level val-
ues in the LDA feature space). In the previous work
(Sadeghi and Kittler, 2006) a fixed value equal to 10
4
has been used for σ. In this work, in order to optimise
the metric for dealing with different imaging condi-
tions, the value of σ is adaptively determined in the
evaluation step where the performance of the system
considering different values of σ is evaluated. As two
examples for matched and un-matched protocols, fig-
ure 1 contain plots of the Total Error rate versus the
value of σ in the evaluation and test steps considering
the Ud protocol.
0 2 4 6 8 10
x 10
5
24
25
26
27
28
29
30
31
32
Protocol Ud
Sigma
Total Error
TERE
TERT
Figure 1: The performance of the GD metric versus the
value of σ considering Ud protocol.
The evaluation plots show that by increasing the
value of σ, the TE rate first rapidly decreases. Then,
for larger values of σ, the TE rate remains relatively
constant or increases gradually. From these plots, one
can also see that the behaviour of the system in the
evaluation and test stages is almost consistent. There-
fore, the optimum σ can be found in the evaluation
VISAPP 2008 - International Conference on Computer Vision Theory and Applications
108

step by looking for the point after which the perfor-
mance of the system is not significantly improved by
increasing the value of σ. The associated value of σ
is then used in the test stage.
Tables 2 contains a summary of the results ob-
tained using the individual scoring function on the
evaluation and test sets when manually annotated eyes
position were used for the face geometric normalisa-
tion. The values in the table indicate the Total Error
rates in the Evaluation (TEE) and Test (TET) stages
respectively. For the sake of simplicity of compar-
ison, the evaluation and test results have been also
shown in figures 2(a) and (b) respectively.
These results clearly demonstrate that among the
adopted metric, individually,the GD metric is the out-
right winner. In a few cases, the NC results is com-
parable to the GD one. The performance of the other
metrics is much worse.
Plots (b) and (c) of the figure 2 demonstrate a sum-
mary of the results when the face registration step was
performed based on automatically localised eyes po-
sition. These results also confirm that the GD met-
ric is again the best scoring function for this applica-
tion. A comparison of the GD results and the results
of the similar experiments reported in (Sadeghi and
Kittler, 2006)using the basic form of the GD metric
shows that by optimising the GD metric as discussed,
the problem of sensitivity of this metric to the miss-
registration error is reduced so that the optimised GD
metric outperforms the NC function for both manu-
ally the automatically registered data.
In the next step, the problem of combining classi-
fiers derived from different similarity measures was
considered. We adopted the decision level fusion
strategy using the SVMs in order to combine the de-
signed classifiers. Table 3 contains the combined veri-
fication results using manually and automatically reg-
istered data. These results demonstrate that a better
performance is achieved using the combined method
especially on Mc and G protocols.
6 CONCLUSIONS
The problem of measuring similarity in LDA face
space and fusing the resulted classifiers were consid-
ered. It was shown that the optimised Gradient Direc-
tion metric outperforms the other metrics in different
conditions considering both manually and automati-
cally registered data. It was also demonstrated that the
performance of the verification system can be further
improved by fusing the adopted similarity measures
in the decision level using the SVM classifier.
ACKNOWLEDGEMENTS
The financial support from the Iran Telecommuni-
cation Research Centre is gratefully acknowledged.
A partial support from the Engineering and Physical
Sciences Research Council (EPSRC), Research Grant
GR/S46543 is also gratefully acknowledged.
REFERENCES
Bao, Q. and Guo, P. (2004). Comparative studies on simi-
larity measures for remote sensing image retrieval. In
IEEE International Conference on Systems, Man and
Cybernetics.
Belhumeur, P., Hespanha, J., and Kriegman, D. (1997).
Eigenfaces vs. Fisherfaces: Recognition using class
specific linear projection. IEEE Trans. on Pattern
Recognition and Machine Intelligence, 19(7):711–
720.
Hamouz, M., Kittler, J., Kamarainen, J.-K., Paalanen, P.,
Kalviainen, H., and Matas, J. (2005). Feature-based
affine-invariant localization of faces. IEEE Transac-
tions on Pattern Analysis and Machine Intelligence,
27(9):1490–1495.
Kittler, J., Li, Y. P., and Matas, J. (2000). On matching
scores for LDA-based face verification. In Mirmehdi,
M. and Thomas, B., editors, Proceedings of British
Machine Vision Conference 2000, pages 42–51.
Perlibakas, V. (2004). Distance measures for pca based face
recognition. Pattern Recognition letters, 25(6).
Sadeghi, M. and Kittler, J. (2004). Decision making in the
LDA space: Generalised gradient direction metric. In
the 6th International Conference on Automatic Face
and Gesture Recognition, pages 248–253, Seoul, Ko-
rea.
Sadeghi, M. and Kittler, J. (2006). Confidence based gat-
ing of multiple face authentication experts. In Joint
IAPR International Workshops on Syntactical and
Structural Pattern Recognition and Statistical Pattern
Recognition, S+SSPR 2006, pages 667–676, Hong
Kong, China.
Seredin, O., Kostin, A., Kittler, J., and Mottl, V. (2001).
Leave-one-out procedure for finding discriminant
function threshold in machine learning by support
vector method. In Proceedings of 10th conference
on Mathematical Methods of Pattern Recognition,
MMRO-10, pages 128–131.
Vapnik, V. (1995). The Nature of Statistical Learning The-
ory. Springer-Verlag, New York.
Yambor, W., Draper, B., and Beveridge, J. (2002). Analyz-
ing pca-based face recognition algorithm: Eigenvector
selection and distance measures. In Christensen, H.,
Phillips, J. (Eds.), Empirical Evaluation Methods in
Computer Vision. World Scientific Press, Singapore.
Zhang, D. and Lu, G. (2003). Evaluation on similarity mea-
surement for image retrieval. Neural Network and Sig-
nal Processing, 2.
SIMILARITY MEASURES FUSION USING SVM CLASSIFIER FOR FACE AUTHENTICATION
109
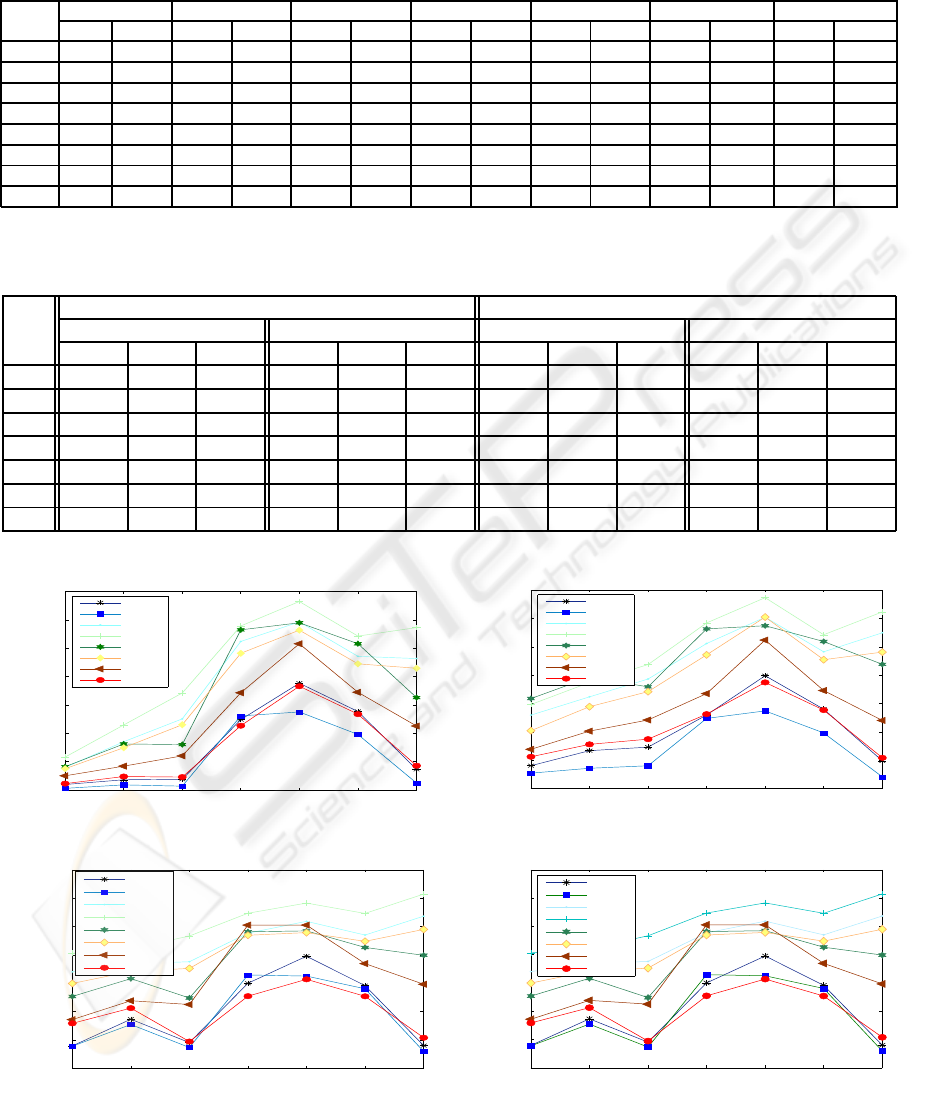
Table 2: ID verification results using different scoring functions with Global and Client Specific Thresholding techniques for
unmatched and matched protocols respectively. TEE: Total Error rate Evaluation and TET: Total Error rate Test.
Mc Md Ma Ud Ua P G
TEE TET TEE TET TEE TET TEE TET TEE TET TEE TET TEE TET
NC 1.93 8.08 3.57 13.36 3.79 14.61 24.81 25.93 37.63 38.81 27.69 28.01 7.26 9.75
GD 0.60 4.87 1.77 7.18 1.55 8.03 26.09 24.74 27.5 27.40 19.56 19.64 2.43 4.12
ED 7.97 25.89 17 32.34 25.06 38.62 52.37 51.15 59.26 60.42 47.12 48.22 46.33 54.93
City 11.6 29.65 22.9 37.4 34.17 43.71 57.82 58.4 66.44 67.3 54.25 54.25 57.24 62.26
Cheb 8.2 31.73 16.22 39.23 16 35.86 56.44 56.3 58.94 57.41 51.56 51.85 32.54 43.79
χ
2
7.49 20.41 14.88 28.88 22.99 34.17 48.17 47.15 56.35 60.48 44.46 45.45 42.91 48.12
Corr 2.25 11.22 4.74 15.6 4.54 17.43 22.66 26.25 36.57 37.44 34.44 34.54 8.02 10.85
Canb 5 13.85 8.69 20.25 12.01 24.2 34.26 33.5 51.54 52.37 26.74 27.69 22.54 24.04
Table 3: ID verification results on BANCA protocols considering SVMs for combining classifiers derived from different
metrics, manual registration(left) and automatic registration (right).
Manual Registration Automatic Registration
Evaluation Test Evaluation Test
FAR FRR TER FAR FRR TER FAR FRR TER FAR FRR TER
Mc 0.96 1.03 1.99 0.86 1.54 2.4 8.17 8.2 16.37 5.96 9.36 15.32
Md 3.75 3.85 7.6 2.98 3.97 6.95 8.36 8.46 16.82 12.79 6.28 19.07
Ma 2.4 2.31 4.71 3.65 5.27 8.92 5.57 5.51 11.08 2.02 15.9 17.92
Ud 9.61 9.61 19.22 10.38 13.46 23.84 13.46 13.46 26.92 15.09 15 30.09
Ua 12.88 13.08 25.96 16.63 10.39 27.02 17.88 17.82 35.7 28.17 23.08 51.25
P 8.87 8.85 17.72 9.29 9.06 18.35 15.64 15.6 31.24 14.33 16.62 30.95
G 1.54 1.54 3.08 1.31 1.84 3.15 7.05 7.05 14.1 7.53 8.76 16.29
1 2 3 4 5 6 7
0
10
20
30
40
50
60
70
Mc Md Ma Ud Ua P G
TEE
NC
GD
ED
City
Cheby
KAY
Canb
Corr
(a) Evaluation (Manual registration)
1 2 3 4 5 6 7
0
10
20
30
40
50
60
70
Mc Md Ma Ud Ua P G
TET
NC
GD
ED
City
Cheby
KAY
Canb
Corr
(b) Test (Manual registration)
1 2 3 4 5 6 7
10
20
30
40
50
60
70
80
Mc Md Ma Ud Ua P G
TEE
NC
GD
ED
City
Cheby
KAY
Canb
Corr
(c) Evaluation (Automatic registration)
1 2 3 4 5 6 7
10
20
30
40
50
60
70
80
Mc Md Ma Ud Ua P G
TET
NC
GD
ED
City
Cheby
KAY
Canb
Corr
(d) Test (Automatic registration)
Figure 2: ID verification results using different scoring functions with Global and Client Specific Thresholding techniques for
unmatched and matched protocols respectively.
VISAPP 2008 - International Conference on Computer Vision Theory and Applications
110
