
IMAGE RE-SEGMENTATION
A New Approach Applied to Urban Imagery
Thales Sehn Korting, Leila Maria Garcia Fonseca, Luciano Vieira Dutra and Felipe Castro da Silva
National Institute for Space Research (INPE), Av. dos Astronautas, 1758 – São José dos Campos, Brazil
Keywords:
Graph Based Segmentation, Re-Segmentation, Urban Imagery, Remote Sensing.
Abstract:
This article presents a new approach for image segmentation applied to urban imagery. The proposed method
is called re-segmentation because it uses a previous over-segmented image as input to generate a new set of
objects more adequate to the application of interest. For urban objects such as roofs, building and roads,
the algorithm tries to generate rectangular objects by merging and cutting operations in a weighted Region
Adjacency Graph. Objects whose union generate larger regular objects are merged or otherwise cut. In order
to verify the potential of the method, two experimental results using Quickbird images are presented.
1 INTRODUCTION
Segmentation is an important operation in various
image processing and computer vision applications,
since it represents the first step of low-level process-
ing of an image. Many approaches have been pro-
posed in the literature (Lucchese and Mitra, 2001).
However, just some of them have been applied to ur-
ban scenes, although most of them do not take into
account the object shape information.
(Chen et al., 2006) define segmentation as parti-
tioning of an image into a subset of fairly homoge-
neous closed cells. Here we refer to “closed cells”
as regions or objects. Each region must have its own
characteristics such as spectral variability, shape, tex-
ture, and context, which can be distinguished from its
adjacent neighbors. Several algorithms use mainly the
region spectral properties to segment an image. More
elaborated approaches also deal with contextual and
multiscale segmentation (Baatz and Schäpe, 2000).
The details in a high resolution image holds its
spectral variability and may decrease the segmenta-
tion accuracy when traditional segmentation methods
are used. In urban scenes, one can observe that regu-
lar shapes such as rectangles can efficiently represent
the structure of a street, or a roof, for instance.
Therefore, this paper aims to present a novel ap-
proach for high resolution image segmentation. The
proposed methodology takes into account shape at-
tributes besides the spectral ones to produce more ac-
curate segmentation.
This paper is organized as follows. Section
2 presents a brief segmentation review focusing to
graph-based approaches and some aspects related to
urban imagery. Section 3 presents the proposed
method nemed re-segmentation. We also describe
how to build a Region Adjacency Graph and discuss
the procedure to find regular shapes on it. Finally,
some results and conclusion are shown in Section 4
and Section 5, respectively.
2 SEGMENTATION BASED ON
GRAPH
The proposed segmentation method is called re-
segmentation because its input is a previously over-
segmented image and a merging strategy is applied
to generate a new regions set. Methods such as wa-
tershed (Duarte et al., 2006; Felzenszwalb and Hut-
tenlocher, 2004; Tremeau and Colantoni, 2000) and
region growing (Bins et al., 1996) can be used to pro-
duce the input segmentation. Spectral properties of
the regions are also input data and each region can be
connected to its neighbors when succeeding topologi-
cal operation “touch” (Egenhofer and Franzosa, 1991)
is applied. Such connections are stored in an undi-
rected graph and the distance between the nodes, also
called weights, is defined by the difference of their
attributes.
Subsequently, a graph processing stage is per-
formed. Connected regions are merged when their at-
467
Sehn Korting T., Garcia Fonseca L., Vieira Dutra L. and Castro da Silva F. (2008).
IMAGE RE-SEGMENTATION - A New Approach Applied to Urban Imagery.
In Proceedings of the Third International Conference on Computer Vision Theory and Applications, pages 467-472
DOI: 10.5220/0001088104670472
Copyright
c
SciTePress
tribute values are similar. The graph is built in a struc-
ture called Region Adjacency Graph (RAG) (Schet-
tini, 1993). The strategy used to join the nodes is
the principal characteristic of our re-segmentation ap-
proach, discussed with more detail in Section 3.
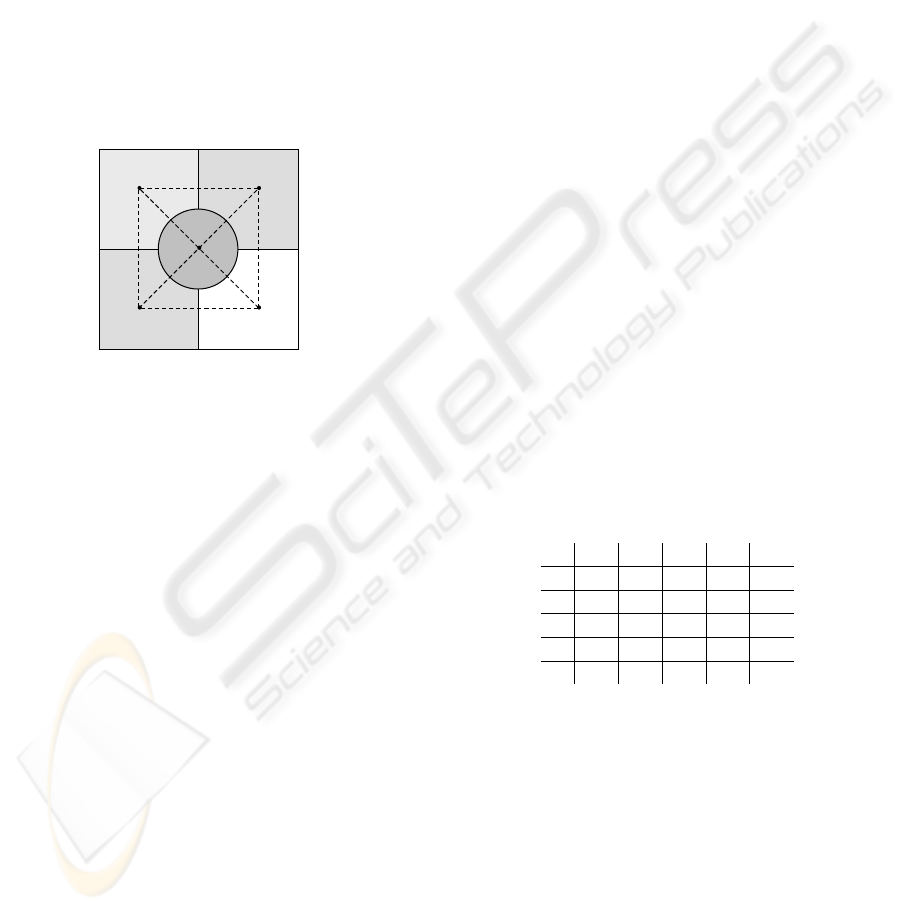
2.1 Region Adjacency Graph
A Region Adjacency Graph is a data structure which
provides spatial view of an image. One way to un-
derstand the RAG structure is to associate a vertex at
each region and an edge at each pair of adjacent re-
gions (Tremeau and Colantoni, 2000). Figure 1 de-
picts a simple RAG of a synthetic image.
1
2
3
4
5
Figure 1: RAG example – Image with 5 regions and their
connections.
The RAG can be covered, merged, and partitioned
in different manners in accord with the expected re-
sults. For example, (Tremeau and Colantoni, 2000)
cover the graph and join a regions set (or vertices) if
its spectral distance is enough small. In this case, the
graph weights correspond to each region mean value.
(Duarte et al., 2006) use the so called hierarchical so-
cial metaheuristic for the merging operation, which is
based on human social behavior. First of all, the re-
gions are joined in a randomly way generating a set of
solutions controlled by groups of objective functions.
Iteratively, each group tries to improve its objective in
a cooperative fashion or competing with the neighbor
groups. The ambivalence between social cooperation
and competition aims to maximize the quality of the
results.
In the other hand, (Lezoray et al., 2003) apply a
preprocessing stage to smooth the RAG at each region
before merging similar regions. This stage is iterated
until the RAG satisfies some stop criterion such as the
number of iterations or some similarity threshold. Us-
ing a nonlinear function, they perform smoothing op-
eration over the iterations taking into account the re-
gions spectral attributes and connected region neigh-
bors.
Here, we propose a new merging strategy in the
RAG structure. The regions are merged if they are
similar in respect to their spectral attributes (e.g.
mean and variance) and if the resultant shape (after
merging operation) is regular. In order to carry out
this task, firstly, the regions are divided taking into
account their classes. In case of urban environment,
the classes can be buildings, streets, and trees. There-
fore, the regions are classified and several RAG are
built through connecting adjacent regions which be-
long to the same class. Afterward, the algorithm per-
form the graph searching and merging operations for
every classes. The knowledge about the class im-
proves the segmentation accuracy because each class
has specific shape regularity measure.
2.2 RAG Construction
Let be an image I and a group of M regions, P
i
, i =
1, . . . M, with
S
P
i
= I. Let be a graph, G =< V, E >,
where V = {1, . . . M} is the set of nodes and E ⊂
V × V is the set of edges or links between adjacent
regions. In the graph notation, each region P
i
matches
one vertex so that P
i
= V
i
, i = 1, . . . M.
Each region is a vertex V
i
. Adjacent regions have
the weights defined by some spectral distance mea-
sure. Table 1 depicts the graph generated from Figure
1. Here, the weights are given by the mean differ-
ences between connected nodes. Weights denoted by
-1 means that there is not topological connection be-
tween the nodes.
Table 1: Graph generated from Figure 1.
1 2 3 4 5
1 0 20 30 30 -1
2 20 0 40 -1 20
3 30 40 0 60 30
4 30 -1 60 0 30
5 -1 20 30 30 0
3 RE-SEGMENTATION
APPROACH
The proposed re-segmentation approach is based on
the RAG construction. The graph is built taking into
account the topological relation “touch” between the
regions of same class. Therefore, if two regions are
connected, i.e. touch each other, they are candi-
date to be graph nodes. In order to perform the re-
segmentation the RAGs are preprocessed. This pre-
processing stage includes the procedure to find the
VISAPP 2008 - International Conference on Computer Vision Theory and Applications
468
graph minimal-cost paths. However, it is necessary
to know the class of each region. If urban objects
samples (trees, roads, buildings) are provided the al-
gorithm can treat them conform with their own prop-
erties. Another important parameter is the object reg-
ularity used to merge the regions. For instance, roads
and trees can be assigned to rectangular and irregular
shapes, respectively, in the merging operation.
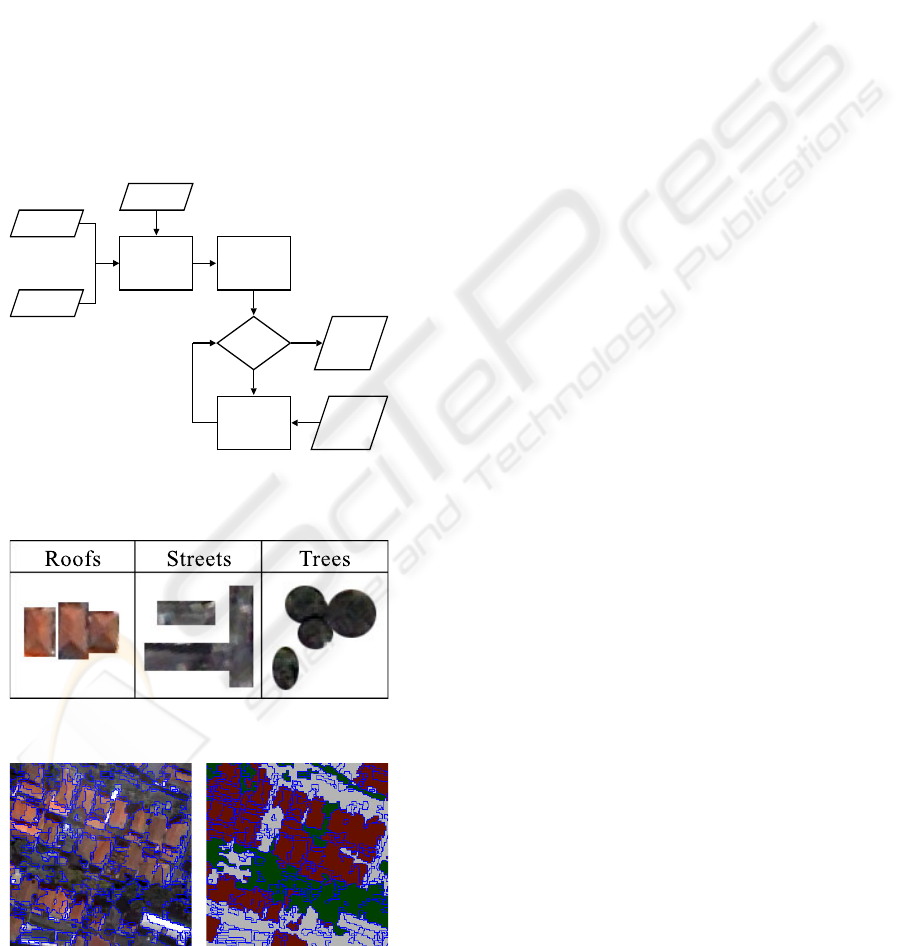
Figure 2 shows the diagram of our re-
segmentation approach. Based on input patterns, as
those shown in Figure 3, it is possible to define differ-
ent strategies to merge the regions. Our objective is to
merge regions so that new larger regular objects are
obtained. For objects with irregular shapes, similar
regions are merged based on previous classification
and their spectral attributes. The process finishes
when there is no more regions to merge.
Regions
Images
RAG's
Construction
Pattern
Classification
Patterns
Graph
Search
More
Regions?
a priori
Knowledge
Resultant
Regions
yes
no
Figure 2: The re-segmentation diagram.
TreesStreetsRoofs
Figure 3: Input Patterns.
(a) (b)
Figure 4: Pattern classification: a) input regions, b) classi-
fied regions.
3.1 Pattern Classification
The pattern classification procedure is a very impor-
tant task in our approach. It reduces the attribute
space and allows the algorithm to work with few data
in the process of finding out regular shapes. In this
stage, similar regions are merged for further process-
ing.
Firstly, a supervised classification is performed in
order to classify the regions in accord with their pat-
tern. Figure 4 presents a resultant classification using
the Self Organizing Maps (Kohonen, 2001) and the
three classes depicted in the Figure 3. After the clas-
sification, the RAGs are built by connecting adjacent
regions belonging to the same class. Finally, the next
stage tries to find the best way to connect the graphs,
to cut or merge the nodes so that the resultant regions
have better shape regularity.
3.2 Minimun-Cost Path
Several scientific problems related to connected el-
ements can be associated to the general problem of
finding a path through a graph (Hart et al., 1968). It
provides a structure whose nodes are connected to one
or more neighboring regions.
Several algorithms to find the minimum-cost path
in a RAG have been proposed in the literature (Falcão
et al., 2004; Shi and Malik, 2000). A minimum-cost
path is a set of edges that connects all nodes in a graph
without cycles. As this graph connects all regions be-
longed to the same class, a minimum-cost path repre-
sents the best way to find the cuts.
Regarding the urban imagery, the graph edges rep-
resent the regularity measures of the regions obtained
by the union of two or more sub-regions. The prob-
lem is to find out which regions must be merged or
not. Next section, we will discuss about the param-
eter Q that indicates how rectangular a region is, in-
dependently of rotation and scale. The objective is
to merge regions to generate new objects with shapes
more appropriate to urban objects.
The following algorithm summarizes the pro-
posed approach shown in Figure 2:
Get input over-segmented images;
Classify the regions (identify the
classes);
Build RAGs for adjacent objects of same class;
For each RAG, find the best merging arrangement:
| Find minimal-cost path;
| Calculate regularity measure;
| Perform path cuts;
| Merge connected nodes;
Return resultant regions.
IMAGE RE-SEGMENTATION - A New Approach Applied to Urban Imagery
469
3.3 Rectangular Objects Generation
Some good examples of rectangular regions for urban
imagery are roofs and streets. However, in some cases
the segmented objects do not preserve such rectangu-
lar shape; they are broken apart into smaller irregu-
lar objects. Therefore, our aim is to join such over-
segmented regions.
In order to identify the object rectangularity de-
gree we calculate the ratio between its area AREA(P
i
)
and its bounding box area AREA(BOX (P
i
)). Due
to the rotation, this measure can not correctly repre-
sent the object regularity. Thus, a preprocessing step
is performed in order to transform the retangularity
measure invariant to rotation.
Given an object P
i
and its internal points coordi-
nates C = {{x, y}|{x, y} ∈ P} the eigenvectors are cal-
culated. Taking the first eigenvector the main angle of
P
i
, α is obtained. Thus, a new region R
i
with bound-
ing box BOX(R
i
) is created by rotating it in relation
to the angle α. Afterward, the unbiased parameter Q
is obtained as following:
Q =
AREA(R
i
)
AREA(BOX(R
i
))
(1)
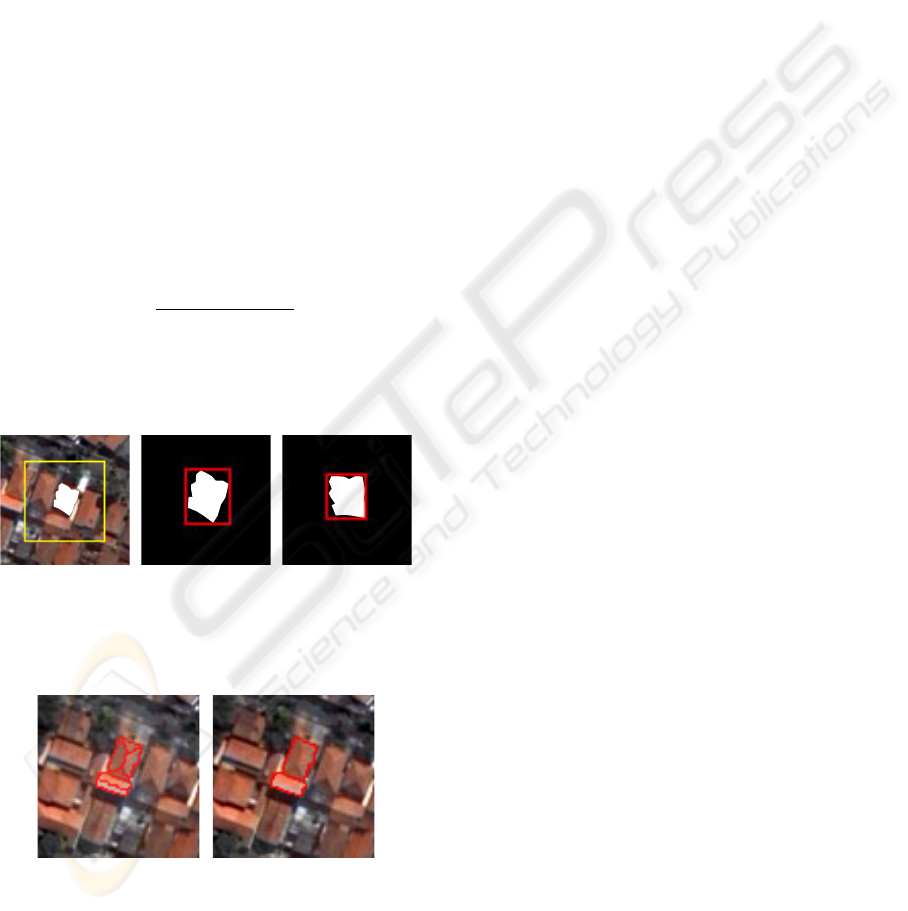
The range of Q is [0, 1]. The more rectangular the
object P
i
, the closer to 1 is the parameter Q. Figure 5
shows an example of a rectangular object with Q ≈ 1.
(a)
(b) (c)
Figure 5: Rectangular objects identification: a) input re-
gion, b) the region and its bounding box, c) the rotated re-
gion and its new bounding box and Q ≈ 1.
(a) (b)
Figure 6: Objects merging process: a) Connected re-
gions, b) re-segmentation taking into account the rectangu-
lar shaped regions.
At this stage, the algorithm aims to find rectangu-
lar objects. If irregular objects are found, two opera-
tions are performed: cutting and merging. The objec-
tive of these operations is to generate regions whose
parameter Q is about 1. As we can observe in Figure
6, some regions belonging to the same class can be
split into smaller regions instead of being merged in
the initial segmentation process. These are the main
problem that our algorithm proposes to solve.
4 PRELIMINARY RESULTS
This Section presents some experimental results ob-
tained by our re-segmentation approach. The method
was tested for Quickbird images of urban regions.
For the first experiment, a segmented image superim-
posed on the original image (300 × 250 pixels), some
connected nodes (represented in different colors) and
the resultant re-segmentation are shown in Figures 7a,
7b and 7c, respectively. The over-segmentation was
obtained by the region growing method implemented
in SPRING (Câmara et al., 1996). In Figure 7c we ob-
serve that some regions did not merge although they
look like spectrally similar. This is due to the fact
that the approach aims to merge only those regions
which originate rectangular objects. Other merging
or cutting operations that originate irregular objects
are not performed. Consequently, the segmentation
gets more adequate results. In this case, the algorithm
took 37 seconds to generate the re-segmentation.
The second experiment took an image (256 ×256
pixels) as shown in Figure 8. Figures 8a and 8b dis-
play the regions superimposed on the original image
and the resultant re-segmentation, respectively. The
over-segmentation also was obtained by the region
growing method implemented in SPRING. The im-
age presents several instances of roofs that are broken
apart in the segmentation process as shown in Figure
7a. It is important to emphasize that the segmentation
is the key step for further image analysis. After apply-
ing our approach, posterior stages of image recogni-
tion or even geographical tasks can be more accurate
or adequate to the application. In spite of using small
image in this experiment, the number of input over-
segmented regions is very high. In this case, the algo-
rithm spent 216 seconds to accomplish the complete
re-segmentation process.
5 CONCLUSIONS
A new approach for image re-segmentation and some
aspects of its implementation have been described.
Moreover, in order to show the potential of our ap-
proach two experimental results have been presented.
VISAPP 2008 - International Conference on Computer Vision Theory and Applications
470
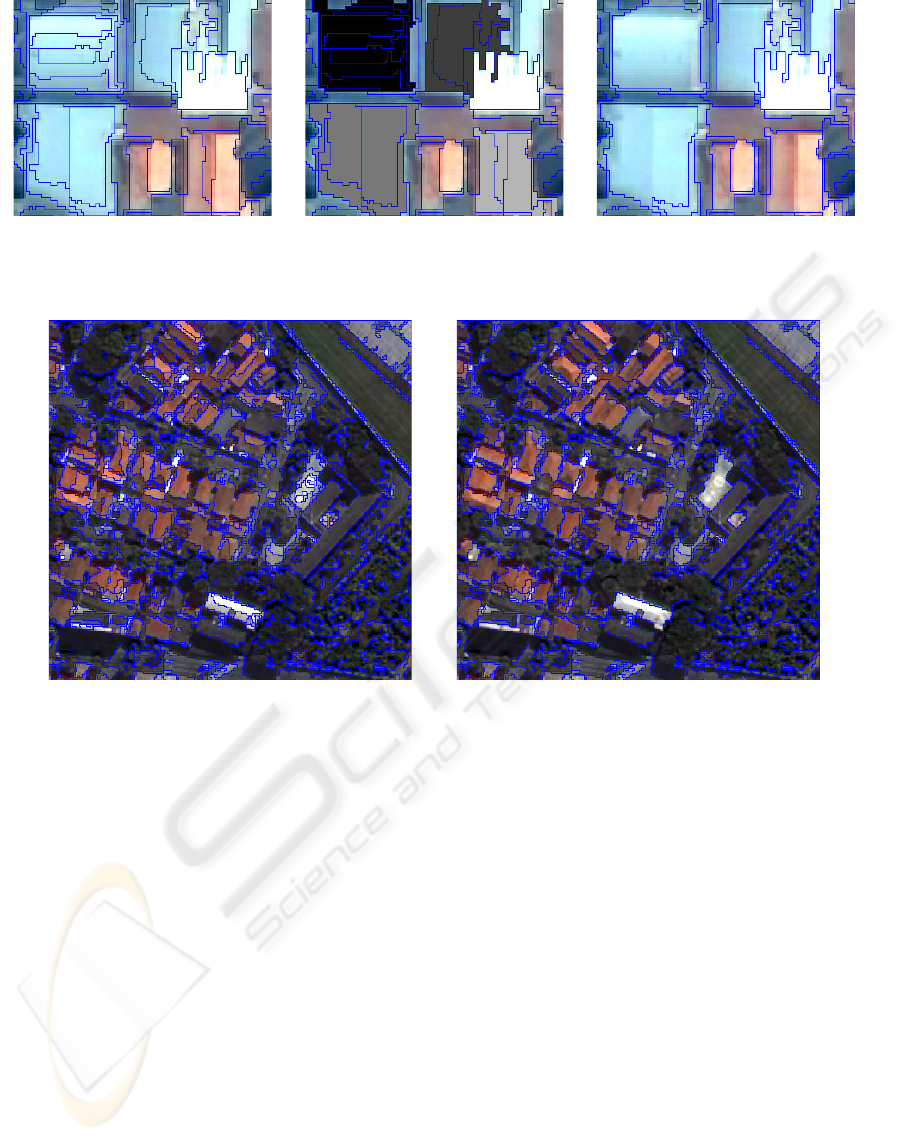
(a) (b) (c)
Figure 7: Image re-segmentation: a) regions superimposed on the image, b) some regions connected in the RAG, c) final
re-segmentation.
(a) (b)
Figure 8: Urban image re-segmentation: a) Regions superimposed on the image and b) final re-segmentation.
The main contribution of this paper is the proposed
strategy to find regular regions in the urban imagery.
The re-segmentation approach uses spectral and shape
attributes as well the thematic map to define the merg-
ing and cutting strategies in the RAGs.
The algorithm complexity including the graph
searching operation is O(n
2
). One way to improve its
performance is generating a Minimum Spanning Tree
(MST) before the graph searching procedure. Nev-
ertheless, the MST generation has also a high cost.
Therefore, research have to be done to find out the at-
tributes set used to find the MST, which is not a trivial
task.
The algorithm has been developed in the Free C++
Library called TerraLib (Câmara et al., 2000) avail-
able at http://www.terralib.org/. Preliminary
results presented in this paper still have some errors
mainly due to the input segmentation. This process,
in certain cases, merges some objects that should be
broken apart. Future works include the algorithm op-
timization for faster execution and implementation of
different approaches for the graph cutting operation.
ACKNOWLEDGEMENTS
The authors thank National Council for Scientific
and Technological Development – CNPq for research
funding.
REFERENCES
Baatz, M. and Schäpe, A. (2000). Multiresolution
Segmentation–an optimization approach for high
quality multi-scale image segmentation. Ange-
wandte Geographische Informationsverarbeitung XII,
Wichmann-Verlag, Heidelberg, 12:12–23.
Bins, L., Fonseca, L., Erthal, G., and Ii, F. (1996). Satel-
lite imagery segmentation: a Region Growing ap-
IMAGE RE-SEGMENTATION - A New Approach Applied to Urban Imagery
471

proach. Simpósio Brasileiro de Sensoriamento Re-
moto, 8:677–680.
Câmara, G., Souza, R., Freitas, U., and Garrido, J. (1996).
Spring: integrating remote sensing and GIS by object-
oriented data modelling. Computers & Graphics,
20(3):395–403.
Câmara, G., Souza, R., Pedrosa, B., Vinhas, L., Mon-
teiro, A., Paiva, J., Carvalho, M., and Gatass, M.
(2000). TerraLib: Technology in Support of GIS In-
novation. II Workshop Brasileiro de Geoinformática,
GeoInfo2000, 2:1–8.
Chen, Z., Zhao, Z., Gong, P., and Zeng, B. (2006). A
new process for the segmentation of high resolution
remote sensing imagery. International Journal of Re-
mote Sensing, 27(22):4991–5001.
Duarte, A., Sánchez, Á., Fernández, F., and Montemayor,
A. (2006). Improving image segmentation quality
through effective region merging using a hierarchi-
cal social metaheuristic. Pattern Recognition Letters,
27(11):1239–1251.
Egenhofer, M. and Franzosa, R. (1991). Point-set topolog-
ical spatial relations. International Journal of Geo-
graphical Information Science, 5(2):161–174.
Falcão, A. X., Stolfi, J., and Lotufo, R. A. (2004). The
Image Foresting Transform: Theory, Algorithms, and
Applications. IEEE Trans. on Pattern Analysis and
Machine Intelligence, 26(1):19–29.
Felzenszwalb, P. and Huttenlocher, D. (2004). Efficient
Graph-Based Image Segmentation. International
Journal of Computer Vision, 59(2):167–181.
Hart, P., Nilsson, N., and Raphael, B. (1968). A Formal Ba-
sis for the Heuristic Determination of Minimum Cost
Paths. Systems Science and Cybernetics, IEEE Trans-
actions on, 4(2):100–107.
Kohonen, T. (2001). Self-Organizing Maps. Springer.
Lezoray, O., Elmoataz, A., SRC, I., EA, L., and Saint-Lo, F.
(2003). Graph based smoothing and segmentation of
color images. Signal Processing and Its Applications,
2003. Proceedings. Seventh International Symposium
on, 1.
Lucchese, L. and Mitra, S. (2001). Color image segmen-
tation: A state-of-the-art survey. Proc. of the Indian
National Science Academy (INSA-A), 67(2):207–221.
Schettini, R. (1993). A segmentation algorithm for color
images. Pattern Recogn. Lett., 14(6):499–506.
Shi, J. and Malik, J. (2000). Normalized Cuts and Image
Segmentation. IEEE Transactions on Pattern Analysis
and Machine Intelligence, 22(8):888–905.
Tremeau, A. and Colantoni, P. (2000). Regions adjacency
graph applied to color image segmentation. Image
Processing, IEEE Transactions on, 9(4):735–744.
VISAPP 2008 - International Conference on Computer Vision Theory and Applications
472
