
AN INTERACTIVE 3D VISUALIZATION MODEL BY LIVE
STREAMING FOR REMOTE SCIENTIFIC VISUALIZATION
Eriko Touma, Satomi Hara, Mari Kurumi, Yuri Shirakawa, Chisato Ishikawa, Masami Takata
Graduate School of Humanities and Sciences, Nara Women’s University, Nara-city, Japan
Takeshi Horinouchi, Kazuki Joe
Research Institute for Sustainable Humanosphere, Kyoto University, Uji-city, Japan
Graduate School of Humanities and Sciences, Nara Women’s University, Nara-city, Japan
Keywords:
3D Visualization, Live Streaming, GPGPU, Geophysical Fluids.
Abstract:
Recent improvement of high-end GPUs has made it possible to perform real-time 3D visualization such as
volume rendering and 3D contour plot for scientific data locally. A web browser based remote 3D visual-
ization by visualization servers is attractive, but data transfer overhead prevents from performing interactive
operations. We propose an interactive remote 3D visualization model by live streaming for geophysical fluids
research. In this model, we use live streaming flash media for the web browser based operations keeping mini-
mum quality of data analysis and minimum bit rate for live streaming of flash media. Preliminary experiments
with a prototype system validate the effectiveness of our proposing model.
1 INTRODUCTION
Visualization is an effective and attractive tool for an-
alyzing numerical data of scientific phenomena. To
find out a peculiar phenomenon from huge amount
of numerical data, visual understanding is sometimes
more efficient than just numerical analysis by com-
puters. Thus, visualization techniques are to be in-
dispensable in the fields where huge numerical data
analysis is ineluctably faced. In recent years, even
researchers without deep knowledge of 3D visualiza-
tion theory can make use of 3D visualization such as
volume rendering and 3D contour by using 3D visu-
alization software. For the actual and effective use of
3D visualization, they must prepare a high-end com-
puter and install required software packages and/or
plug-ins of which number is sometimes considerably
large. These limitations prevent new users of scien-
tists from using 3D visualization for their research. If
3D visualization environments were easily available
for any researchers such as desktop-publishing tools,
the number of new users of 3D visualization would
increase drastically. Considering current client-server
environments or grid computing, it is natural to think
of 3D visualization servers: any remote users can use
3D visualization servers through a 3D visualization
web browser.
Web3D technologies, which have been paid atten-
tion to in recent years, are modeling based, i.e. poly-
gon based rendering. It is mostly used for product
advertisement and is not suitable for scientific visual-
ization, which is volume based, i.e. voxel based ren-
dering. Regardless to say, the volume based render-
ing is more computationally intensive than the mod-
eling based rendering. This is the reason of having the
3D visualization servers. Although the improvement
of enhanced low cost PC is remarkable, it is still far
from the performance of real time volume rendering,
for examples.
To get interactive 3D visualization of scientific
data, the response time of 3D visualization is essential
rather than the resultant quality. Just the 3D visual-
ization servers are inefficient because of data transfer
overhead. In short, typical 3D visualization servers
are not suitable for real time 3D visualization in sci-
entific research. We are interested in an interactive
3D visualization environment via a web browser for
geophysical fluid science in which huge data must be
treated.
In this paper, we propose an interactive 3D visual-
ization model by live streams for remote scientific vi-
sualization via a web browser. By using the proposed
model, users can apply volume rendering and 3D con-
tour to their target data located in a remote database
409
Touma E., Hara S., Kurumi M., Shirakawa Y., Ishikawa C., Takata M., Horinouchi T. and Joe K. (2008).
AN INTERACTIVE 3D VISUALIZATION MODEL BY LIVE STREAMING FOR REMOTE SCIENTIFIC VISUALIZATION.
In Proceedings of the Third International Conference on Computer Graphics Theory and Applications, pages 409-414
DOI: 10.5220/0001095404090414
Copyright
c
SciTePress

via the web browser. Visualized objects displayed
on the browser can be observed from any direction
with any scales interactively. GPGPU is adopted for
the calculations of real-time volume rendering and 3D
contour plot. The proposed model is implemented as
a 3D visualization function for Gfdnavi introduced in
section 2, which is a tool to produce web-based data
services for geophysical fluid sciences. The 3D visu-
alization function is based on our 3D visualization im-
plementation model(E. Touma and Joe, 2007) which
enables huge data to be analyzed easily, quickly, and
efficiently.
The rest of the paper is organized as follows. In
section 2, we introduce Gfdnavi, a tool to construct a
data server for geophysical fluid sciences. In section
3, we propose a web browser based 3D visualization
function for Gfdnavi. The model of interactive 3D
visualization via a web browser is the key concept in
our proposal to be described in section 4.
2 GFDNAVI
A group of geophysical fluid scientists has re-
cently developed a software package named Gfd-
navi(T. Horinouchi and Shiotani, 2007)
1
. It is a tool
to produce web-based data services for geophysical
fluid sciences. The package of Gfdnavi includes a
special-purpose web-server program, so one can start
up web-based data services just by installing it. It
also runs with commonly-used web servers such as
Apache. Therefore, it is suitable both to use within
local hosts and to operate servers to make data pub-
licly available. Also, it is suitable to share data among
a group of scientists. Gfdnavi creates a metadata
database of numerical data automatically by scanning
a tree of local directories under the top directly that a
Gfdnavi-server maintainer specifies. It supports a few
file formats frequently used in geophysical fluid sci-
ences. Gfdnavi enables its clients to search, analyze,
visualize, and download data with web browsers. It
is implemented by using the web development frame-
work Ruby on Rails. This framework naturally en-
forces the Model-View-Controller (MVC) architec-
ture to the products constructed with it, where the
model typically represents a relational database. The
metadata database of Gfdnavi archives the structure
of the directory tree. It also supports searches by text
and spatio-temporal parameters such as searches us-
ing global maps.
In Gfdnavi, metadata extraction from numerical
data is done through GPhys(T. Horinouchi and Take-
1
http://www.gfd-dennou.org/arch/davis/gfdnavi/
hiro, ), a class library in the Ruby language to handle
multi-dimensional data of geophysical fluids. It ab-
stracts data formats based on a data model close to the
one used in NetCDF, thereby enabling unified access
to data in multiple formats such as GRIB and GrADS.
A Gfdnavi user first selects numerical data either
from the directory tree or from the metadata search.
Then the data can be visualized. Currently, it sup-
ports visualization up to 2D. Gfdnavi does not require
any plug-ins, so a user can use it only by using a web
browser.
Currently, a Gfdnavi server provides data on local
disks. However, a development is underway to sup-
port search and use of data across multiple Gfdnavi
servers. It is envisioned to create an overlay network
of Gfdnavi to realize virtual unification geophysical
fluid data access across the network.
3 3D VISUALIZATION
FUNCTION FOR GFDNAVI
As described in the previous section, Gfnavi provides
just 2D visualization functions. Using 3D visualiza-
tion, it is possible for geophysical fluid scientists to
understand a lot of information at a time intuitively.
For this purpose, we implement the 3D visualization
functions in Gfdnavi. In this section, we explain the
design concept of 3D visualization function for Gfd-
navi with some details of required elemental tech-
nologies.
For the appropriate implementation, we enumer-
ate our design concept below.
i) Efficient analysis of huge data
ii) Simple operations without any manual
iii) OS-independent
iv) High performance visualization
v) Web browser based operations
vi) Interactive operability
We use our 3D visualization implementation
model (E. Touma and Joe, 2007) for the implemen-
tation of 3D visualization functions to satisfy i) and
ii). We do not explain the detail of the implementa-
tion model because of lack of space.
For the concept iv), we take the advantage of
GPGPU. It is natural that the surplus computing abil-
ity is used for a part of calculation which should be
performed by CPUs, if GPUs perform programmable
pipeline operations. Nowadays, GPGPU is rapidly
used for various visualization tasks. We also use
GPGPU for Gfdnavi 3D visualization functions: vol-
ume rendering and 3D contour plot.
GRAPP 2008 - International Conference on Computer Graphics Theory and Applications
410
The 3D visualization function of Gfdnavi should
also provide a web browser based user-interface, and
it satisfies the concept v). The 3D visualization re-
sults are displayed by Flash animation to satisfy iii).
In our implementation of web browser based 3D vi-
sualization functions, target objects should be rotated,
zoomed and moved by simple mouse operations, re-
gardless to say, interactively. It satisfies the concept
vi).
4 REMOTE 3D VISUALIZATION
BY LIVE STREAMING
3D visualization was a computationally intensive task
sometimes requiring supercomputers. As the im-
provement of GPU technologies, now it comes to be
almost an interactive task for reasonably small local
data. During the design of 3D visualization func-
tion of Gfdnavi, we have faced a difficult implementa-
tion problem. As explained in section 2, Gfdnavi is a
tool for client-server or grid computing environments.
Adding 3D visualization functions to Gfdnavi with
a web browser based method, we need to determine
who visualizes target data. In the case that a server
performs the computation, the server needs to transfer
a lot of resultant snap shot images to clients rapidly.
Obviously there is a problem of data transfer over-
head to perform the interactive remote 3D visualiza-
tion. On the other hand, when a client (a web brows-
ing PC) performs the computation, the client must be
equipped with a latest GPU as well as GPGPU ap-
plication environments. Furthermore, the client must
download the whole target data in advance of the
computation. Since the purpose of Gfdnavi is to pro-
vide geophysical fluid scientists with various analy-
sis functions as well as data, the former approach of
server rendering is preferable.
4.1 3D Visualization Model for Remote
Data
In our method, visualization runs on a visualization
server, which means server side rendering. The vi-
sualization results are delivered to client users as live
streaming movie. In other words, client users can ob-
serve the visualization results as real time animation
via a web browser. When a point of display area in
the web browser is clicked or dragged by mouse, an
operation command is transmitted to the visualization
server. The visualization server reflects the transmit-
ted operation command so that it changes visualiza-
tion results: rotate, move and zoom, interactively. In
Browser
Server
for visualization
(2)
Data
3D visualization
software
(3)
(4)
Search 3D visualization
(6)
(1) (5)
(7)
(8)
(9)
(10)
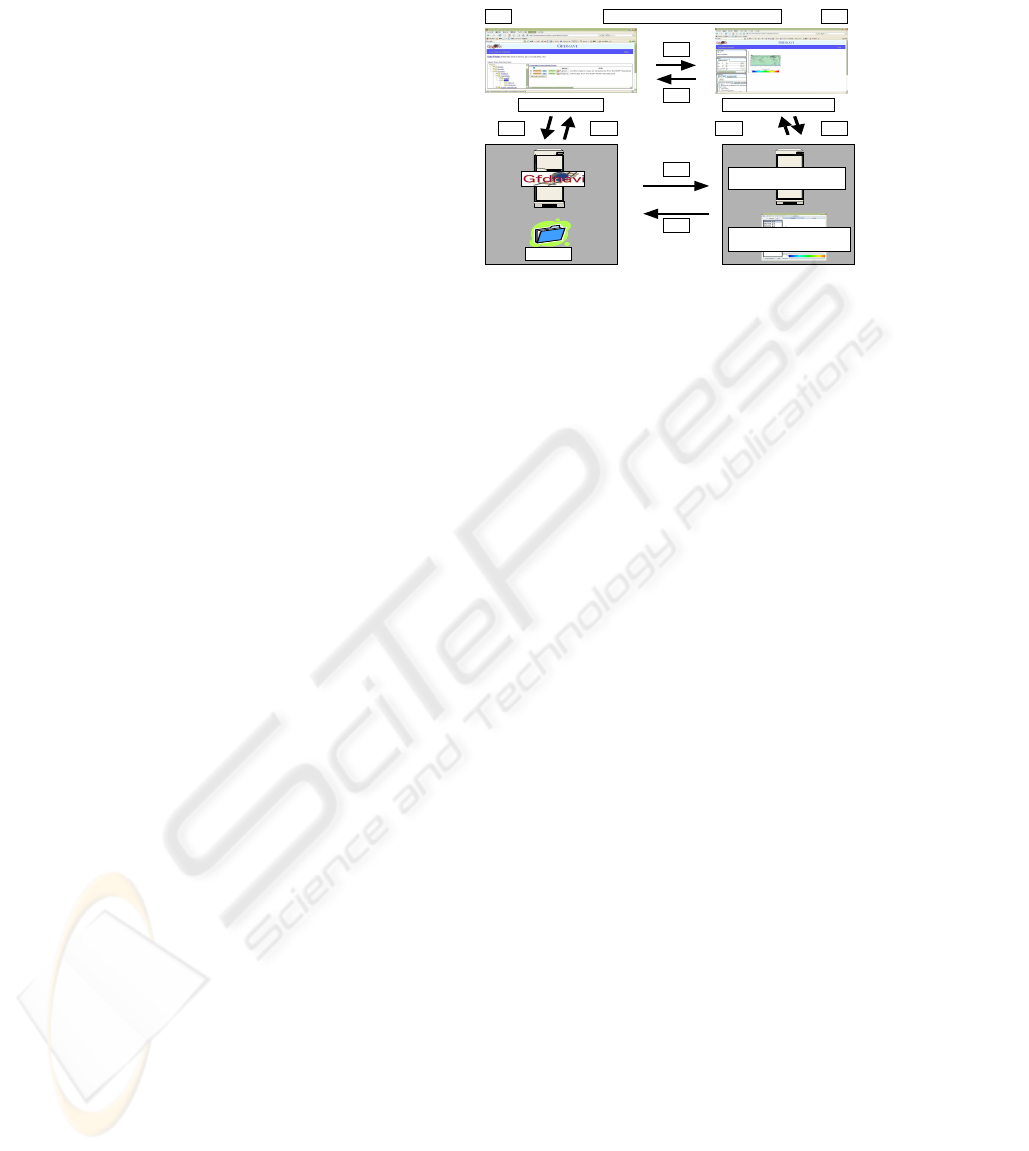
Figure 1: The flow of the interactive 3D visualization pro-
cess.
this way, interactive 3D visualization for remote data
by streaming distribution is obtained.
Figure 1 briefly explains the flow of the interactive
3D visualization process. A user accesses to a Gfd-
navi server via a web browser. The Gfdnavi server
contains data for geophysical fluid research, which
can be browsed from the data search page shown as
(1) of figure 1. When the user chooses the data that
the user wants to analyze, an operation command is
send to the Gfdnavi server as shown in (2). In (3), the
Gfdnavi server sends the information about the data
that the user chose. The information is displayed in
(1). When the user executes 3D visualization, the user
goes to the page of a visualization server as shown
in (4) and (5). The information of data chosen and
the request of 3D visualization by the user are sent
to the visualization server at (6). The visualization
server asks the Gfdnavi server for the data and re-
ceives the data as shown in (7) and (8). After down-
loading the whole data, 3D visualization is applied
to the data according to the user’s requests. The vi-
sualization server takes snap shot images of the 3D
visualization results at a regular interval. An anima-
tion clip is generated from these snap shot images to
be distributed as a streaming Flash file at (9). In the
browser of (5), the user can observe the visualization
result by animation delivered from the visualization
server in live streaming. When the user clicks and
drags by mouse on the stream animation display area,
the information of the mouse position and operation
is sent to the visualization server as a command to re-
quest the corresponding visualization process such as
rotating, moving, and zooming. The resultant visual-
ization is delivered back to the client in live stream-
ing, namely interactively. In the same way, the user
can request a visualization method of 3D contour plot
or volume rendering as well as parameter setting in
real time. When the user wants to change data, the
user goes back to the data search page shown as (10).
AN INTERACTIVE 3D VISUALIZATION MODEL BY LIVE STREAMING FOR REMOTE SCIENTIFIC
VISUALIZATION
411

4.2 Advantage of the Model
In our proposing model, geophysical fluid scientists
can observe the results of 3D visualization via a web
browser without installing any visualization packages
and with the benefit of high-end 3D visualization re-
sources. Live streaming by Flash animation is OS-
independent. Although the installation of a plug-
in is required for watching the Flash animation, the
Flash player is a popular plug-in and easy for users
to install. Actually, most web browser users have in-
stalled the Flash player plug-in because Flash media
is widely common. The benefit of streaming media
is that clients need not download the movie data into
their hard disks. It saves client users from considering
about the storage capacity to watch as long movies as
they want.
In our model, the process of 3D visualization,
movie generation of visualization results, and live
streaming distribution is performed on a visualization
server. In this process, it is unavoidable that dropping
frames sometimes occur because of regular sampling
of snap shot images. During scientific data analysis
with 3D visualization, the essential requirement is to
guarantee that scientists surely recognize the display
changes caused by their operations. In our model, a
display of a 3D visualization result does not change
unless a new command is issued. Therefore, drop-
ping frames are not a critical problem for our model
unlike stream distribution of animation which always
changes their display.
4.3 Implementation
4.3.1 Interactive 3D Visualization for Remote
Data
The 3D visualization functions executed in visualiza-
tion servers include volume rendering and 3D con-
tour plot by GPGPU with Cg as a shader language.
The Cg language can be used from OpenGL APIs.
For volume rendering and 3D contour plot, we use
VTK, which supports OpenGL as low level APIs. We
develop the 3D visualization functions in Cg so that
they are callable from any VTK program
2
as well as
Gfdnavi. Taking the advantage of collaboration with
GPGPU, the 3D visualization functions of the visual-
ization server will achieve high performance visual-
ization.
We here explain the performance issue. Namely,
how fast GPGPU based 3D visualization is? As
2
We know VTK5.2 will officially support Cg and GLSL,
but we don’t like to wait for the future release.
for volume rendering by GPGPU, it has been re-
ported that the frame rate of displaying 166MB vol-
ume data consisting of a (512,512,333) array on an
Nvidia Quadro FX 3400 GPU is 15.3fps(F. Schulze
and Hadwiger, 2007). In the case of 3D contour plot,
it has been reported that the frame rate of displaying
588MB volume data consisting of a (700,700,600) ar-
ray on an ATI Radeon X800 with 256 MB memory
is 28.7fps(B. von Rymon-Lipinski and Keeve, 2005).
Although the frame rates change by the complexity of
the volume data, considering the reported GPUs are
relatively old, the real-time 3D visualization (30fps)
is almost possible on the latest high-end GPUs as de-
scribed in the next subsection.
In our model, the visualization server receives op-
eration commands from client users, and the 3D vi-
sualization functions are invoked by the commands.
Receiving commands, if necessary, the visualization
server needs to get target data from a DB server (may
be equivalent to a Gfdnavi server). The data dealt with
geophysical fluid research mainly consists of four di-
mension arrays, and is so large in size. Downloading
the whole data in advance of 3D visualization to the
visualization server, the waiting time may sometimes
irritate client users. To solve the problem, we use the
Gphys library of Gfdnavi, which clips the three di-
mension domain specified by users. Clipping just the
necessary data, the data size is reduced to shorten the
data transfer time.
In our implementation, we adopt a double trans-
fer scheme assuming that the network bandwidth be-
tween the visualization server and the Gfdnavi server
is enough high such as two nodes in a PC cluster with
a high speed interconnection network. According to
a data transfer request, when the target data is larger
than the pre-defined size, Gphys is invoked to clip and
performs partial data transfer. At the same time, the
whole data is transferred to the visualization server
in background. This background data transfer is ex-
pected to complete until the client user makes another
clip request after several visualization operations. If
so, the new clip is obtained in local, i.e. from the
pre-loaded whole data in the visualization server. If
not so, the requested clip is transferred from the Gfd-
navi server again keeping the background whole data
transfer. In this way, we ensure the interactive opera-
tion for web based client users keeping from the huge
data transfer overhead.
4.3.2 Live Streaming
3D visualization results are taken as snap shot images
with 320× 240 at every
1
30
seconds. An mpeg ani-
mation is generated from those images at every sec-
GRAPP 2008 - International Conference on Computer Graphics Theory and Applications
412
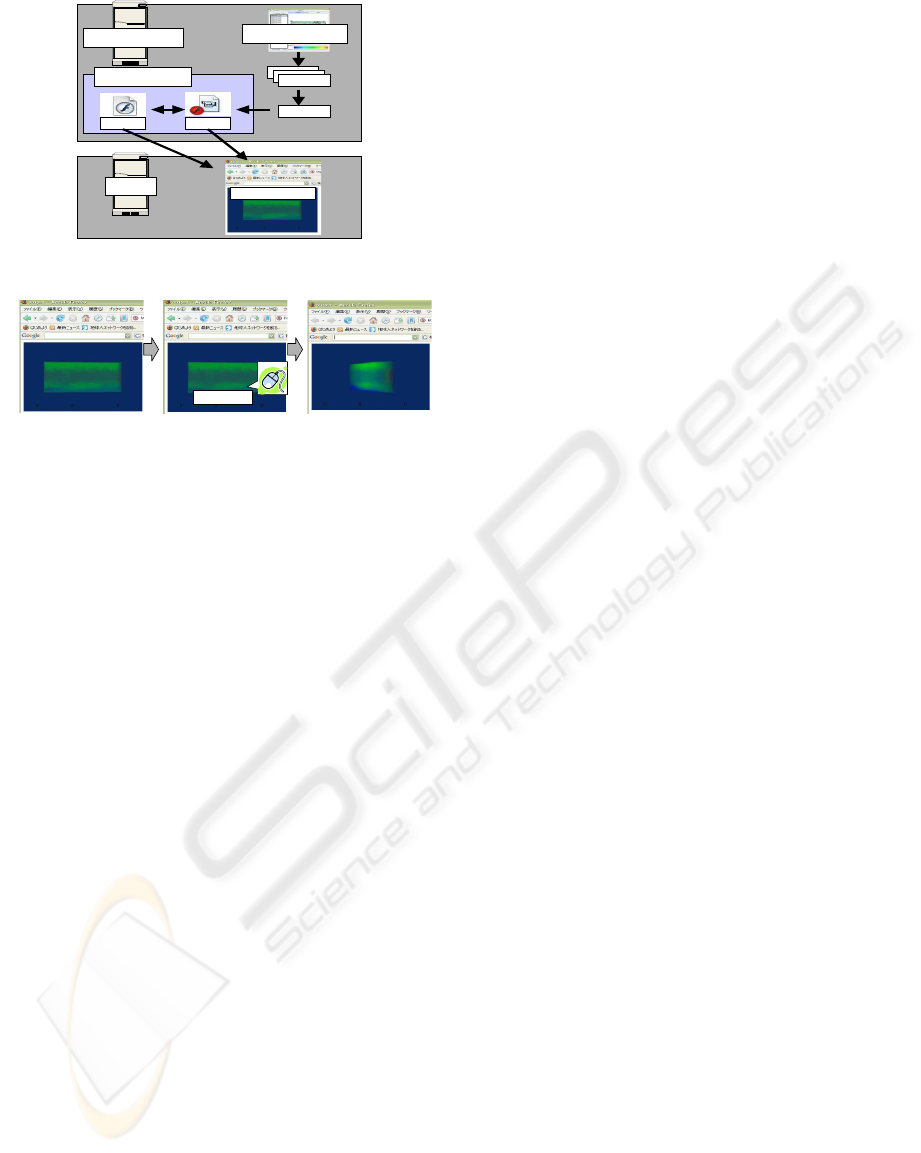
Server
for visualization
3D visualization
software
Client
Streaming server
FLV fileSWF file
Movie
Figure
Figure
Figure
Browser
Figure 2: The flow of the live streaming distribution.
(1)
(2) (3)
Click the mouse
Figure 3: The experiment results.
ond using ImageMagick. Then, the mpeg data is con-
verted to FLV using FFmpeg. In order to distribute
the FLV data in a streaming form, we set up a Flash
streaming server with red5. A Flash SWF player is
created to run in a client web browser. ActionScript is
used to call and play the FLV data that is in the visual-
ization server. ActionScript also performsthe acquisi-
tion of mouse event information on the Flash player.
The other interface parts, buttons and sliders for pa-
rameter regulation, are implemented in JavaScript.
The flow of the live streaming distribution is shown
in Fig. 2.
In our system, the recommendation bit rate for
watching the live streaming animation is 518K bps.
The recommended bit rate is calculated by BPP ×
f ps× width× height, where BPP is 0.225 that is the
right value for sports or music video. Note that the fa-
mous ”YouTube” adopts 500Kbps as the recommen-
dation bit rate, so our recommendation bit rate is not
a special (too expensive) case.
4.4 Experiments
To validate our model, we perform experiments using
a prototype system. First, we show the effectiveness
of interactive operation under some constraints. Then
we show the high performance visualization of real-
time volume rendering.
The prototype consists of two PCs connected
by typical LAN. The client is a standard desktop
PC while the server is a PC with Pentium D CPU
(2.66GHz X 2) and 512MB memory. The client PC
has a web browser with a Flash player where mouse
events are acquired to send commands to the server.
The server performs a simple volume rendering pro-
gram written with VTK. The volume data is a small
3D array of 144 by 73 by 30 (2.48MB). Receiving
a command from the client, the volume data is ro-
tated to generate ten snap shot images as a BMP for-
mat with the size of 320 by 240 (230KB per image).
Those BMP files are converted into an mpeg movie
by ImageMagick, and the mpeg movie are also con-
verted to an FLV movie (9KB for 10 frames assum-
ing 500Kbps) by FFMPEG. After the creation of the
FLV file, ten BMP files and one mpeg file are deleted.
Then, the server sends a message to notify the client
of the creation of the FLV file. When the client re-
ceives the message, the Flash player refreshes the dis-
play to load the new streaming FLV movie.
In the client, mouse events acquisition, com-
mand issuing and movie display are performed by
ActionScript while display refresh is performed by
JavaScript. The server and the client communicate
in socket connection to exchange messages. All the
tasks in the server are controlled by a Perl script.
Figure 3 shows the experiment results. A visual-
ization result is displayed as Flash video in (1). By
mouse dragging as shown in (2), a new visualization
result is displayed in (3). In this way, the interactive
3D visualization by live streaming is shown to be pos-
sible.
In this experiment, the response time from a
mouse click at the client to the re-display is 4.071
seconds. We explain each process time among the
response time. It takes 0.103 seconds from the mouse
click to the beginning of command issue to the server.
In the server, ten executions of volume rendering re-
quire 1.46 seconds. Ten image files creation takes
0.21 seconds. Generating an FLV file from ten BMP
files requires 1.133 seconds. The load time for the
new stream is 0.14 seconds. The rest of 1.025 sec-
onds is communication overhead.
The longest time consuming task is the volume
rendering part of 1.46 seconds. Note that this vol-
ume rendering is performed in a CPU (not using
GPGPU). To confirm the real-time 3D visualization,
we perform the second experiment. Using GPGPU,
we apply volume rendering to a volume data set
with the size of 512 by 512 by 512 (134.7MB).
We obtain the performance of 19.78fps and 4.77fps
with Quadro FX4500 (512MB) and GeForce7300GS
(512MB) , respectively. Using the latest high-end
GPUs, we surely have faster 3D visualization than
30fps. Namely, we can expect ten times volume ren-
dering for (512,512,512) volume data requires less
than 0.3 seconds.
The second longest time consuming task is the
creation of ten image files (0.21s) and one FLV file
(1.133s). In this experiment, we use several existing
AN INTERACTIVE 3D VISUALIZATION MODEL BY LIVE STREAMING FOR REMOTE SCIENTIFIC
VISUALIZATION
413

①10 Frame
FLV creation
①10 Frame
Visualization
①10 Frame
Streaming
②10 Frame
Visualization
②10 Frame
FLV creation
②10 Frame
Streaming
③10 Frame
Visualization
③10 Frame
FLV creation
・・・
GPU
CPU 1
CPU 2
0.3 s. 0.3 s. 0.3 s.
Figure 4: The pipeline chart for visualization process, FLV
creation and live streaming.
applications for this task, so the data transfer is done
via files. Re-implementing this task within memory,
we estimate the whole process will be reduced to one
over ten (0.13s).
The rest of time consuming task is communication
overhead of 1.025 seconds. This delay can be surely
improved because the synchronization operations are
performed by a Perl script. Replacing this part with
MPI synchronization functions, this overhead will be
almost eliminated.
4.5 Discussions
The preliminary experiments indicate the following
analyses.
1) Using the latest GPUs, ten times volume render-
ing for a (512,512,512) volume data set is esti-
mated at 0.3 seconds.
2) Creation of ten frames FLV movie requires less
than 0.3 seconds.
3) Assuming 500Kbps bit rate, the communication
delay of ten frames FLV movie is also less than
0.3 seconds.
4) On the client web browsers, the detecting time for
mouse events is 0.1 seconds by ActionScript.
If we use a visualization server with dual core
CPUs as well as a high-end GPU, the delay between a
client web browser and the visualization server is 0.3
seconds as shown in figure 4. In the case of mouse
events, the delay is estimated at 0.4 seconds. Thus
we conclude that we can develop an interactive 3D
visualization system by live streaming for remote sci-
entific visualization within the delay of 0.4 seconds,
which is enough fast response time for geophysical
fluid research.
5 CONCLUSIONS
In this paper, we proposed an interactive 3D visualiza-
tion model using live streaming so that the 3D visu-
alization is applied to scientific data located in other
computers connected by the Internet. The model is
to be implemented as 3D visualization functions for
Gfdnavi, which is a tool to produce web-based ser-
vices for geophysical fluid sciences. For this purpose,
we described six design concepts for the implemen-
tation. Based on the design concepts, we explained
the implementation methods using GPGPU and live
streaming. To validate our implementation method,
we developed a prototype system to perform prelim-
inary experiments. The experimental results indicate
that our interactiveremote 3D visualization system by
live streaming would have the delay of 0.3 seconds,
provided with a high-end GPU and a dual core PC,
while only 500Kbps bit rate streaming is enough for
the remote 3D visualization. Our future work includes
the actual implementation of our proposed system.
ACKNOWLEDGEMENTS
This work was partly supported by the Ministry of Ed-
ucation, Culture, Sports, Science and Technology of
Japan, Grant-in-Aid for Scientific Research on Prior-
ity Areas, g i-explosionh(No 18049043).
REFERENCES
B. von Rymon-Lipinski, T. Jansen, N. H. and Keeve, E.
(2005). Interactive visualization of large point isosur-
faces using gpu-based decompression. In Proceedings
of the IEEE/Eurographics Symposium on Point-Based
Graphics PBGf05.
E. Touma, K. Noguchi, M. T. H. K. N. N. and Joe, K.
(2007). 3d visualization system gateau for atmo-
spheric science: Design concept and practical evalu-
ation. In The 2007 International Conference on Par-
allel and Distributed ProcessingTechniques and Ap-
plications, volume II, pages 766–772. (more detail:E.
Touma, M. Takata, K. Joe:A 3D Visualization Model
for Information-Explosion in the Atomospheric Sci-
ence Field,Information Processing Society of Japan:
Mathematical modeling and Problem Solving (to ap-
pear),2007,(in Japanese)).
F. Schulze, K. B. and Hadwiger, M. (2007). Interactive de-
formation and visualization of large volume datasets.
In 2nd International Conference on Computer Graph-
ics Theory and Applications (GRAPP), pages 39–46.
T. Horinouchi, S. Nishizawa, C. W. Y. M. T. K. M. I.
Y. H. and Shiotani, M. (2007). Development of gfd-
navi: a new desktop/server tool for geophysical fluid
database, analysis, and visualization. In Proceedings
of Data Engineering Workshop. Japanese.
T. Horinouchi, R. Mizuta, D. T. S. N. and Takehiro, S.
Gphys – a multi-purpose class to handle gridded phys-
ical quantities.
URL: <http://ruby.gfd-dennou.
org/products/gphys/>
.
GRAPP 2008 - International Conference on Computer Graphics Theory and Applications
414
