
VORONOI DIAGRAM AND ITS APPLICATION TO SPATIAL
CALIBRATION FOR GAMMA CAMERA IMAGES
Brian D. Maisler, Hong Liu, J. E. McKisson, Yishi Li and Eric Kvam
Embry-Riddle Aeronautical University, 600 Clyde Morris Blvd, Daytona Beach, FL, USA
Keywords: Gamma Ray Image Restoration, Scintillation Crystals, Position Sensitive Photomultiplier Tubes (PSPMT),
Voronoi Diagram.
Abstract: Gamma camera images obtained from PSPMT detectors and segmented crystal scintillators to be used for
scintimammography are often distorted and blurred. Our software application is used to restore flood-field
gamma camera images and map the peak positions of individual charge clusters back to the positions of the
corresponding source scintillations. Since the exact position of scintillation in a crystal grain is not
controllable due to the randomness of scattering, a region-to-region location map is more statistically sound
than a point-to-point position map. Traditionally, an array of rectangles centered at the restored peaks of
charge clusters is mapped to an array of crystal grains from which the source scintillations are emitted. We
observe that the mapping is essentially a nearest neighborhood problem and innovatively introduce the
Voronoi diagram to replace the rectangular array. The natural fit of the Voronoi diagram to the essence of
neighborhood problem significantly improves the likelihood of correct mapping. It also makes our mapping
method adaptable to apply to crystal plates in other geometric configurations. We implement the
computations of Voronoi diagrams via OpenGL. As an empirical software solution, the images restored
from raw flood field images illustrate high level uniformity and linearity.
1 INTRODUCTION
In breast scintimammography, a compact detector
with high intrinsic spatial resolution and small
inactive peripheries can provide improvements in
extrinsic spatial resolution, efficiency and contrast
for small lesions relative to larger conventional
cameras. The detector that is used by the sponsor of
this research is comprised of a segmented array of
crystals CsI (TI) optically bonded to a grid of
Position Sensitive Photomultiplier Tubes (PSPMTs)
(Weisenberger, 2003
, Smith 2003, Williams 2000).
Tested geometries include both circular and
rectangular arrays.
The detection mechanism is conventional
scintillation, with optical responses spatially
confined into regularly spaced “grains” by the
intersegment material. Ultraviolet photons pass
through the optical bonding material into the
PSPMT envelope to strike the photocathode. The
released charge is amplified and the resulting charge
cloud is collected on a grid of anode elements. The
charge collected on the several anode elements in
the PSPMT is electrically gathered along rows and
columns by a resistive network and presented at
charge sensitive analog to digital converters. The
resulting conversions present a vector of raw charge
distribution data from which the centroid of the
charge cloud is determined in two dimensions. This
centroid constitutes the raw centroid data available
for each event. Data for the calibration is produced
by illuminating the segmented crystal with a uniform
planar flood-field gamma ray source. Event data are
collected and raw centroids are computed.
Raw flood images obtained in the CsI (TI) array
system are intrinsically distorted and blurred
(Weisenberger, 2003
, Smith 2003, Marks 1999).
Optical defects and fabrication limitations cause
distortions of the photon collection pattern at the
photocathode, and electro-optical effects further
distort the charge clouds as they are amplified. Our
task is to develop a software application that takes
raw flood images as calibration inputs (figure 2),
identifies blurred peaks of signals, corrects their
distorted positions, and finally maps the individual
peaks to the source scintillations. Since the exact
position of scintillation in a crystal grain is not
controllable due to randomness of scattering, a
region-to-region location map is more statistically
68
D. Maisler B., Liu H., E. McKisson J., Li Y. and Kvam E. (2008).
VORONOI DIAGRAM AND ITS APPLICATION TO SPATIAL CALIBRATION FOR GAMMA CAMERA IMAGES.
In Proceedings of the Third International Conference on Computer Graphics Theory and Applications, pages 68-73
DOI: 10.5220/0001096700680073
Copyright
c
SciTePress
sound than a point-to-point position map.
Traditionally, the output is a map consisting of
rectangles centered at repositioned peaks so that
each rectangle maps to a grain of the segmented
crystal plate. We observe that the mapping is
essentially a closest neighborhood problem and
innovatively introduce Voronoi diagram to record
the position of the source scintillations. Each
polygon contains a point corresponding to the peak
of the accumulated charge clouds emitted from a
particular crystal grain.
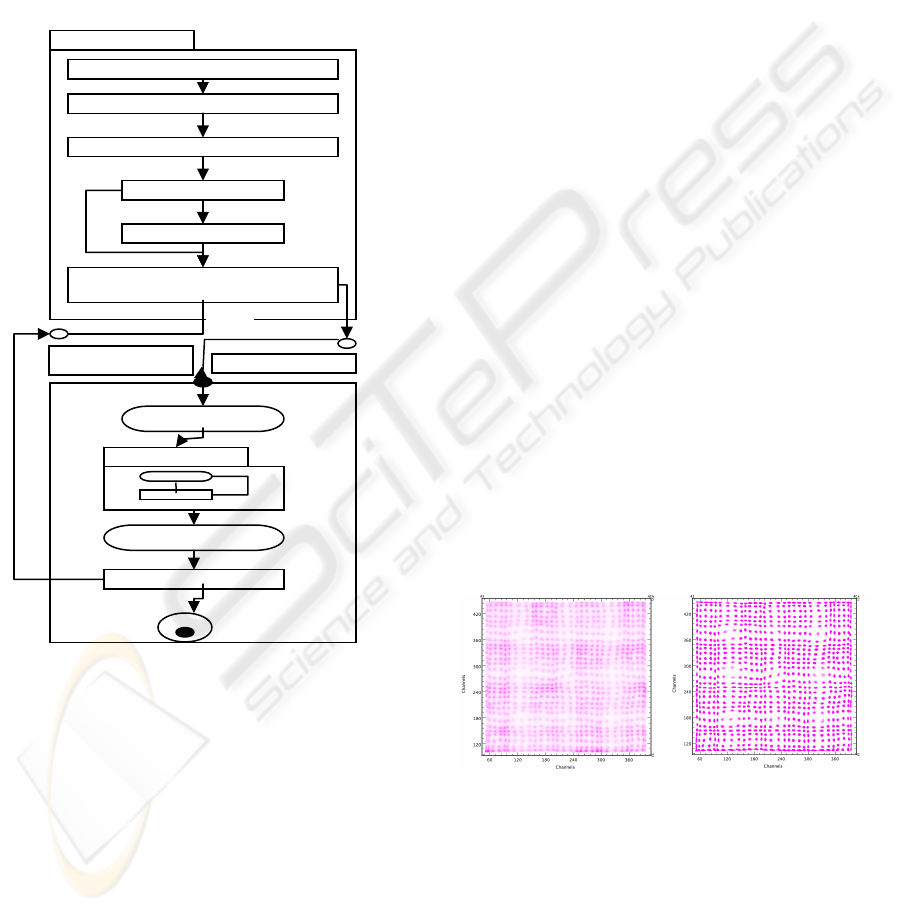
Figure 1.
The application that we developed for image
restoration runs under Kmax environment. Kmax is
a software product of Sparrow Corp. that provides
an environment for creation of Java script files
called toolsheets for instrument control and data
management with high level support for modular
instrumentation, data acquisition, and data analysis
(please follow link, http://www.sparrow.com
). Our
application software consists of two packages. One
is a Kmax toolsheet program that interfaces to the
end users through routines associated with graphical
user interface “buttons” as shown at the top of figure
1. The second package, the block diagram of which
is shown at the bottom of figure 1 is a native C
program running in the background. This
background task is built on OpenGL to take
advantage of graphical tools therein. The two
packages are interfaced through Java Native
Interface (JNI) functions as shown in Figure 1.
The rest of this article is organized as follows.
Section 2 describes our software solution to the
image restoration problem. Section 3 focuses on our
core geometric technique. We introduce the concept
of Voronoi diagram and address the rationale to do
so. Section 4 presents our preliminary work on
regression methods and an adaptive algorithm for
future work.
2 SOFTWARE
This section, we will describe our software solution
to the problem introduced above. We present our
solution by following the four steps illustrated in the
Kmax package of Figure1. In the first step, the raw
data file of an image (as shown in figure 2) is loaded
and the program is initialized. We outline the other
three steps in the following three subsections.
2.1 Filtering Out the Noise
The second step filters noise and enhances peak
localization. The filter contains a curve that is
roughly the same size and shape as the peaks in the
image. The filter is then moved across the image,
multiplying the filter by the image beneath it -
essentially a correlation function. This process
sharpens the image. Figure 3 shows the peak
enhanced image.
Figure 2: Input Image. Figure 3: Peak Enhance
d
Image.
2.2 Find Peaks
The third step is to locate the peaks in the image. We
call the set of signals that are emitted from
individual source scintillation as a signal cluster. A
peak is the centroid of a cluster. Using the filtered
Native Package
Kmax Packa
g
e
BTN_STEP_TWO: Filtering out the noise
BTN_STEP_THREE: Find peaks
BTN_STEP_ONE: Load Raw Images
No
Found all Peaks?
Done
BTN_STEP_FOUR: Links to JNI for
performing Voronoi Calculations
Add Peaks Manually
Yes
MAIN ()
GlutInit ()
Voronoi Package
Out
p
ut.tx
t
JNI
(
Java Native
)
VORONOI DIAGRAM AND ITS APPLICATION TO SPATIAL CALIBRATION FOR GAMMA CAMERA IMAGES
69
image, a search algorithm attempts to find as many
peaks as possible by looking for all local maxima
about a user-selected cutoff point.
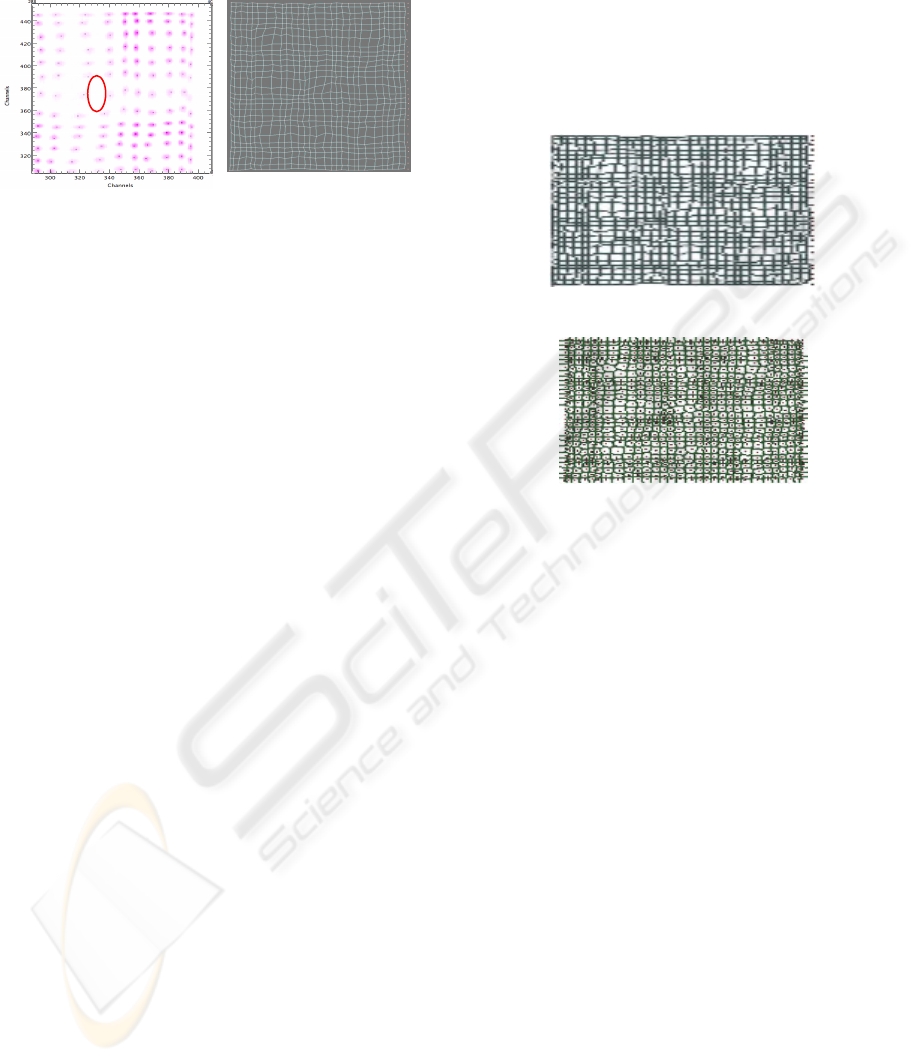
Figure 4: Missed peaks. Figure 5: Axis warped to
peaks.
The search is initiated from the peak closest to
the center of the image assuring the peak search
works equally well for rectangular and circular
detectors. A search ray is projected from the center,
initially along the x-axis. The search algorithm
iterates finding peaks that are near the axis. The
program finds all peaks that are contained within
constraints and assigns them a score based on their
distance from the center peak and the angle from the
search ray. The higher the score, the more likely it is
that the peak is the next correct peak on the axis.
Significantly higher scoring peaks inside the cone
are added to the axis, selecting the smaller angular
deviation from the similar scores. The process
continues until no peaks fit the constraints, usually
when the edge of the image has been reached. The
process is repeated for the next row, constructing a
new search ray parallel to the next row position until
all rows have been registered.
The program will usually find almost all of the
peaks, but tends to have trouble near the edges
where the image becomes strongly distorted due to
the boundaries of crystals and associated losses (see
figure 4). Additional problems arise when the
calibration image data contain response
inhomogeneities, resulting in additional false
positive peaks. As shown in the third step of figure
one, the located peaks with editing tools are then
presented for users to edit them in case some peaks
are missing. This is the only step in our current
version that requires user interaction. An adaptive
algorithm and future work to replace the manual
interaction will be presented in section 4.
2.3 Line up Peaks and Built Output
File
Once all of the peaks have been identified, all peaks
must be horizontally and vertically aligned so that
the calibration file for image restoration can then be
built. The program can also find the dimensions of
the crystal array by looking at the number of peaks
that make up each axis (Figure 5). Once the axes are
formed, the last step is to align the rest of the peaks.
Since we know that topology of the crystal grains in
advance, it is easy to adjust the peak line-up
algorithm to work for both rectangular and circular
detectors.
Figure 6: Grids centered at peaks.
Figure 7: Voronoi diagram of the peaks.
Our first mapping file was built on traditional
method. As shown in Figure 6, each box centered at
a peak maps to a crystal grain from which the charge
clouds of the peak are emitted. As shown in the
fourth step of figure 1, the mapping file of our
current solution was built on Voronoi diagram,
which will be elaborated in next section.
3 VORONOI DIAGRAM
This section focuses on our core geometric
technique, which is using Voronoi diagram to
replace the array of rectangles of the output mapping
file. We introduce the concept of Voronoi diagram,
outline its implementation, and address the rationale
and advantages to introduce this concept to our
program.
3.1 Definition of Voronoi Diagram
A Voronoi diagram creates a polygon around each
peak such that any point contained within that
polygon is closer to that peak than any other peak.
This means that when an event is detected, it is
mapped to the closest possible crystal. The Voronoi
diagram guarantees that every point in a give peak’s
GRAPP 2008 - International Conference on Computer Graphics Theory and Applications
70

polygon is closer to that peak than any other. The
Voronoi diagram is built simply by providing a list
of points; it is independent of the geometric
configuration that the points belong to. In short, it
only depends on the peaks that we found.
The Voronoi diagram is one of the most
important computational geometry concepts, which
is secondary only to convex hulls (O’ Rourke, J.,
1998). Let
},....,{
21 n
PPPP =
be a set of n points in
plane, the nearest neighborhood of
i
P is defined as:
}|,||:|{ ijxpxpxV
jiP
i
≠∀−≤−=
. It is a
polygon that contains all points that are closer to
i
p than any other points
j
p in the point set P. The
Voronoi diagram is made up of all neighborhoods
i
P
V for ni ≤≤1 .
3.2 Computation of Voronoi Diagram
An efficient algorithm to create Voronoi diagrams as
well as its dual Delaunay triangles can be found in
the book of O’ Rourke. Although our user interface
is in Java script, there are two factors that motivate
us to code the Voronoi computation in C. Firstly,
coding the algorithm in Java reduced the
performance measurably. Secondly, OpenGL is
coded in C and we would like to build our
computation on OpenGL, which provides rich
graphic utility functions for us to interpret data and
process the graphics elements. The detail
implementation is beyond the scope of this article.
Source codes are available by personal contact to
liuho@erau.edu
. Our technical challenge is the
interfacing problem with many file operations. We
use JNI to interface the Java script code in Kmax
and native C codes.
Once the Voronoi diagram is built, the
calibration file is created by assigning each crystal
element an integer value. This value will represent
the array position of the regular crystal that the event
will be mapped to. The numbering system starts at
the bottom left corner of the array, which is assigned
the value of 0 with indices increasing in row order.
Event centroids are resolved to an initial pixel
position in the raw image. Each pixel in the image
space is tested to determine which Voronoi polygon
it falls inside and thus which crystal grain the event
is to be associated with. The pixel is then assigned
the value of the corresponding array position. Once
the map has been completed, it is exported in Kmax
histogram format. The resulting calibration file is
then used to interpret the data when the detector
receives a gamma event. The calibration function
takes the apparent (distorted) location of the event
and returns the crystal number (position) in which
the event is most likely to have occurred.
3.3 The Rationale of Voronoi
Approach
We address the rationale to replace rectangular grids
to Voronoi diagrams by the deficiency of the former
approach and the advantages of the latter one.
Building a rectangular array to match the array
of crystals presents a number of problems. First, not
all of the detectors are rectangular; some detectors
are made into circles by cutting off the corners of the
crystal array. Second, due to the distortions,
especially near the edges, it is difficult to detect
exactly where in the array a particular peak belongs.
Third, the size of the crystals and the number of
crystals changes from detector to detector. It is
challenging to make an algorithm that will align the
peaks correctly for different geometric
configurations of segmented crystal plates.
We know from 3.1 that Voronoi diagram is a
geometric concept to describe vicinity. We argue
that the mapping between the peaks of signal
clusters and the crystal grains is essentially a map
between two sets of closest neighborhoods. A
PSPMT diagram of the set-up for mapping the
detector surfaces with gamma rays can be found in
the article by Weisenberger et al. 2003. The charges
scattered from the scintillation hit mostly the nearby
anode elements within a cylindrical cone whose
vertex is the scintillation origin. Notice that the
vertical distance from all anodes to the crystal plate
are uniform, so, the source scintillation of a charge
cluster is most likely originated from the scintillation
whose horizontal distance to the peak (centroid of
the cluster) is smallest. Since we cannot control the
exact location of the scintillation inside a particular
crystal grain due to the randomness of scattering, a
point-to-point mapping between the scintillation
location and their corresponding peaks is not
available. Nevertheless, it is statistically sound to
assume that most of scintillations originated near the
center of the crystal grains. Therefore, the crystal
grains that host the corresponding scintillations are
their natural nearest neighborhoods in statistical
sense. On the other hand, the Voronoi diagrams are
the precise nearest neighborhoods of signal peaks.
Hence, we have a map between the two sets of
neighborhoods; with one set as the nearest
neighborhoods of the signal peaks and the other set
as the crystal grains that are the natural
VORONOI DIAGRAM AND ITS APPLICATION TO SPATIAL CALIBRATION FOR GAMMA CAMERA IMAGES
71

neighborhood of the original scintillation.
To summarize the idea: 1. A set of regularly
spaced crystal segment grains possess a one to one
relationship to peaks identified in the calibration
image. 2. The Voronoi diagram of the peak locations
define the nearest neighbor mapping from image
pixels to the crystal grains (see figure 7). 3. Each
imaging event in the scintillator produce a cluster of
charge signals at the PSPMT anodes whose centroid
falls inside one Voronoi region. 4. The mapping of
this centroid from the Voronoi region to the crystal
grain defines the shortest distance to the mapped
peak among all peaks in the calibration file. 5. Since
statistically, most scattering charges of a scintillation
hit nearby locations on the detector, the detected
cluster of signals is most likely to have originated
from a scintillation occurring in the mapped crystal
grain corresponding to the containing Voronoi site.
Thus, the region-to-region mapping between the two
sets of nearest neighborhoods is the best one that is
available and necessary in theory. In practice, we
can clearly see the differences of linearity and
uniformity between the solution in Voronoi diagram
approach and the solution in rectangular grids
(comparing figure 7 and figure 6). It is desirable to
measure the quantitative improvement of in our
future work.
The Voronoi diagram will always create a
precise nearest neighbor map regardless of
geometry. This makes the mapping technique
adaptable to crystal plates of other geometric
configurations. It is superior to previous methods
which defined arbitrary neighborhoods based on a
simpler set of bisectors and thus did not guarantee
true nearest neighbor performance. The
computational complexity of the algorithm for
generating the Voronoi diagram O(n ln(n)), where n
is the number of the sites and ln(n) is the natural
logarithmic function of vertex number n. It is fast
enough for use in real time applications.
4 FUTURE WORK
The third step sometimes relies on manually
cropping to correct possible missing peaks, which
mostly occurs at edges. Due to the optical and
electronic faults, it is possible to incorrectly identify
high noises as peaks and falsely filter out low peaks
as noises. With judicious choices by the operator the
initial peak identification process typically detects
90% to 95% of the true peaks. Our future work is to
apply a preliminary nonlinear regression method and
an adaptive algorithm presented below to improve
the accuracy of our peak identification.
4.1 Nonlinear Regression
MATLAB is used to implement the nonlinear
regression analysis presented below. We try to
preprocess the input data file and correct the local
distribution of the individual signal clusters without
change their total energy levels. The two
assumptions are that each cluster observes a
hypothetic Gaussian distribution and corresponds to
a peak and the distortion does not significantly
change the total received energy of a cluster. In our
analysis, we first use the local maximum as a
reference point to estimate the amplitude of the
Gaussian distribution. By substituting the reference
point to the model that we have obtained with both
the mean and the standard deviation, we can solve
for the potential amplitude from the selected
reference point. The second step is to identify those
significantly distorted data by calculating the
difference between the experimental data and the
predicted data. The third step is to correct them in
the direction of the estimated trend by keeping the
mean invariant according to the second assumption.
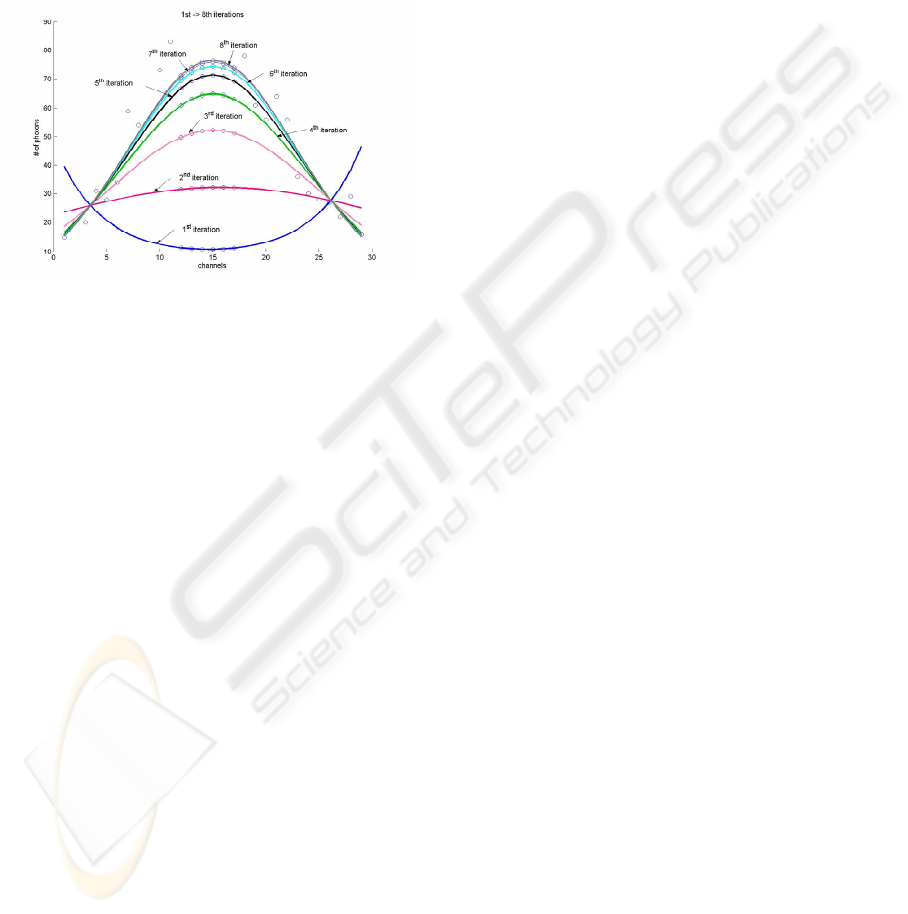
After constructing the Gaussian distribution the
deficient data values are replaced by the values
suggested by the regression curve. This procedure is
performed iteratively until the difference between
the interactions is sufficiently small (see Figure 8).
4.2 An Adaptive Algorithm
We need firstly to set the criteria to measure the
quality of our calibration. Regardless whether we
use rectangular crystal plate or round crystal plate,
we know the numbers of the crystal grains in each
row and each column. We also recall that our
Voronoi diagram has been indexed horizontally and
vertically at the fourth step. So our first measure is
that the numbers of sites in each row and each
column of Voronoi diagram must match those of the
crystal plate. We also know that the sizes of crystal
grains are almost uniform except for the grains on
the edge of round crystal plates. Though distortion is
inevitable, we expect that the Voronoi diagram has a
certain level of uniformity of sizes, which is
measured by the number of pixels. Hence, our
second measure is the statistical confidence level of
the site sizes. We define our fitness function of the
adaptive algorithm according to these two factors
with empirical weighted coefficients.
In the first step of iteration, the image data
modified in the previous iteration is loaded to
GRAPP 2008 - International Conference on Computer Graphics Theory and Applications
72
replace the raw data. Our major change starts at the
third step as follows: We mark those narrowly
passed peaks as likely false peaks. While those
points passing a specific cutoff filter are recorded as
peaks, other points passing half of the cutoff filter or
whose amplitudes being second to the corresponding
peaks nearby are also recorded as back-up candidate
peaks for next iteration. They are used to mutate
with the narrowly passed peaks to improve the
overall fitness function in the fourth step.
Figure 8: Nonlinear Regressions of Several Iterations.
After constructing the Voronoi diagram and
indexing each site with the mapped pixels, we add
three operations in the fourth step. Firstly, we
recalculate the median and standard variations of the
site sizes along with the amplitude of signals and
update the fitness function. Secondly, we construct a
hypothetic Gaussian distribution of the site sizes of
the Voronoi diagram. If the size of a peak lies out of
the small side of a certain confidence interval, then it
is confirmed as a most-likely false peak. If a
recorded back-up peak candidate is available in the
corresponding site of the most-likely false peak,
then, we test the mutation under the fitness function.
If the mutation improves the fitness, then the back-
up point is promoted as a peak by properly
increasing its signal amplitude without changing the
mean signal intensity, while the most likely false
peak is demoted as a back-up candidate by properly
decreasing its amplitude. Finally, we use an
empirical cutoff of the fitness function to decide if
the iteration should be terminated.
4.3 Conclusions
Voronoi diagram has extensive applications in many
fields (Gonzalez 2004). In the broad image
processing field, Amidror surveyed the applications
of Voronoi diagrams to data interpolations Amidror
2002. We observe that the mapping between the
peaks of charge clouds and scintillation sources of a
segmented crystal plate is essentially a nearest
neighborhood problem. In this work, we use a
Voronoi diagram to construct the position mapping.
To our knowledge, it is the first time that the
Voronoi diagram is applied to solve position
mapping problems in image processing field. The
natural fit of the Voronoi diagram to the essence of
neighborhood problem significantly improves the
likelihood of correct mapping and makes the
mapping technique adaptable to crystal plates in
other geometric configurations. This paper presents
our empirical solution to the image restoration
problem used for breast scintimammography. We
implement the computation of Voronoi diagrams in
C via OpenGL under a Java-based user environment
called Kmax. We also outline a nonlinear regression
method to correct the shape of charge clusters
locally and a preliminary adaptive algorithm to
improve the effectiveness of peak identification in
our future work.
ACKNOWLEDGEMENTS
Authors would like to give thanks to the Thomas
Jefferson National Accelerator Facility for
sponsoring the reported investigation.
REFERENCE
Amidror, I., 2002. Scattered data interpolation methods for
electronic imaging system: A survey, Journal of
Electronic Imaging , Vol. 11(2), 157-176.
Gonzalez, R., C., Woods, R., E., 2004. Digit Image
Processing, Pearson Education, , 2nd edition.
Weisenberger, A.G., Wojcik, R., et al. 2003. SPECT-CT
system for small animal imaging, Nuclear Science,
IEEE Transactions, Volume 50, Issue 1, pp. 74 – 79.
Marks, D.G., Barber, H.B., et al., 1999. Improving
Performance of a CdZnTe imaging array by mapping
the detector with gamma rays, Nuclear Inst. &
Methods in Phys. Res., A 428, 102 – 112.
O’ Rourke, J., 1998. Computational Geometry in C,
Cambridge University Press, second edition.
Smith, M.F, Majewki, S., Weisenberger, A.G., 2003.
Optimizing Pinhole and Parallel Hole Collimation for
Scintimammography with Compact Pixellated
Detectors, IEEE Trans Nucl Sci. 50: 321-326.
Williams, M. B., Goode, A.R., Galbis-Reig, V., et al.
2000. Performance of a PSPMT based detector for
scintmammorgraphy, Phy. Med. Biology, Vol. 45, pp
781-800.
VORONOI DIAGRAM AND ITS APPLICATION TO SPATIAL CALIBRATION FOR GAMMA CAMERA IMAGES
73
