
IMAGE QUALITY IN IMAGE-BASED REPRESENTATIONS OF
REAL-WORLD ENVIRONMENTS
Perceived Smoothness of Viewpoint Transitions
Filippo Speranza
Communications Research Centre Canada, 3701 Carling Avenue, Ottawa, Ontario, K2H 8S2, Canada
Akshay Bhatia, Robert Laganière
University of Ottawa, School of Information Technology and Engineering Ottawa, Ontario K1N 6N5, Canada
Keywords: Virtual environments, perceived smoothness, viewpoint density, speed of movement.
Abstract: In this study, we investigated the effect of viewpoint density and speed of motion on perceived smoothness
of viewpoint transitions. The effect of viewpoint density was examined for two types of viewer motion:
forward and lateral motion. In both cases, we found that perceived smoothness varies with viewpoint
density. We also found the number of viewpoints required to maintain a certain level of perceived
smoothness varies inversely with speed of movement represented.
1 INTRODUCTION
The ability to virtually navigate across visual
representations of real-world environments is of
great benefit to many fields, such as education, real
estate, and tourism. However, the appeal and
usefulness of applications based on virtual
navigation essentially depend on the easiness with
which the user can navigate the environment and the
quality of the visual information provided.
We can consider the representation of the
environment as a collection of viewpoints. A
viewpoint is simply a view of a scene taken from a
specific perspective and hence having a specific
visual direction. To obtain a high quality
representation of the environment, and thus a natural
and comfortable visual experience, two factors are
important: viewpoint quality (e.g., sharpness, color,
etc.) and viewpoint density, which refers to the
number and spacing of the viewpoints made
available to the viewer.
Viewpoint density might have significant effects
on the perceived smoothness of viewpoint transition
and thus on the quality of the visual experience.
When the user moves across the virtual
environment, the visual information needs to be
updated consistently with the speed and direction of
movement. Basically, this involves a series of
transitions from viewpoint to viewpoint. A
degradation of perceived smoothness of viewpoint
transition might be expected if, after a movement of
some extent, the corresponding new viewpoint is not
available (e.g., because not captured). The amount of
degradation will depend upon the techniques (e.g.,
interpolation or duplication) used for replacing the
missing viewpoint. In this study, we investigated the
minimum number of viewpoints that need to be
captured for perceptually smooth transitions.
The effect of viewpoint density might also
depend upon the speed of movement. Assume that
the viewer moves, at a speed of 10 feet/second,
between points A and B, which are separate by a
distance of 10 feet. Assume also that we display this
movement using a 30 fps video rate so that the
viewer will navigate the AB distance in exactly one
second. A complete representation of the movement,
that is one in which each frame contains new and
different information, would require 30 different
viewpoints, i.e. a density of 3 views/foot. Now
assume that the viewer moves the same distance at
twice the previous speed. It is easy to see that, at the
same video rate of 30 fps, we would have to display
only 15 frames (1.5 views/foot) to provide a
complete representation of the movement. Thus, for
each speed of movement there is a maximum
439
Speranza F., Bhatia A. and Laganière R. (2008).
IMAGE QUALITY IN IMAGE-BASED REPRESENTATIONS OF REAL-WORLD ENVIRONMENTS - Perceived Smoothness of Viewpoint Transitions.
In Proceedings of the Third International Conference on Computer Graphics Theory and Applications, pages 439-442
DOI: 10.5220/0001096804390442
Copyright
c
SciTePress

viewpoint density which provides the maximum
amount of visual information possible at a given
video rate. Densities lower than this maximum
might result in a decrease of perceived smoothness.
The relation between perceived smoothness,
viewpoint density, and speed of movement was
examined for two simple types of viewer (virtual
camera) motion: forward motion (i.e., moving
toward a target in a straight line) and lateral motion
(i.e., moving sideway in a straight line).
2 EXPERIMENT 1 - FORWARD
MOTION
In this experiment, we simulated what the observer
would see if she/he were moving in the environment
from point A to point B along a straight path and
looking in the same direction as that of the
movement. These “forward motion” test sequences
were constructed by selecting viewpoints that had
the same visual direction as the direction of
movement.
2.1 Generation of Video Test Material
We used four were natural sequences, captured with
a LadyBug camera (Point Grey Research Inc.), and
one synthetic sequence, created with 3D StudioMax.
The pixel resolution of all sequences was 1024 x720.
The natural sequences were captured in a
rectangular room. Two sequences, named
CastleLongFront and CastleLongBack, represented a
movement along the longest axis of the room but in
opposite directions. The other two sequences, named
CastleShortFront and CastleShortBack, represented
a movement along the shortest axis of the room, but
again in opposite directions. All four sequences were
created by capturing 4 original images per foot at
equally spaced intervals. The long sequences
encompassed a distance of 24 feet (96 original
viewpoints) whereas the short sequences
encompassed a distance of 10 feet (40 viewpoints).
The synthetic sequence, named SaharaLong,
contained several geometric shapes and a model of a
vehicle whose dimensions were used as a baseline
for the spatial dimensions of the environment.
Simulate distance and viewpoint density were the
same as those of the long natural sequences.
These original sequences were used to generate
sequences having different levels of viewpoint
density and speed of movement. There were four
levels of viewpoint density: 4, 2, 1, and 0.5
views/foot. The lower density sequences were
created by sub-sampling the 4 views/foot original
sequences and duplicating the remaining views.
Thus, the eight views (1,2,3,4,5,6,7,8) that spanned
two feet in the original sequences became
(1,1,3,3,5,5,7,7), (1,1,1,1,5,5,5,5), and
(1,1,1,1,1,1,1,1) in the 2, 1, and 0.5 densities,
respectively.
Each of the four densities was presented at three
speeds: 3.8 (slow), 7.6 (medium), and 15.2 (fast)
feet/second. The speed refers here to the speed at
which the camera (real or virtual) is moving through
the environment. In this study, this speed was
simulated by changing the speed at which the
sequences were played by a DVS HDProStation
digital disk recorder. The slowest speed
approximated the average walking speed
(Knoblauch, Pietrucha, and Nitzburg, 1996).
It was noted that at the fastest speeds the
duration of the sequences would be perhaps too
short for a proper assessment of smoothness. To
obtain sequences of sufficient temporal duration we
first increase the length of the sequence by repeating
the sequence backwards to form a cycle, i.e., from
point A to point B and vice versa (ABA). Secondly,
we concatenated these cycles proportionally to the
speed at which the sequence was to be played: once
for the slow speed, twice for the medium speed, and
four times for the fastest speed. As a result, the long
sequences had duration of 12.6 seconds and the short
sequences had duration of 5.2 seconds.
2.2 Subjective Assessment
In order to evaluate the perceived smoothness of
sequences generated as described above, we
performed a subjective assessment experiment.
Eighteen viewers participated in the experiment.
The combination of five sequences, four
viewpoint densities, and three speeds yielded 60
experimental conditions. The perceived smoothness
of these conditions was assessed using a single
stimulus method (ITU-R Recommendation BT.500,
2004). A test session involved of a series of
assessment trials, each one consisting of the
presentation of a single video sequence followed by
a blank, i.e. mid-grey, display. At the end of each
trial, the viewer was asked to provide a rating of the
perceived smoothness of the entire presentation
using a continuous line judgment scale, which was
divided into five segments. As a guide, the
adjectives “Excellent”, “Good”, “Fair”, “Poor”, and
“Bad” were aligned with the five segments of the
scale. For analysis, the viewers’ responses were
GRAPP 2008 - International Conference on Computer Graphics Theory and Applications
440
digitised to range between 0 (lower end of the “Bad”
segment) and 100 (upper end of the “Excellent”
segment).
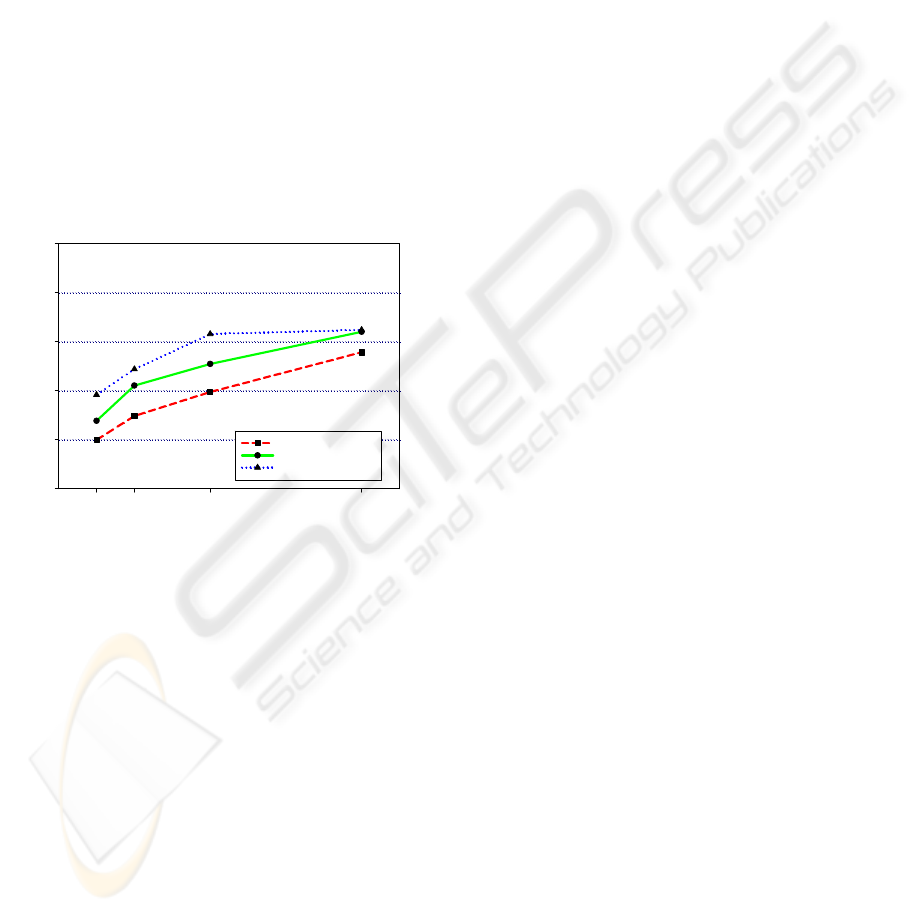
2.3 Results Forward Motion
The results for the Forward Motion case are shown
in Figure 1. It can be seen that perceived smoothness
increased with viewpoint density at all three speeds.
The speed functions appear to converge at the 4
views per foot density. However, the rate of increase
differed across speeds. For the fastest speed,
perceived smoothness reached its maximum already
with a 2 views per foot density. For the medium and
slow speeds, the rate of increase was much lower.
As a result, the number of viewpoints required to
maintain a certain level (e.g. 50) of perceived
smoothness decreased as the speed of movement
increased, and vice versa.
Figure 1: Mean perceived smoothness for forward motion.
3 EXPERIMENT 2 - LATERAL
MOTION
In this experiment, we simulated what the observer
would see if she/he were moving in the environment
from point A to point B along a straight path but
looking perpendicularly to the direction of motion.
Thus, this ‘sideway’ motion recreated viewing
conditions similar to those a viewer would
experience if he/she were looking outside the
window of a moving train.
3.1 Generation of Video Test Material
The video material consisted of five sequences
captured as in Experiment 1. Thus, we had four
natural sequences captured in a room setting with a
LadyBug camera. Two sequences, named
CastleLongLeft and CastleLongRight, represented a
movement of 24 feet along the longest axis of the
room but in opposite directions. The other two
sequences, named CastleShortLeft and
CastleShortRight, represented a movement of 10 feet
along the shortest axis of the room but again in
opposite directions. The fifth sequence (named
SaharaLongLeft) was a synthetic sequence generated
with the same environment used for Experiment 1.
The sequence simulated a movement along a 24 feet
distance. All five sequences had an original
viewpoint density of 4 views/foot. The pixel
resolution of all sequences was 1024 x 720.
These original sequences were used to generate,
as in Experiment 1, sequences having four levels of
viewpoint density: 4, 2, 1, and 0.5 views/foot at
three speeds: 3.8 (slow), 7.6 (medium), and 15.2
(fast) feet/second.
3.2 Subjective Assessment
Viewers, apparatus and subjective methodology
were the same as in Experiment 1.
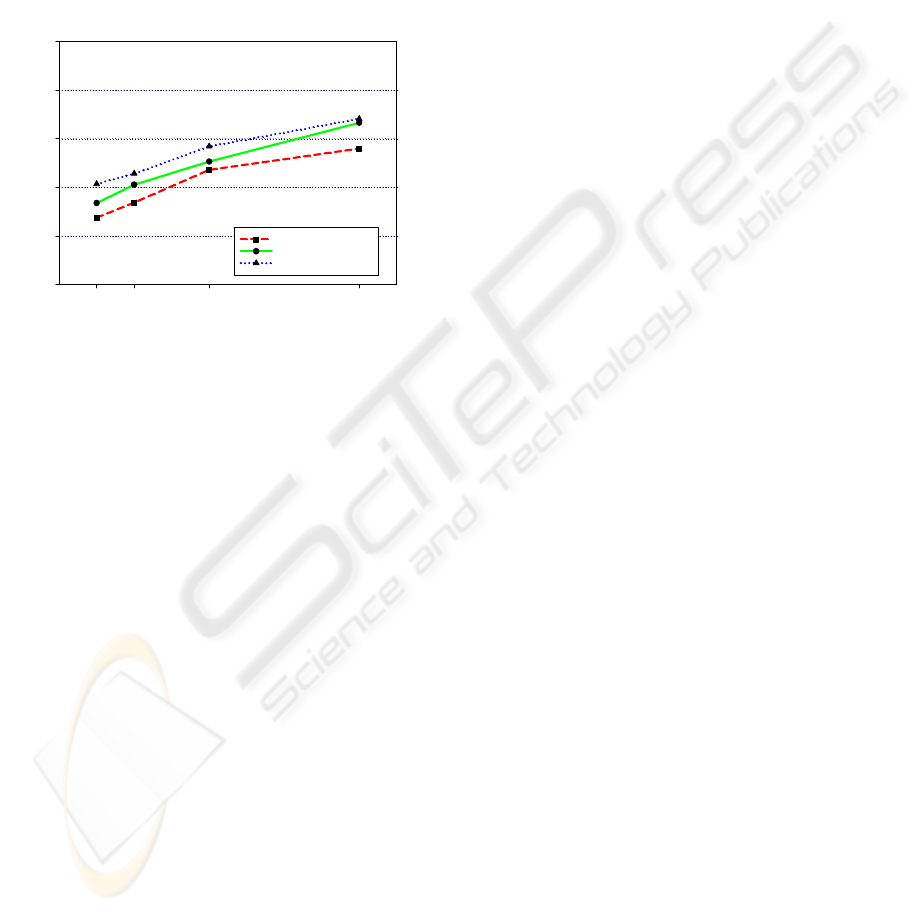
3.3 Results Lateral Motion
The results for the Lateral Motion case are shown in
Figure 2. These results are generally similar to those
observed for the forward motion case. However, the
convergence at the 4 views/foot density is far less
pronounced. Thus, the results suggest that lateral
motion might require higher densities than forward
motion, possibly because of the higher rate of
change of visual information associated with lateral
movements.
4 CONCLUSIONS
The results show that perceived smoothness varies
with viewpoint density. For the conditions of this
study, a viewpoint density of 4 views per foot
appears to be sufficient for the perception of smooth
movement at all three speeds. We also found that the
number of viewpoints needed to maintain a certain
level of perceived smoothness varies inversely with
speed of movement.
It might be noted that, overall, ratings of
smoothness were rather low. This was mostly due to
the results for the four natural images. These images
were captured by moving a camera in a stepwise
fashion. This resulted in successive images that did
Viewpoint Density (Views/foot)
0.5 1.0 2.0 4.0
Perceived Smothness
0
20
40
60
80
100
Slow (3.6 feet/sec)
Medium (7.8 feet/sec)
Fast (15.6 feet/sec)
IMAGE QUALITY IN IMAGE-BASED REPRESENTATIONS OF REAL-WORLD ENVIRONMENTS - Perceived
Smoothness of Viewpoint Transitions
441
not have the same optical central direction and
therefore in images that exhibited, in some cases, a
small spatial jitter from frame to frame. Future
research will be required to address the role of
spatial registration. Finally, it should be also noted
that we used actual images plus replications to
generate the test sequences. It is expected that using
interpolation will further improve perceived
smoothness. Future study will consider the
effectiveness of different interpolation algorithms.
Figure 2: Mean perceived smoothness for lateral motion.
REFERENCES
R.L. Knoblauch, M.T. Pietrucha and M. Nitzburg , 1996.
"Field Studies of Pedestrian Walking Speed and Start-
Up Time," Transportation Research Record (1538), pp.
27-38.
International Telecommunications Union, 2004. , ITU-R
Recommendation BT.500, “Methodology for the
subjective assessment of the quality of television
picture”.
F. Speranza, J.W. Tam, T. Martin, L. Stelmach and C.H.
Ahn, 2005. “Perceived smoothness of viewpoint
transition in multi-viewpoint stereoscopic displays,”
Proc. SPIE: Stereoscopic Displays and Applications
XII, Vol.5664, pp.72-82.
Viewpoint Density (Views/foot)
0.5 1.0 2.0 4.0
Perceived Smothness
0
20
40
60
80
100
Slow (3.6 feet/sec)
Medium (7.8 feet/sec)
Fast (15.6 feet/sec)
GRAPP 2008 - International Conference on Computer Graphics Theory and Applications
442
