
BEYOND GRAPHICS: INFORMATION
An Overview of Infovis Practices in the Field of the Architectural Heritage
J. Y. Blaise and I. Dudek
UMR CNRS/MCC 694 MAP – 184 av de luminy 13288 Marseille cedex 09, France
Keywords: Architectural heritage, Information visualisation, Graphic representation.
Abstract: Understanding and representing the evolution of architectural artefacts over time requires a careful
examination of heterogeneous, questionable pieces of data. Accordingly, our position is that computer
graphics can and will support such investigation if and only if they are designed, above all, as information
visualisation disposals (may the visual result be realistic or not). But contemporary practices often fail to
reach this goal. In this paper, we propose possible explanations, and argue why we believe the problem has
more to do with a lack of appropriate methodology than with technologies. As an answer, we introduce a
global methodological framework that claims to be at the intersection of figurative architectural
representation and of information visualisation. We finally back up this claim by presenting past and
contemporary examples showing there can be a bridge between the above mentioned fields.
1 INTRODUCTION
Computer graphics, and VR in particular, have had
in the past decade a growing influence on how
results of investigations about heritage architecture
can be presented. Their use has constantly widened,
with applications ranging for instance from the
exploitation of archaeological studies (Ando, 2003),
to survey processes engineering (De Luca, 2005);
and with various scales observed (ranging from
cities (Lerma, 2004) to architectural interiors
(Perkins, 2003). However in numerous research
works architecture has served mainly as a test bench.
When looking at architectural-heritage centered
expriments, one can observe that 3D models have
been widely used to portray “how a site could have
looked like in the past”. Their application to virtual
reconstruction (a questionable wording since
reconstruction implies more than bare re-drawing),
clearly has had an impact in terms of
communication. However, at this stage they remain
criticised and raise a number of questions among
researchers and practitioners. Two points can be
mentioned:
• a lack of readability (inferences made are
obscured in the final image);
• a lack of efficiency: researchers put time and
means into producing realistic 3D models which
remain an edge effect of their study.
And indeed, recent experiments with realistic 3D
modelling of heritage architecture like the “ Krakow
1650 3D model” (MHK, 2007) show there is a
growing concern, even in the context of scientific
popularisation, for less assertive visual results.
Considering the variety and powerfulness of tools
available, and the number of experiments carried
out, we believe it is time to sit and analyse where
and why, when applied to heritage architecture,
computer graphics often fail to be effective
investigation tools for scientists in the long run. In
this paper’s first section we propose two possible
explanations.
We also intend to show that, with the growing
influence of computers on their activity, researchers
in the field of the architectural heritage now need to
innovate in terms of method. In this paper’s second
section we introduce a possible methodological
framework called “informative modelling” that
integrates legacies from the fields of architectural
modelling and of information visualisation. But to
which extent are these a-priori distinct fields
compatible?
Our second claim will be that those two fields
can fruitfully complement one another when dealing
with what is at the heart of historic artefacts : partial
evidences. So in this paper’s third section we will try
to demonstrate through historic as well as
contemporary graphic designs that it is so.
147
Y. Blaise J. and Dudek I. (2008).
BEYOND GRAPHICS: INFORMATION - An Overview of Infovis Practices in the Field of the Architectural Heritage.
In Proceedings of the Third International Conference on Computer Graphics Theory and Applications, pages 147-150
DOI: 10.5220/0001100101470150
Copyright
c
SciTePress
2 APPLICATION FIELD
SPECIFIC BOTTLENECKS
So are solutions from the field of computer graphics
(partly) ill-suited to the field of the architectural
heritage? In this section we discuss two arguments
that we believe help delineating more accurately the
actual difficulties.
2.1 Partial Data vs Exhaustive
Geometry
Studying how an edifice or a site has changed over
time is primarily an information uncovering and
analysis task. Researchers carrying out this task are
faced with partial, heterogeneous, often questionable
evidence. An in-depth analysis of the various pieces
of evidence one can gather may help understanding
scraps of its history, with ever less density as we go
backwards in time. In other words, when the time
has come to recount visually the evolution of a site,
numerous shortages remain in the information set. In
parallel, a 2D/3D modelling solution will require an
exhaustive description of the site. A given x,y (z) is
needed for each point, a given shape needs to be
drawn ,etc.
And so ultimately, researchers are faced with an
incontrovertible fact: they are most often asked to
draw more than they really know. This observation
is corroborated in (Lecuyot, 2005): the archaeologist
commenting a virtual reconstruction produced for
television says “images are more demanding than
text of publications since they do not allow for
architectural omissions..”. With subjectivity, one
could read “even when we don’t know what we have
to draw”. Of course the popularisation of research
result may be a valuable objective. But (Alkhoven,
2006) underlines the danger of graphics-that-don’t-
say-that-they-cheat when she writes “documentation
of choices for 3D modelling is a pre requisite for
scientific research because these images will lead
their own life and others will base their research
upon these images”.
So how can we bridge the gap between incomplete,
imprecise data sets and exhaustive 3D modelling?
Documenting choices is here vital, and beyond this
visualising and giving access to these choices on the
long run (Dudek, 2007).
In his analysis of Minard’s contribution to statistical
graphics (C.J Minard, XIXth century pioneer of
thematic cartography), M.Friendly (Friendly, 1999)
gives us yet another hint when he writes “Minard
almost invariably chose accuracy of data over the
tyranny of precise geographical position when
conflict arose”. And this is in a way what the XIXth
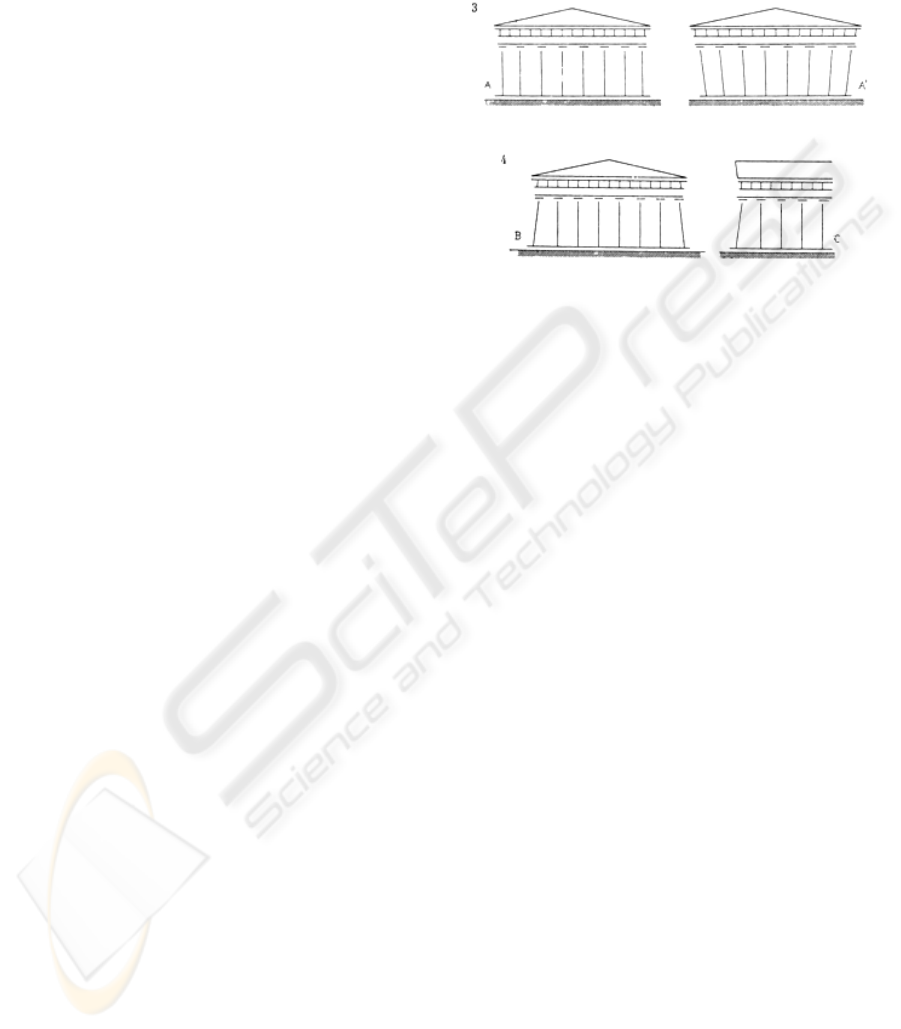
century architect Choisy (Choisy, 1899) does in his
explanation of how ancient Greeks handled visual
effects in the composition of porticos (Figure 1).
Figure 1: Choisy’s drawings do not correspond to the real
geometry of Greek compositions, but provide a real
information to the reader: top, right, the illusion of
divergence that the human eye naturally perceives,
bottom, the corrective disposal adopted by ancient Greeks.
And so the point is that whatever tools we are given,
may they be those of the XIXth century or those of
the XXIst century, it is our responsibility as users of
those tools to invent methods that will allow us not
to draw what we don’t know in a way that could let
others think that we know, but to draw all of what
we know in an information-enhancing way.
2.2 Representation vs. Visualisation
When facing the necessity to provide visual results
of an investigation, researchers or practitioners in
our application field will most often end up using a
3D modelling software. Our position is that prior to
using this or that tool, superseding other issues, is
this question: representation or visualisation?
In the tradition of architectural drawing,
representations are most often figurative. On the
contrary, visualisation is for (Spence, 2001) a
cognitive activity, wherein the objective is a gain of
insight. But looking at it from closer, this may not be
an opposition. When E.R Tufte (Tufte, 1990) writes
“we envision information to reason about
knowledge, to document, to communicate and
preserve this knowledge” he undoubtedly covers the
activity of researchers involved in our field.
Furthermore, J.Bertin defines graphic representation
as a
“system of signs that humans have developed to
retain, understand and communicate the
observations that they need” (Bertin, 1998).
Thereby the key is given: finding a system of signs
that would be suited to our observations.
GRAPP 2008 - International Conference on Computer Graphics Theory and Applications
148
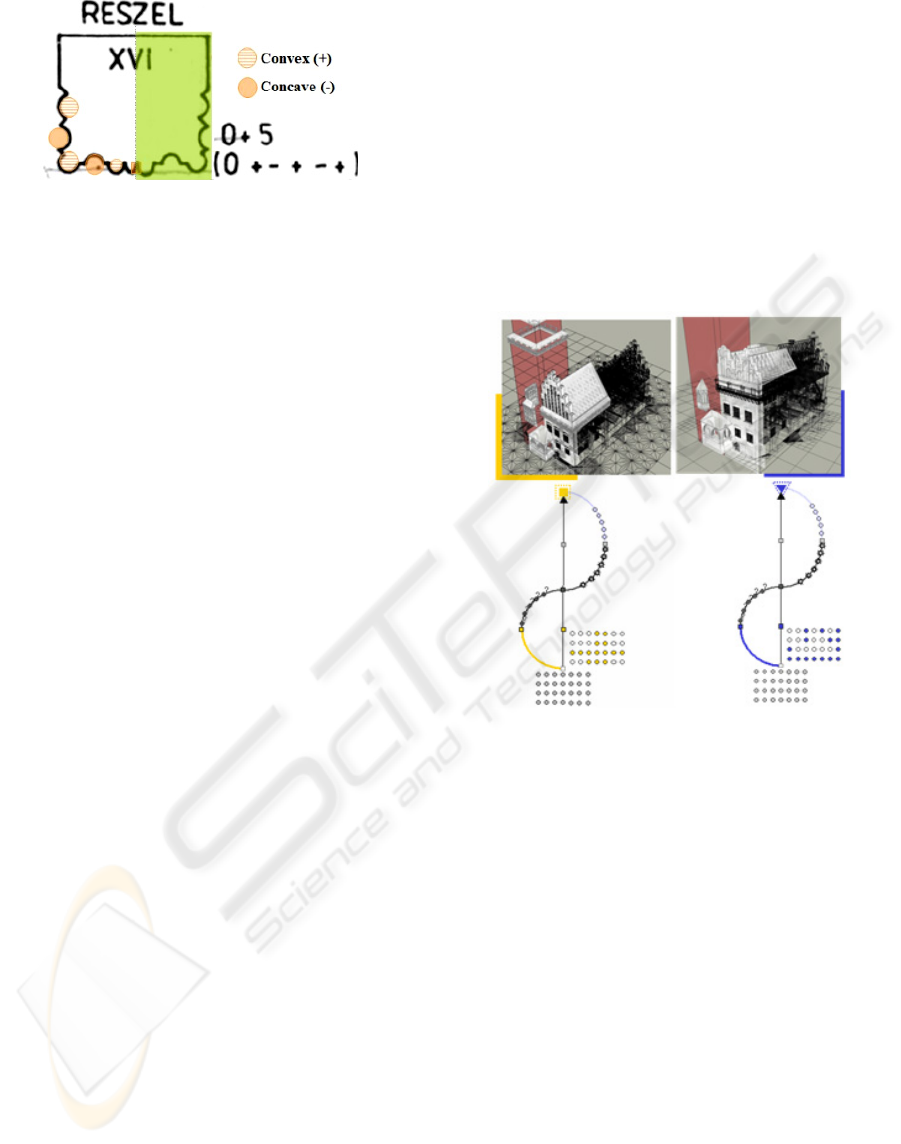
Figure 2: A brilliant integration of figurative drawing with
abstract visualisation from (Tajchman 1989) : a specific
ceiling beam observed in the town of Reszel (Poland) is
described as alternate convex/concave mouldings (on its
half-section). Zero identifies a flat zone on its axis. The
beam is a “O+5”, an easier formalism for data treatment.
3 A METHODOLOGICAL
FRAMEWORK
In the previous section we hope to have
demonstrated that, when visualising information
about artefact changes, tools do not forbid nor
encourage good practices (although computer tools
do have a strong influence which we wish not to
detail inside this contribution): So if the blame
cannot be put on the tools, then maybe on lacking
methods? As an answer, we have introduced in
(Dudek, 2005) methodological framework called
informative modelling. We perceive informative
modelling as a bridge between information
visualisation and architectural modelling. From the
latter it inherits a priority given to 2D/3D space-
enabled disposals. From the former it inherits an
ambition to amplify cognition (Kienreich, 2006)
about the artefact. But informative modelling applies
to the study of historic architecture, where objects
have most often been transformed, and consequently
where what is known about objects remains partial.
As a consequence, whereas in traditional
architectural modelling a realistic representation of
objects is considered as an end, in the informative
modelling methodology the representation of
architectural objects is used primarily as support for
information search and visualisation, and does not
strive for realism. Abstraction (the infovis legacy)
and figuration (the architectural representation
legacy) are integrated as alternative/mixable modes
of representation, allowing partial knowledge to be
communicated and notions such as data uncertainty
to be conveyed graphically. In (Dudek, 2007) we
have introduced a grid of fourteen modelling rules
(plus one), designed as safeguards helping
researchers to support their activity with sustainable
and information-effective graphics. These rules are
nothing more than a best-practice grid, but
encompassing a wide range of issues (information,
models, representations, abstractions). The fifteenth
rule will give the reader an idea of what informative
modelling is all about: If a 2D/3D model does not
produce a gain of insight into the underlying
information - it should be considered worthless.
In this contribution we wish to conclude by
presenting examples showing where architectural
representation and information visualisation have
met in past practices, and can still meet. E.R Tufte’s
layering and separation (Tufte, 1990) in graphic
design gives us here a good thematic frame.
Figure 3: An illustration of rule Number 2: “The
representation of an object will allow the user to retrieve
data and information that justify the presence of the object
at the time and date the representation shows.” From
various information sub-sets various layouts can be
derived (note transparency/color coding for uncertainty
handling). Shown here three layouts corresponding to
three selections inside the information set on Kraków’s old
town hall. (from the left to right : reconstructions by F.
Christ (1950) and A. Essenwein (1869), survey by S. Von
Livonegg (1802)).
4 VISUAL STRATIFICATION
Due to the complexity and heterogeneity of related
information sets, visualising evidences about
artefacts – through 2D/3D models – can end up in
confusion and disorder. Interfacing the information
sets hereby raises a new methodological issue:
operating selections and stratification in order to
lighten the cognitive effort. In the field of
information visualisation, E.R. Tufte (Tufte, 1990)
acknowledges the importance of this information
BEYOND GRAPHICS: INFORMATION - An Overview of Infovis Practices in the Field of the Architectural Heritage
149
stratification step (prior to the making of a
representation) in those words: “[...] among the most
powerful devices for reducing noise and enriching
the content of displays is the technique of layering
and separation [...]”. Today’s tools provide
technical possibilities for layering and separating
information, but give no hints on how to perform the
selection itself with regards to the specificity of the
information and/or of the geometric objects in
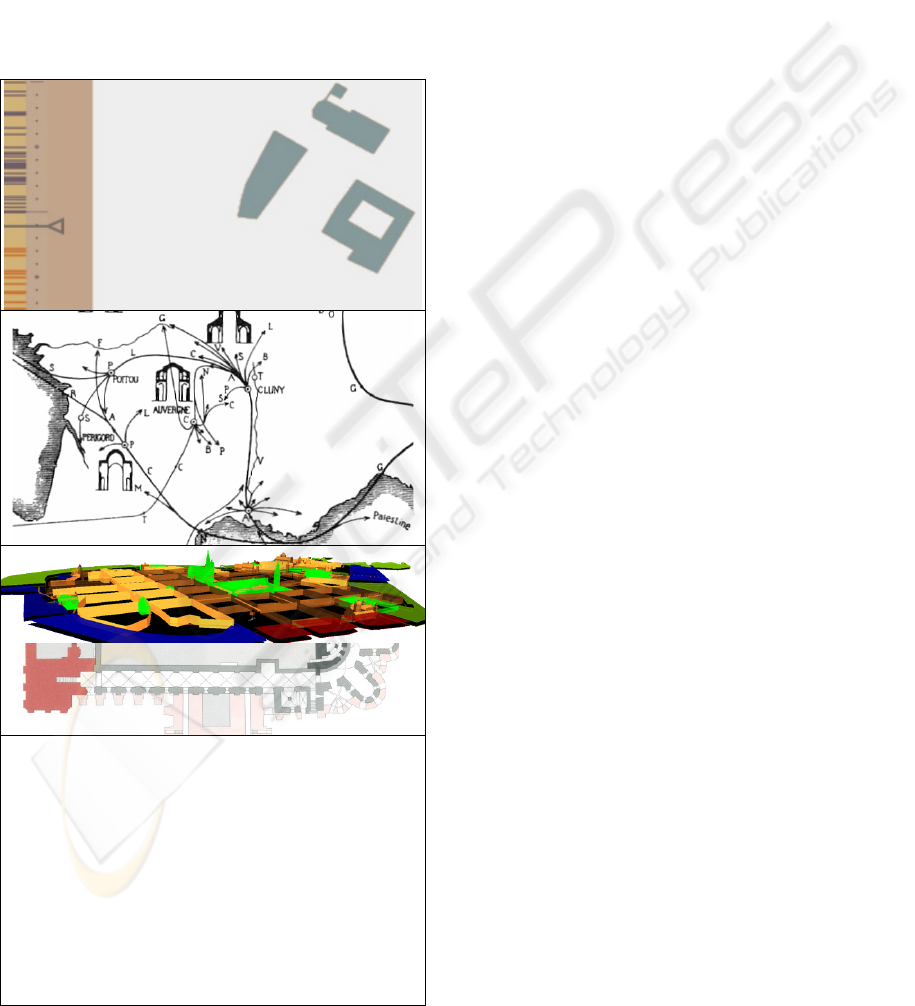
charge of localising the information. We propose in
the tables below one example (time handling) of
how layering and separation contributes to widen
graphic design options in our field of application.
Top, partial view of a dynamic SVG timebar: the density
of changes is visualised (each line of the left vertical bar,
representing time, identifies a given change, with
“wholes” in the city’s chronology thereby underlined),
the city layout at each phase is displayed (right) as the
user interactively moves the triangular cursor of the
timebar.
Middle, in this masterly visualisation (partial view), A.
Choisy recounts the spatio-temporal development of the
main Romanesque schools with a combination of
cartography and sections (Choisy, 1899).
Bottom, color coding as a mean to identify and separate
time slots (Dudek, 2005) (Pérouse, 1995).
5 CONCLUSIONS
Among specialists of historic architecture, computer
graphics, and VR in particular, are naturally
considered as seducing, but also often needlessly
verbose and assertive, and vain in terms of scientific
result. We believe this view may change provided
that we put methodological issues first. And our
claim is that a good way to do so is to integrate
concerns stemming from the field of information
visualisation in the practice of architectural
representation.
REFERENCES
Alkhoven, P, 2006. Less is more. Visual truth and the
benefits of abstraction in 3D representations of
buildings. In Proc. MIA 2006, Mia journal vol0 n°1.
Ando, M., Networked VR for virtual heritage, in HCI
International 2003 - vol. 3, LEA publishers.
Bertin, J.; Sémiologie graphique, EHESS 1967/1998.
Choisy, A., 1899-1991 (History of architecture) Histoire
de l ’Architecture Inter-Livres.
De Luca L, Véron, P, Florenzano, M, 2005. “Reverse
engineering of architectural buildings based on a
hybrid modelling approach”, Computers & Graphics.
Vol. 30.
Dudek I., Blaise, J.Y., 2005. From artefact representation
to information visualisation: genesis of informative
modelling In LNCS Volume 3638/2005, Proc
SmartGraphics 2005.
Dudek I., Blaise, J.Y., 2007. Informative modelling Mia
journal vol1S
Friendly, M, 1999. Re-visions of Minard in Statistical
computing and graphics newsletter vol 11, n° 1.
Kienreich, W., 2006. Information and Knowledge
Visualisation: an oblique view MIA Journal Vol0 n°.1.
Lecuyot, G, 2004. La restitution 3D de la ville d'Aï
Khanoum in journal CNRS n°178
Lerma, J.L, Vidal, J, Portalés, C, 2004. Three dimensional
city model visualisation for real-time guided museum
tours The photogrammetric record 19(108).
MHK (Muzeum Historyczne Miasta Krakowa), 2007,
Civitas Nostra Cracoviensis, A.D.1650 CD Rom
Perkins, A. 2003 The Cone Sisters’ Apartments: Creating
A Real-Time, Interactive Virtual Tour in Proc. ICHIM
03 Paris France.
Pérouse de Montclos, J.M, 1995, (Ed.) Le guide du
Patrimoine – Centre Val de Loire. Hachette.
Spence, R., Information vizualisation. Addison Wesley
ACM Press 2001
Tajchman J., 1989. Stropy drewniane w polsce. Propozyca
systematyki Ośrodek dokumentacji zabytków.
Tufte, E. R. 1990. Envisioning information, Graphic Press,
Cheshire, Connecticut
GRAPP 2008 - International Conference on Computer Graphics Theory and Applications
150
